Holly History: Signals in the Money
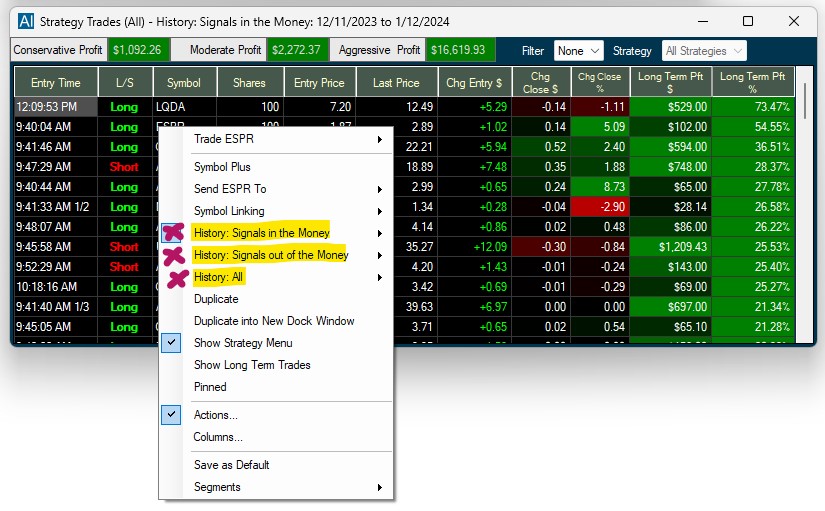
The Holly History Window enables you to switch between Holly's real-time and past trades. To access the function, right-click into the AI Strategy Trades Window and select one of the following three options:
- History: Signals in the Money
The Signals in the Money Window allows you to see Holly’s past trades for the chosen time period ranked by long-term profit in percent with the highest return at the top and ending at 0%.
- History: Signals out of the Money
The Signals out of the Money Window allows you to see Holly’s past trades for the chosen time period ranked by long-term profit in percent starting at 0% and descending into negative values.
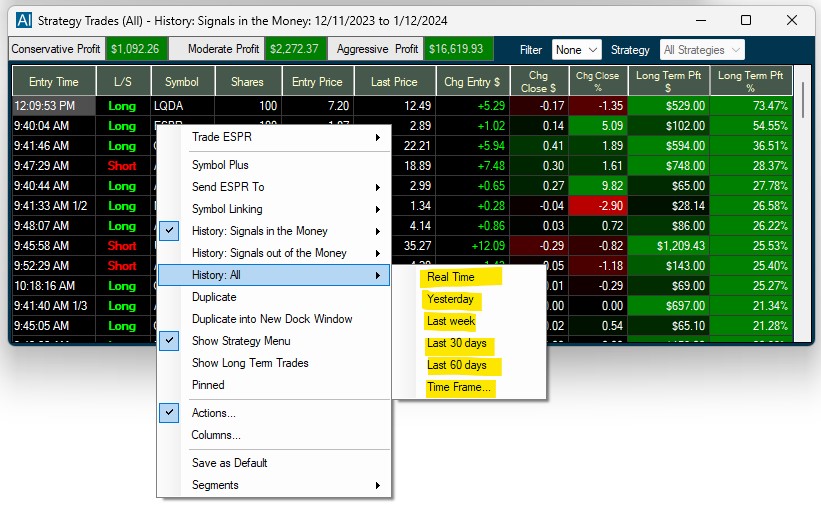
- History: All
The All History Window allows you to see all Holly’s past trades for the chosen time period ranked by long-term profit in percent starting at the highest percentage return and ending at the lowest percentage return.
Each option allows you to refine the results by selecting specific days or a time period for your review.
You can sort the output of these History Windows by specific columns. If I would like to, for example, see the highest profit in conservative risk mode for the last 30 days, just double-click the Conservative Profit column to sort by it.
To transfer the column entries into a spreadsheet, highlight the rows either by clicking and holding down your left mouse key while moving over the rows or by pressing the Control and A key on your keyboard. To copy your selection, press the Control and C key on your PC’s keyboard. Finally, press the Control and V key to paste the selected rows into your spreadsheet.
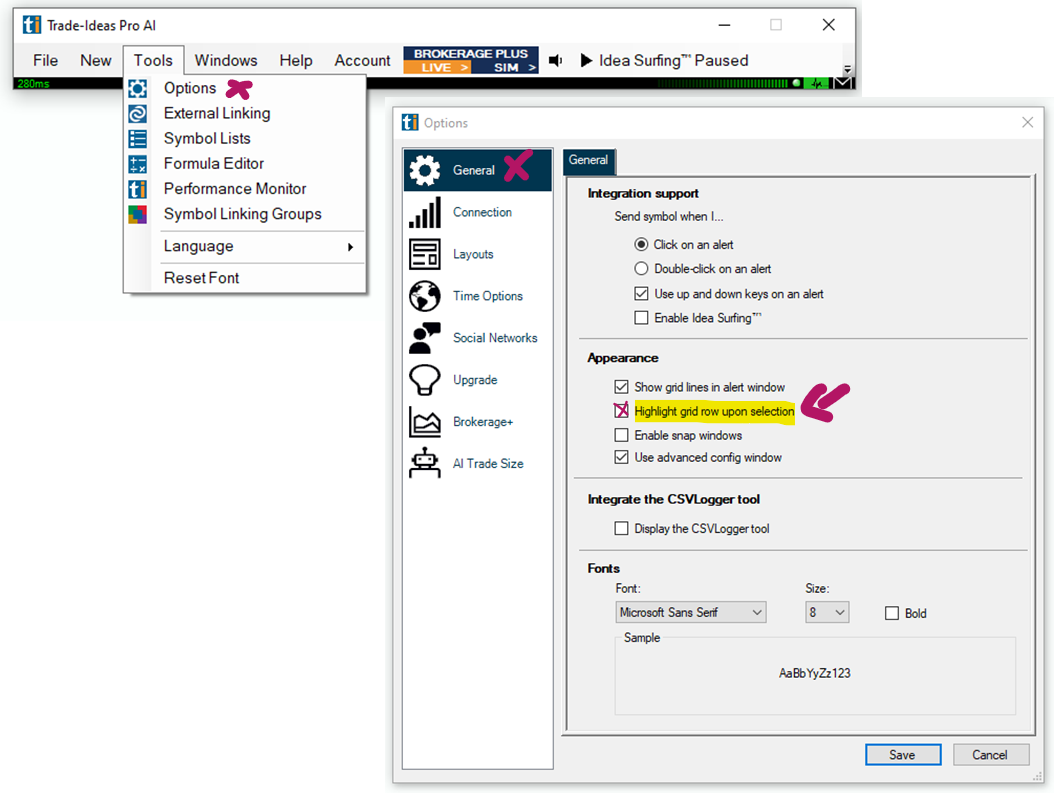
Go to the Toolbar, select Options, Layouts, and then Highlight grid row upon selection to highlight entire rows with one mouse click. If this setting is disabled, you can highlight single columns.
To learn more about Holly have a look at the following Nasdaq articles:
NASDAQ September 2021 AI Dashboard
NASDAQ August 2021 AI Dashboard
NASDAQ July 2021 AI Dashboard
NASDAQ June 2021 AI Dashboard
NASDAQ May 2021 AI Dashboard AI Dashboard
NASDAQ April 2021, AI Dashboard AI Dashboard
NASDAQ March 2021, AI Dashboard AI Dashboard
NASDAQ February 2021 AI Dashboard AI Dashboard
NASDAQ January 2021 AI Dashboard AI Dashboard
NASDAQ December 2020 AI Dashboard AI Dashboard
NASDAQ November 2020 AI Dashboard
NASDAQ October 2020 AI Dashboard
NASDAQ September 2020 AI Dashboard
NASDAQ August 2020 AI Dashboard
NASDAQ July 2020 AI Dashboard