Layouts & Scans
It is our goal to make the use of our software as easy as possible, especially for trading beginners.
This section contains cloud links to premade scans and layouts, including videos and descriptions.
The layouts are so-called Starter Layouts, they are designed for new traders and are meant to serve as a good starting point.
All layouts are fully customizable, so feel free to change things around as you go along.
Day Trading Starter Layout 1: Finding Relative Strength
Day Trading Starter Layout 2: Pullbacks & Breakouts
Day Trading Starter Layout 3: Stocks in Play
Swing Trading Layout 1: Curated Stock Picks
Starter Layout 1: Finding Relative Strength with Races
>>> Load the Cloud Link
Layout Contents: Charts x 2, Stock Race x 1, Price Alerts Window x 1, Single Stock Window x 1, Brokerage Plus Module/Chart Trading x 1
There are times when the stock market can be frustrating and trading can be an emotional rollercoaster. But we can help you to succeed, no matter the market conditions! Our brand-new, unique tool is especially suited to the current market and will get you into the best trades every day, by detecting Relative Strength.
Incorporating new techniques can be daunting, but adaptation and flexibility will make you a more profitable trader, and ultimately lead to the freedom you are longing for.
Starter Layout 2: Pullbacks & Breakouts
>>> Load the Cloud Link
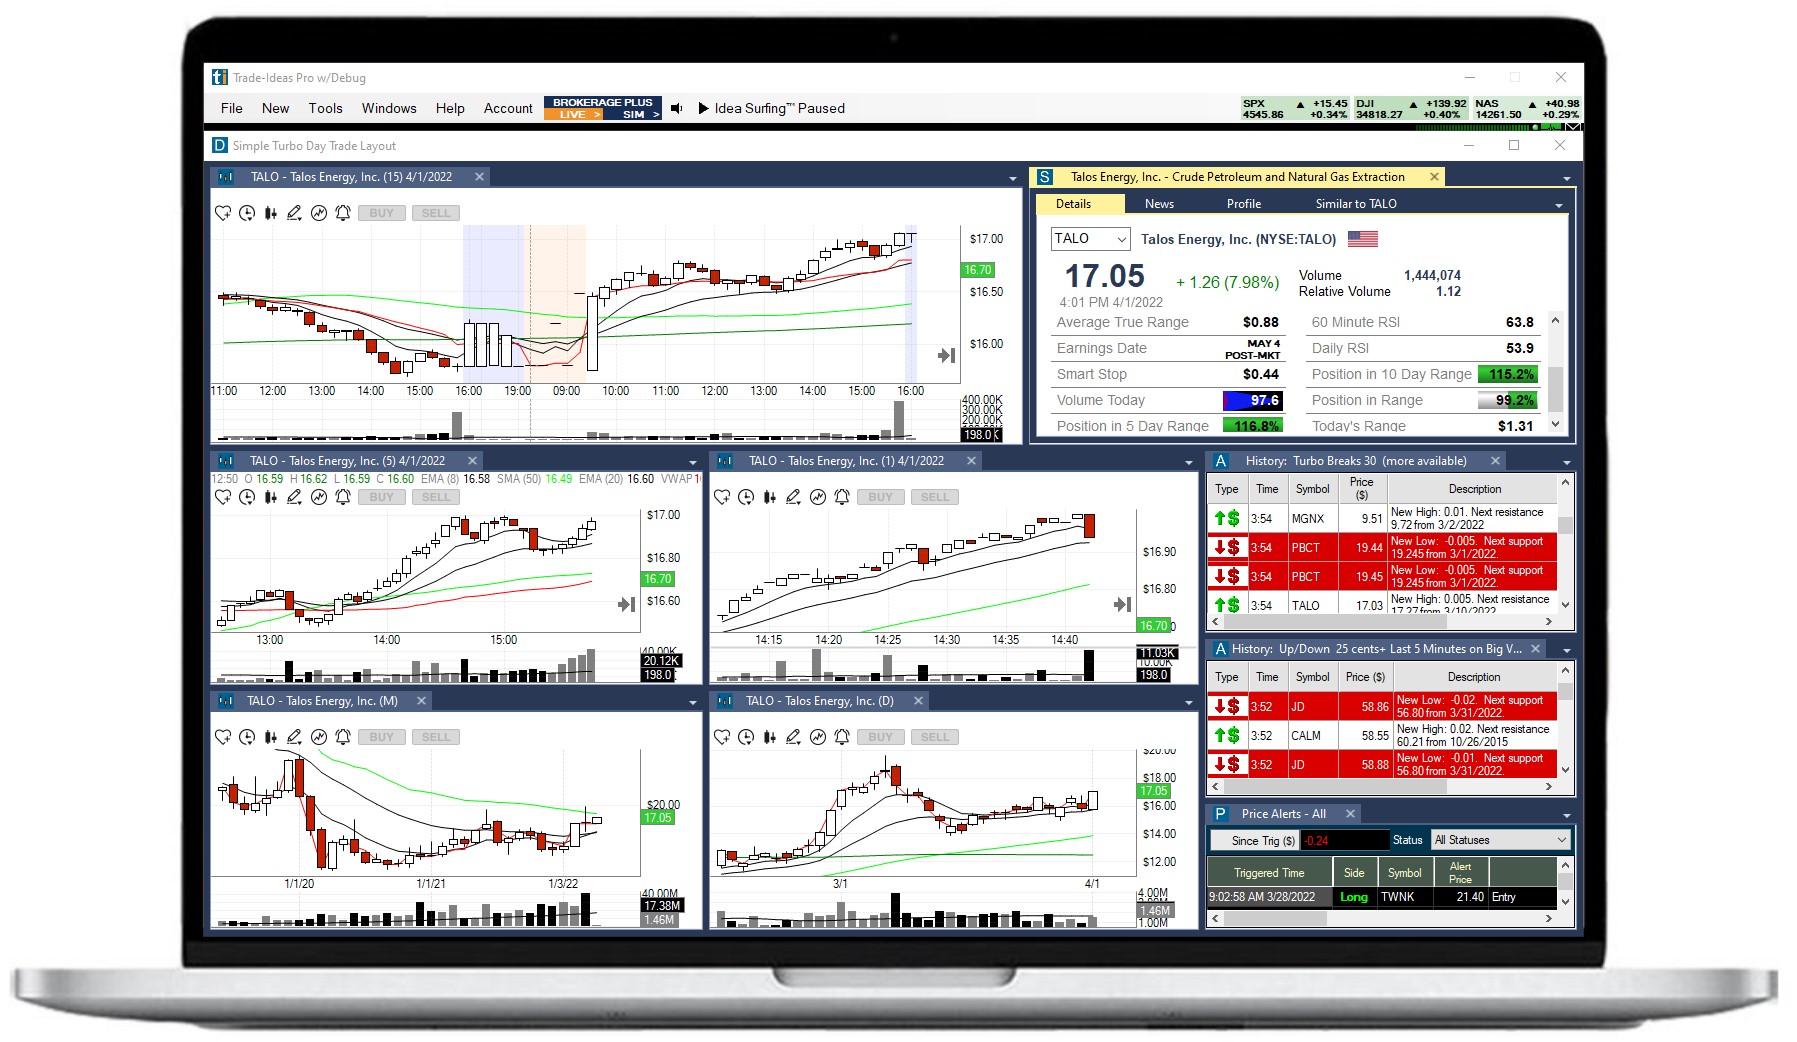
Layout Contents: Charts x 3, Alert Window Scans x 3, Single Stock Window x 1
Scan #1: Pullback, 5 Minute High
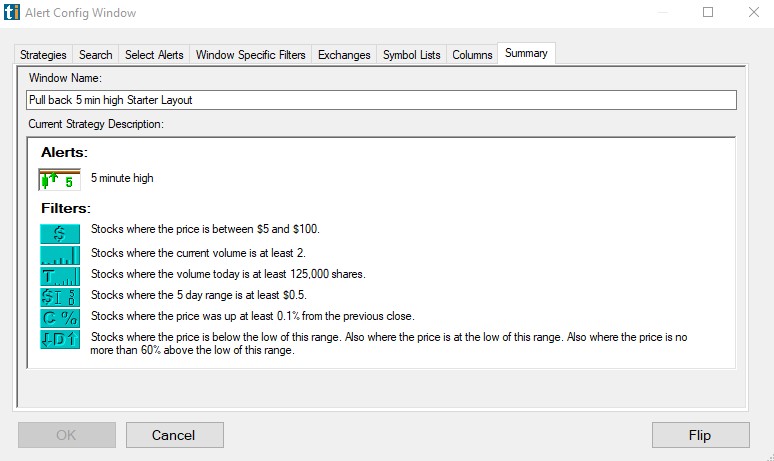
Stocks will appear on this scan, when they make a 5-Minute High and...
- Are between $5 and $100
- Have a Relative Volume of 2 or higher. The Relative Volume filter is great at finding stocks in play. It looks at the 10 Day Volume Average for this time of day of the stock and compares it to the current trading volume. A Relative Volume of 1 would be normal, we're looking for stocks that are on par to trade at least double their average volume.
- Have traded at least 125,000 shares already on the day
- Have a 5-Day Range (high to low) of at least 50 cents
- Have moved up at least 0.1% from the previous close
- Are currently at least 40% below the High of the Day. Or in other words, no more than 60% above the Low of Today's Range. This filter helps us to find stocks that are currently in a Pullback.
Scan #2: Down Yesterday, Up Today
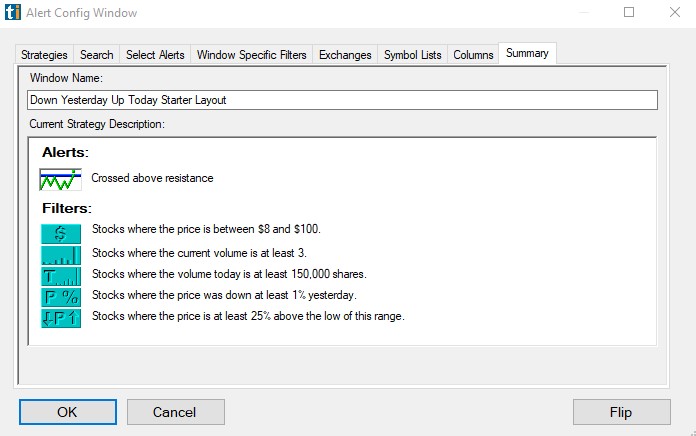
Stocks will appear on this scan, when they Cross Above Resistance and...
- Are between $8 and $100
- Have a Relative Volume of 3 or higher. The Relative Volume filter is great at finding stocks in play. It looks at the 10 Day Volume Average for this time of day of the stock and compares it to the current trading volume. A Relative Volume of 1 would be normal, we're looking for stocks that are on par to trade at least three times their average volume.
- Have traded at least 150,000 shares already on the day
- Have been down at least 1% yesterday.
- Are currently at least 25% above Yesterday's Low.
Scan #3: Crossed Resistance With Volume
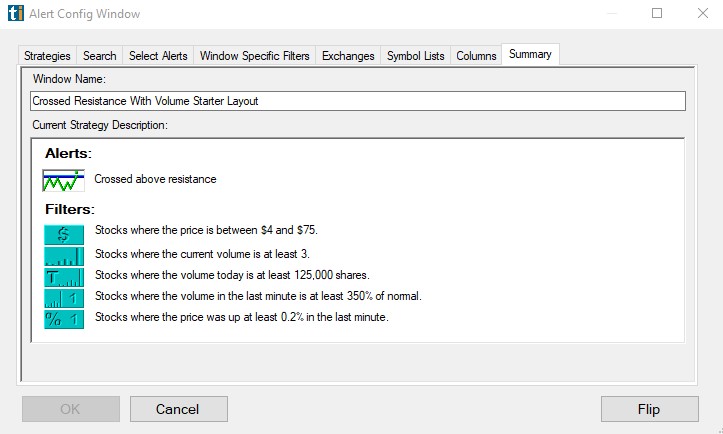
Stocks will appear on this scan, when they Cross Above Resistance and...
- Are between $4 and $75
- Have a Relative Volume of 3 or higher. The Relative Volume filter is great at finding stocks in play. It looks at the 10 Day Volume Average for this time of day of the stock and compares it to the current trading volume. A Relative Volume of 1 would be normal, we're looking for stocks that are on par to trade at least three times their average volume.
- Have traded at least 125,000 shares already on the day
- Have traded at least 3.5 times as much as normal/expected (based on a 10 Day Average) in the last minute.
- Have moved up at least 0.2% in the last minute.
Starter Layout 2: Stocks in Play Today
>>> Load the Cloud Link
Layout Contents:
Charts x 5, Alert Window Scans x 2, Single Stock Window x 1, Price Alerts Window x 1
Scan #1: Turbo Breaks Up & Down
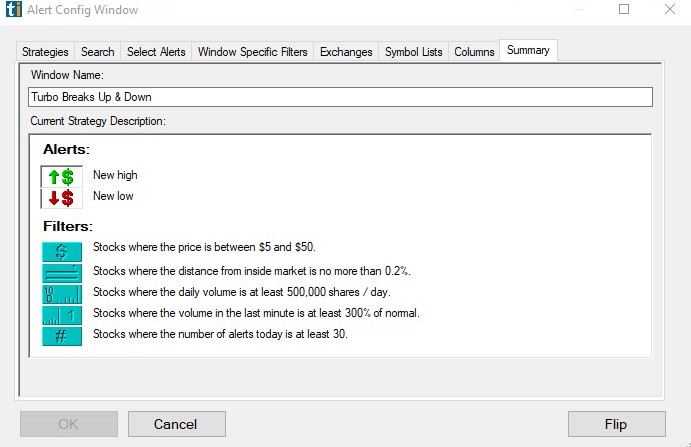
Stocks will appear on this scan, when they make a New High or a New Low and...
- Are between $5 and $50.
- With a print no more than 0.2% away from the inside market. The Distance from Inside Market filter is used to separate legitimate prints from bad prints. The further a print is from the inside market, the less reliable the alert is, so this filter helps to find tradeable alerts, and prices you can actually get.
- Have traded at least 500,000 shares per day over the last 10 days.
- Have traded at least 3 times as much as normal/expected (based on a 10 Day Average) in the last minute.
- Have made a New High or a New Low at least 30 times today already.
Scan #2: Up/Down 25 cents+ Last 5 Minutes on Big Volume
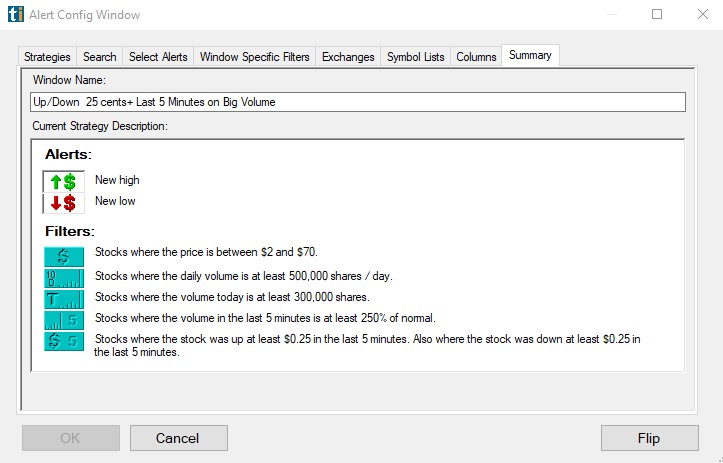
Stocks will appear on this scan, when they make a New High or a New Low and...
- Are between $5 and $70.
- Have traded at least 500,000 shares per day over the last 10 days.
- Have traded at least 300,000 shares already on the day.
- Have traded at least 2.5 times as much as normal/expected (based on a 10 Day Average) in the last 5 minutes.
- Have moved up or down at least 25 cents in the last 5 minutes.
Swing Layout 1: The Trader's Eye
>>> Load the Cloud Link
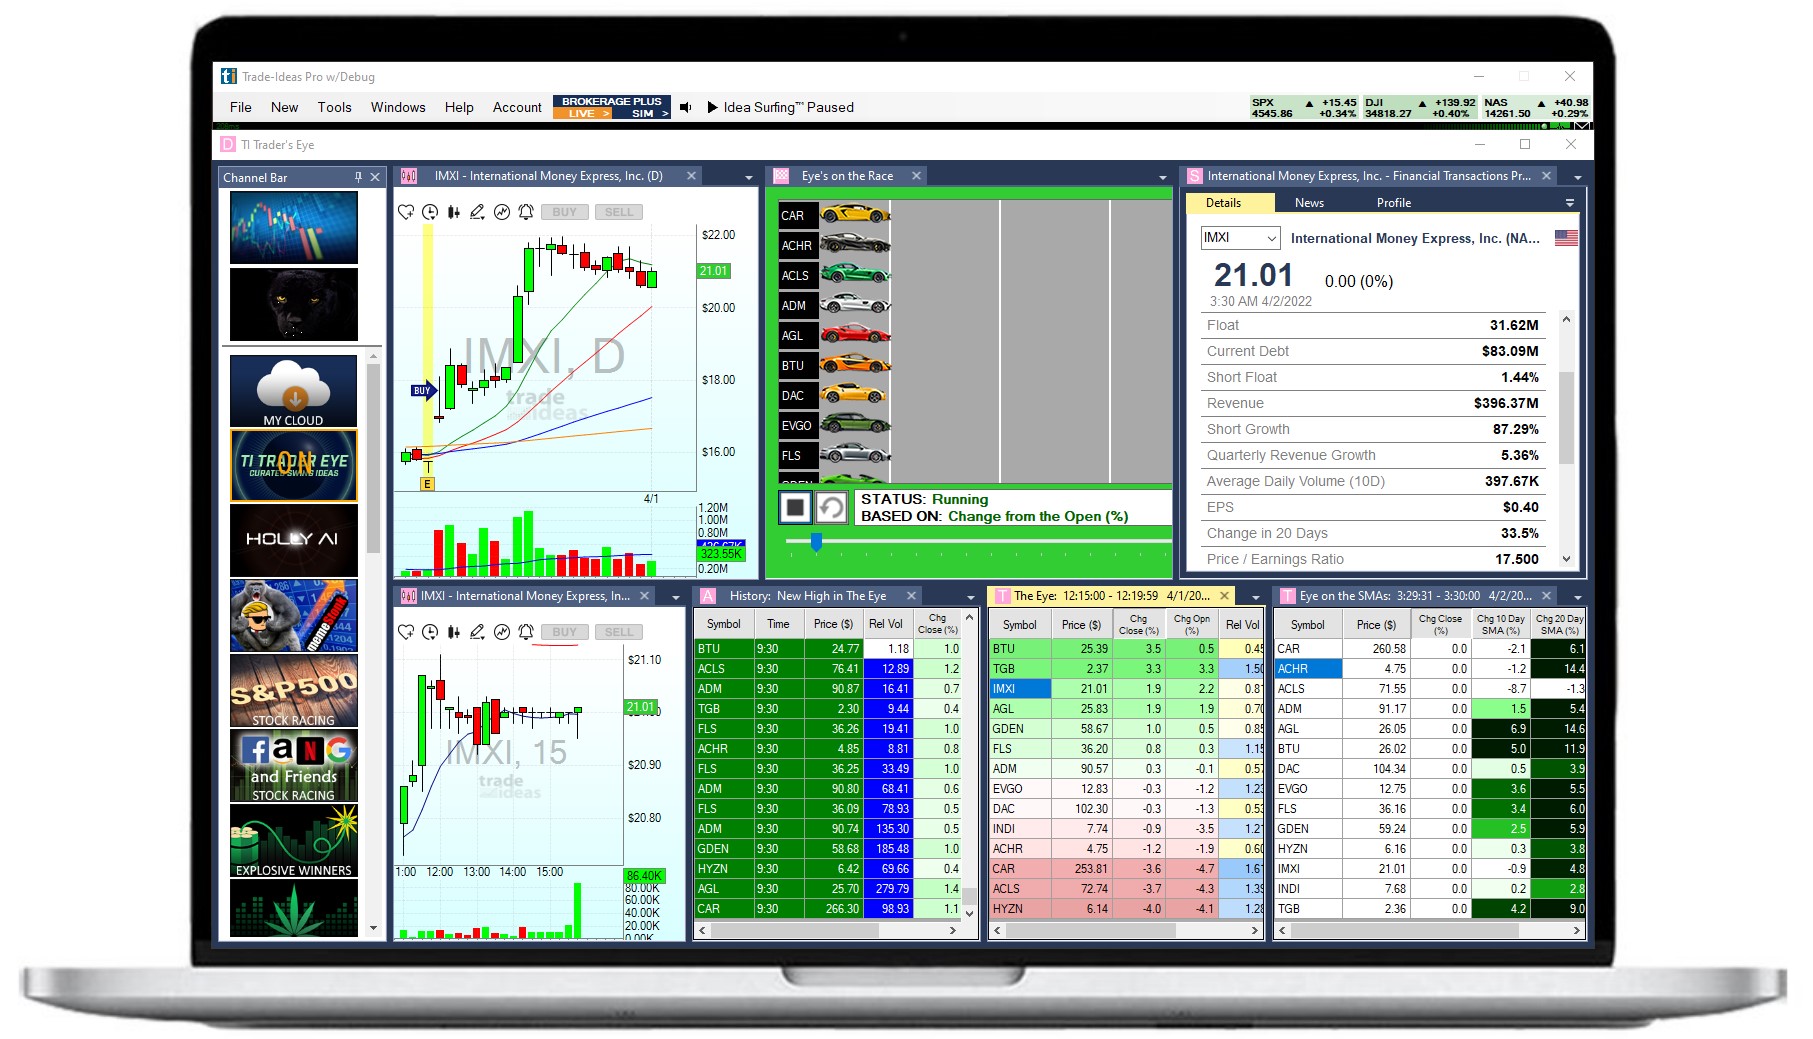
Layout Contents: Charts x 2, Alert Window Scans x 1, Top List Window Scans x 2, Single Stock Window x 1, Realtime Stock Race Window x 1
This layout can also be found in our Trader's Eye Channel. It focusses on a curated list of promising swing stocks that are expected to move higher (long trades only). All stocks have been evaluated and handpicked by our TI Traders to give you an edge and enable you to benefit from decades of trading experience.
There is, however, no guarantee that these stocks will move as expected, and the daily list does not constitute trading advice. Please also note, that trading success relies heavily on having a trading plan and sticking to it.
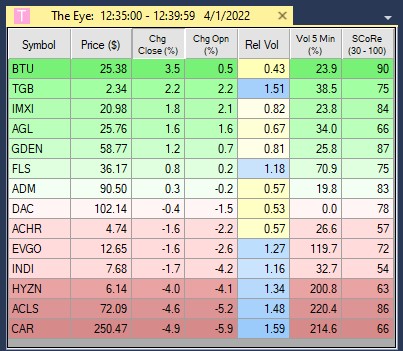
Scan #1: The Eye
Daily evaluated, curated list of promising swing stocks ranked by biggest Change from the Close Today.
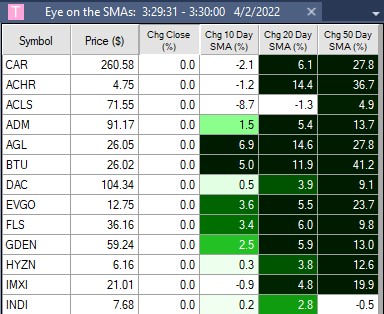
Scan #2: Eye on the SMAs
Daily evaluated, curated list of promising swing stocks ranked by biggest Change from the Close Today.
This scan is used to monitor each stocks proximity to the key moving averages (10, 20 and 50 Day SMA).
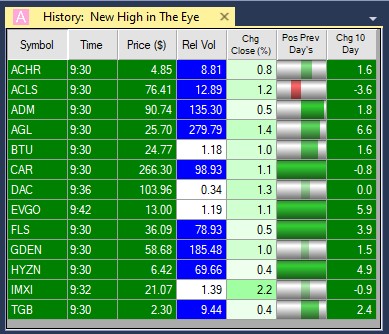
Scan #3: New High in the Eye
Daily evaluated, curated list of promising swing stocks making New Highs right now.
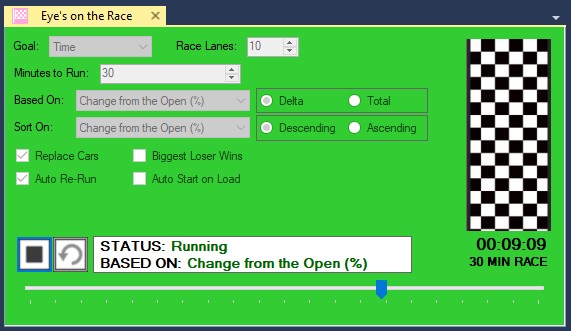
Scan #3: Eye's on the Race
Daily evaluated, curated list of promising swing stocks racing against each other in 30 minute intervals based on their real-time moves. The winner of each race will be listed on the right.
To build you own layouts and scans, have a look at Episode 4 to 9 of the Getting Started Series:
Individual Scans
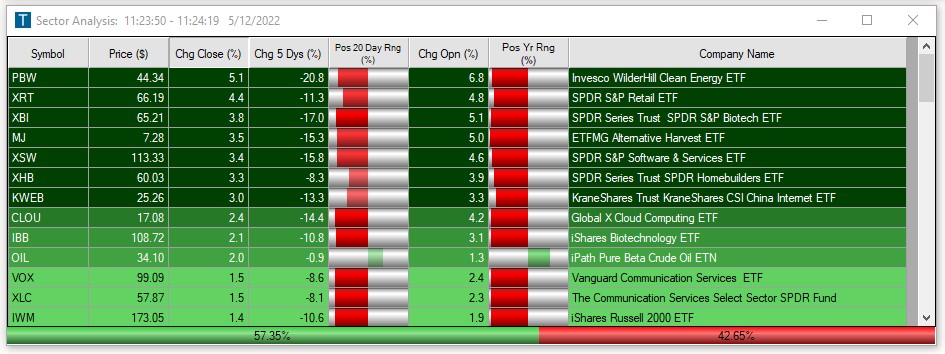
Scan #1: Sector Analysis Top List
>>> Load the Cloud Link
This list of EFT’s shows the most active sectors. Its purpose is to give traders a feel for the current market. This Sector Top List contains no exclusionary filters, it simply ranks the ETFs by Change from Close % with biggest on top.
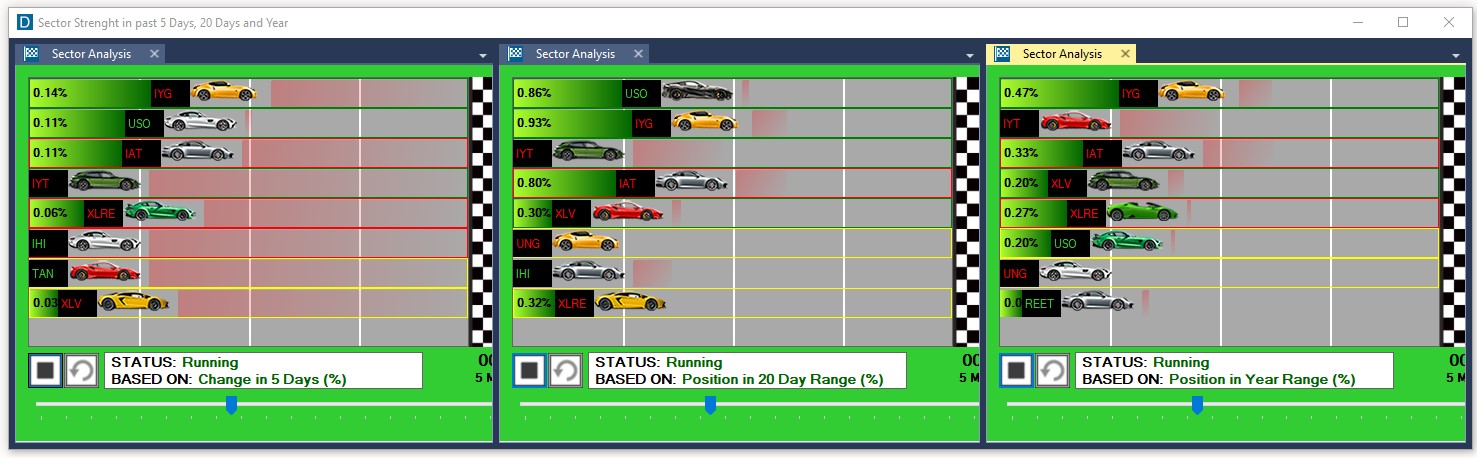
Scan #1a: Sector Analysis Stock Race
>>> Load the Cloud Link
See the strongest sector ETFs race against each other in real-time, based on their strength in the last 5 Days, 20 Days and Year.
Scan #2: Parabolic Moves
>>> Load the Cloud Link
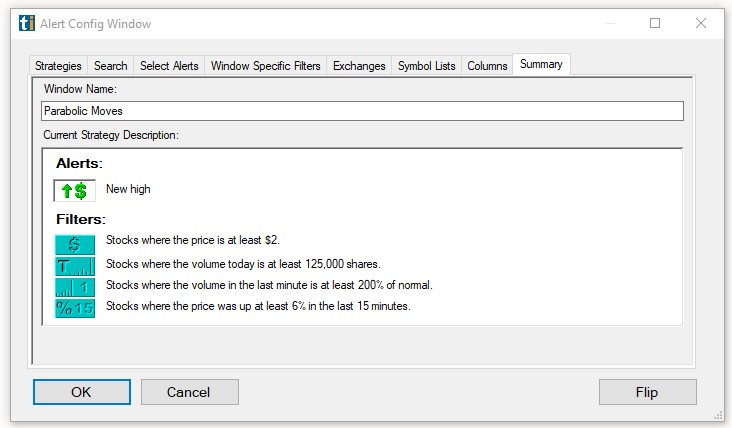
Stocks will appear on this scan, when they make a New High and...
- Are trading at $2 or more.
- Have traded at least 125,000 shares already on the day.
- Have traded at least 2 times as much as normal/expected (based on a 10 Day Average) in the last 1 minutes.
- Have moved up at least 6% in the last 15 minutes.
Watch the video to learn more about this scan:
To build you own layouts and scans, have a look at Episode 4 to 9 of the Getting Started Series: