Performance Monitor
The Performance Monitor will provide valuable insight into the performance and health of the app as well as the overall system. It acts as an early warning system and is a valuable troubleshooting tool, especially when it comes to system performance issues.
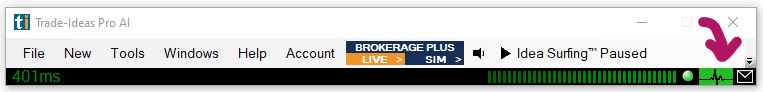
The Performance Monitor will change colors depending on how hard your system is working in order to keep up with the workload.
When everything is running as it should, the Preformance Monitor icon in the Status Bar will be green.
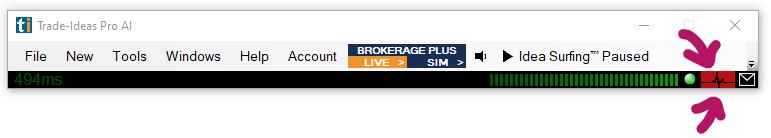
Yellow is marginal, and Red indicates a risk of decreased performance. In other words, too many active windows. The threshold for these settings will improve over time.
A double click on the icon will open the Performance Monitor window which will provide further details.
The Performance Monitor can also be accessed from the Tools Tab of the Toolbar.
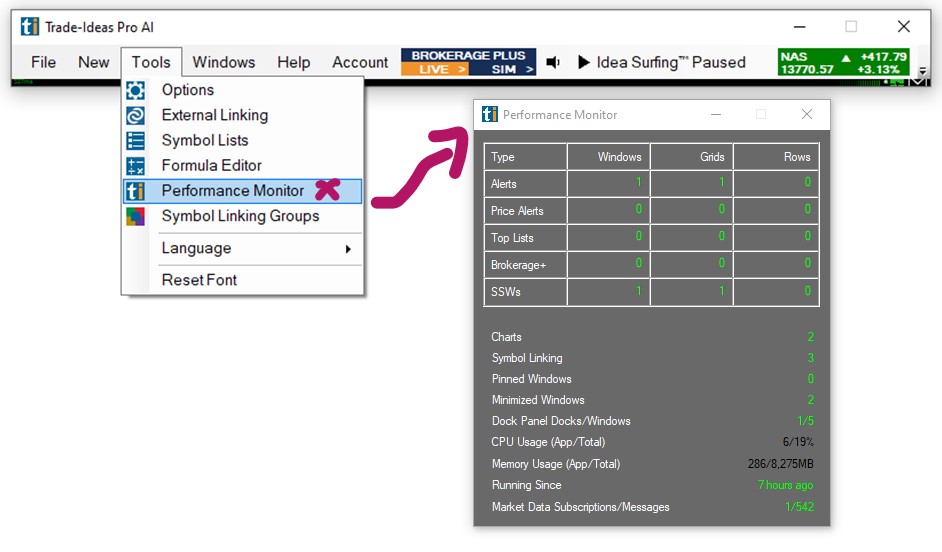
It provides an overview of the number and types of windows that are running as well as your overall system performance (e.g. CPU Usage and Memory Usage).
Any item that could be cause for concern will be displayed in red.