Markup
To mark up the Chart with Lines, Trendlines, Arrows, or Text Annotations, right-click into the Chart and select Markup.
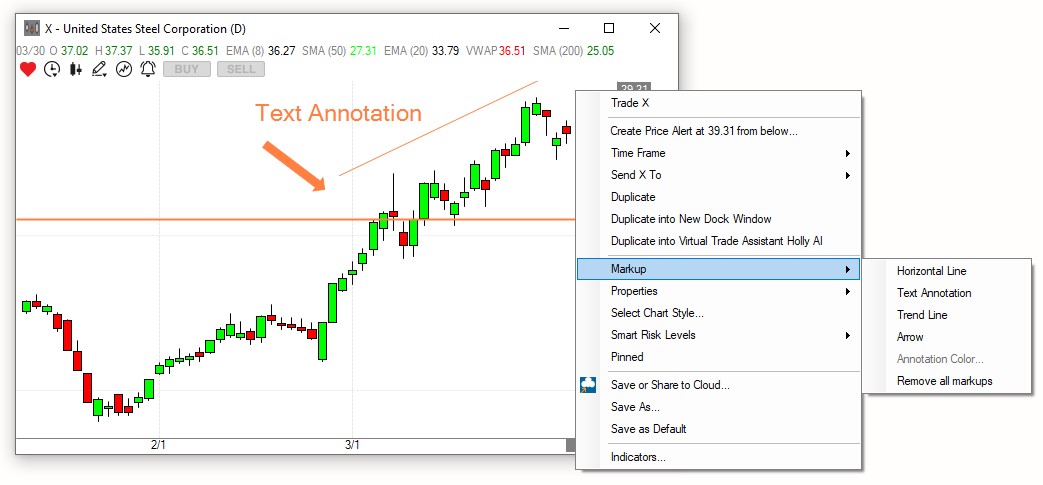
You can change the Annotation position via drag and drop, you can change the size or direction of Trend Lines and Arrows via grab and drag.
To change the color of any Annotation, select it from the menu, place it on the chart and highlight it with your mouse thereafter. Now, right-click again, select Markup, and then Annotation Color.
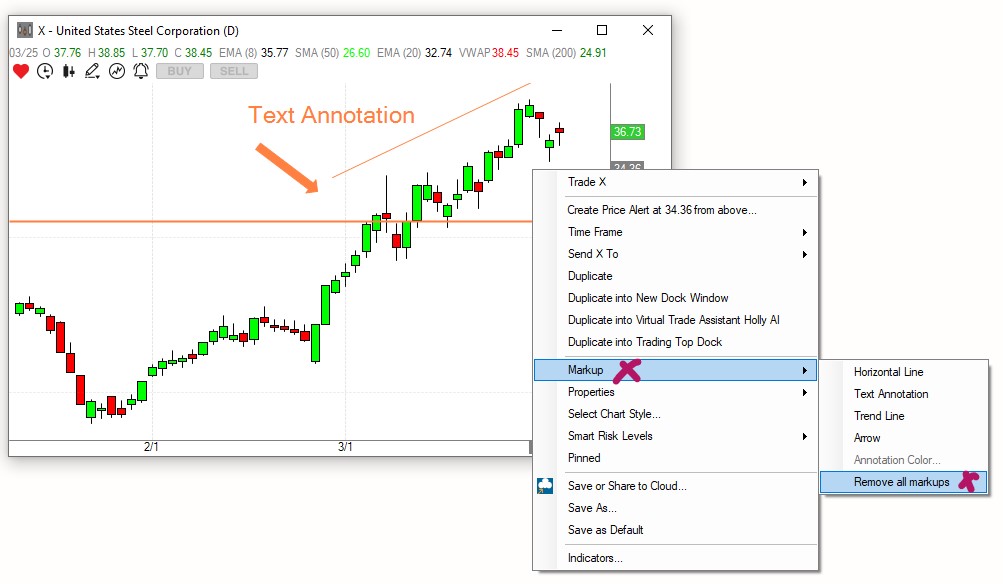
To remove an Annotation, simply select it on your Chart, then press the Delete key on your keyboard.
To remove all Annotations at once, right-click into the Chart, select Markup and then Remove all Markups.
Another way to quickly add Annotations to the Chart is to use the icons found on the top left-hand side of the Chart Window.
You will find icons for a Horizontal Line, a Trend Line, an Arrow, and Text Annotation there.
To place an Annotation on your chart, click on one of these icons, then move your mouse to the desired location on the Chart and click into the Chart to add the Annotation.
To quickly change the color of any Chart Annotation, select it on the Chart, then click the Color Changer Icon and make a color selection.