Show Bar Chart
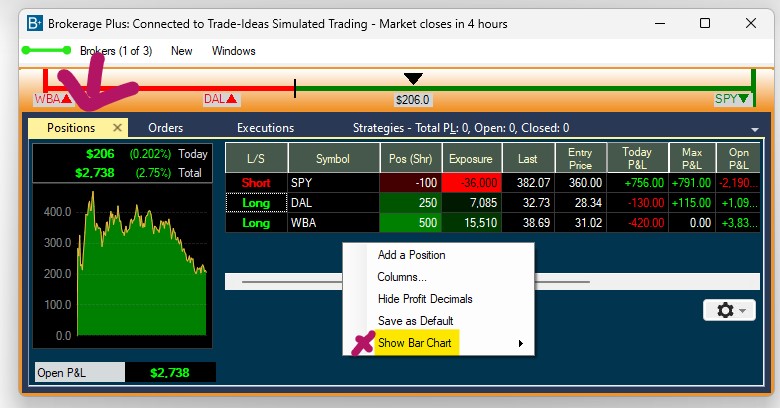
By default, the Positions Tab displays your trades in grid view.
The Show Bar Chart option enables you to display the performance of your positions in a vertical or horizontal bar chart instead.
To enable this option, right-click into the Positions Tab and place a check mark at Show Bar Chart:
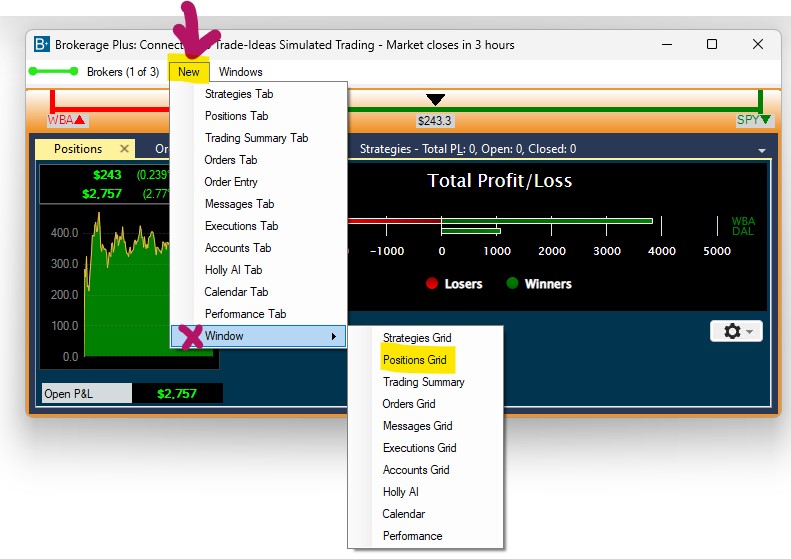
Opening the Positions Tab in a separate grid window instead of a tab, as shown in the image below, will provide the best viewing experience:
Horizontal Bars:
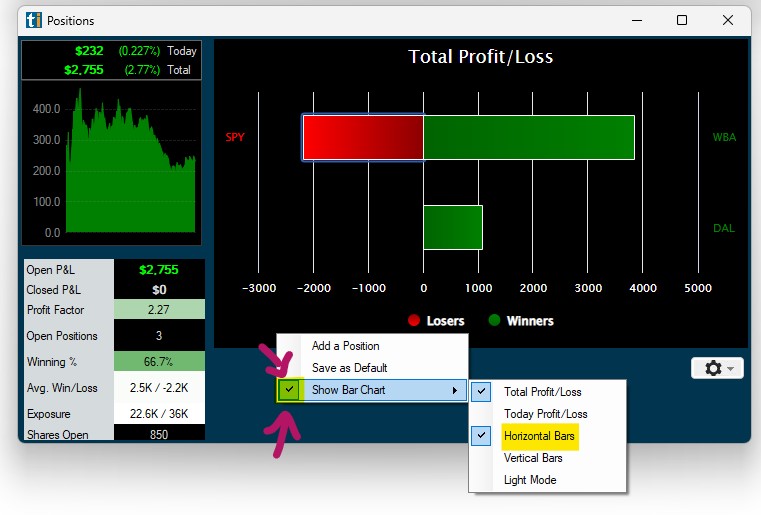
The two trades currently incurring the largest loss and the largest gain are displayed at the top.
Trades that are currently losing/negative are displayed on the left-hand side in red.
Trades that are currently winning/positive are displayed on the right-hand side in green.
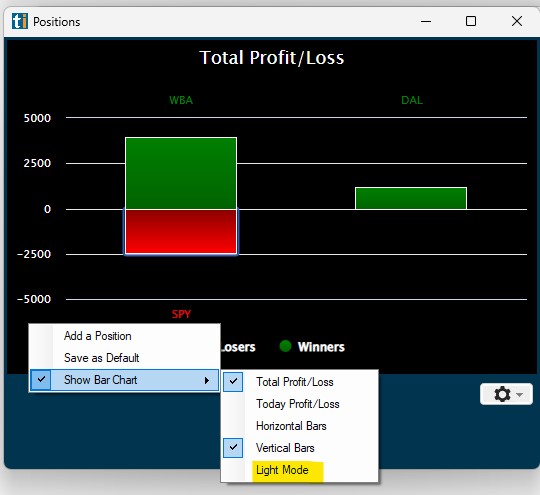
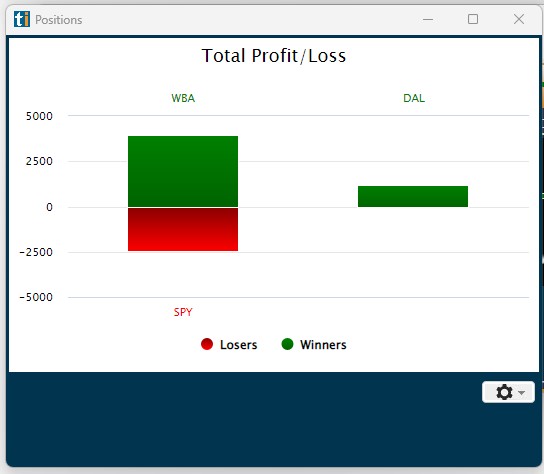
Vertical Bars:
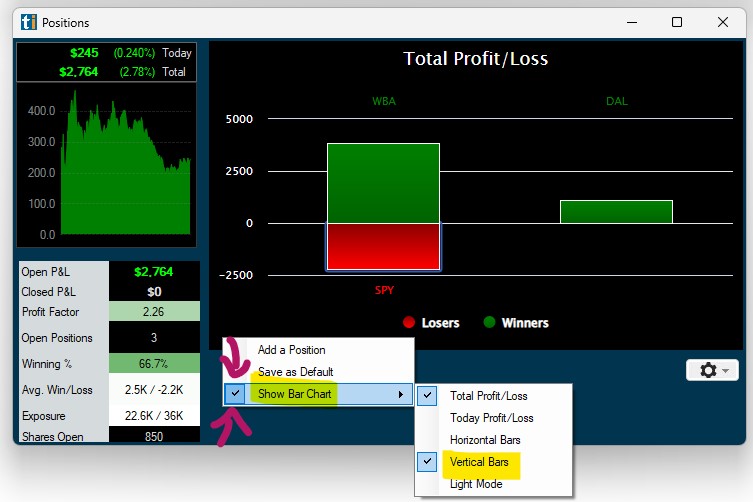
The two trades currently incurring the largest loss and the largest gain are displayed on the left-hand side.
Trades that are currently losing/negative are displayed below the zero line in red.
Trades that are currently winning/positive are displayed above the zero line in green.
Hovering over a position with your cursor will reveal the following details:
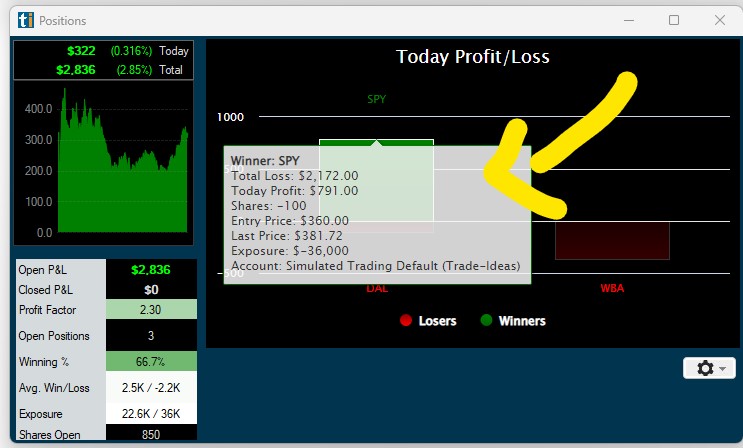
- The Total Loss/Profit
- Today's Loss/Profit
- Amount of Shares
- Entry Price
- Last Price
- The total Exposure in Dollars
- Account the shares are traded in
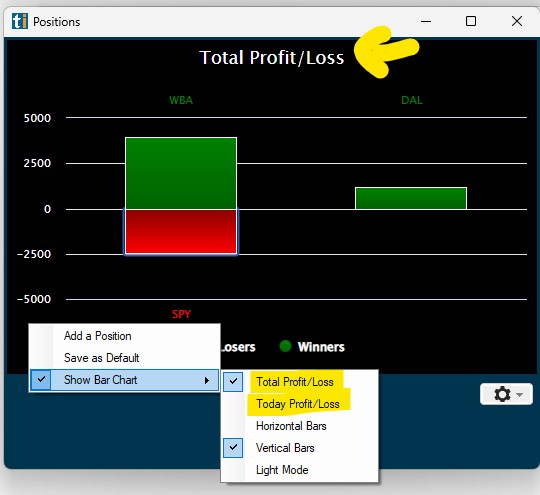
Total/Today's Profit/Loss
The right-click menu gives you the option to display the Total Profit/Loss or Today's Profit/Loss:
Dark Mode/Light Mode
The right-click menu enables you to choose between the default dark mode and a light mode: