Optimization Tab
The Optimization Tab enables you to drill down and analyze in detail which filter values are impactful. Amongst others, you can assess factors like Price intervals, Time of Day, and Symbols traded.
You can analyze the effects each filter has on the Profit Factor, the Win Rate, the Average Gain per Trade, the Total Gain, and the Number of Trades. And break each filter’s values down into intervals to see which settings perform the best.
Price, Time of Day, and Symbols have their own tabs for easy access. Any other available filter can be found in the Other Filters Tab.
The Optimization Tab enables you to break down your filter values into segments. The Price Range can be widened or shortened via the Price Interval field. The Time Period can be adjusted the same way in the Time of Day Tab via the Minute Interval Field, and the same is true for all other filters.
The Having at Least field below enables you to remove filters that only result in a few trades. Use this field to hide segments that don't have a statistically significant number of trades.
All the other filters that are part of your strategy are located in the Other Filters Tab. If you have selected Use All Available Columns in the Advanced Tab of the Oddsmaker Configuration Window, the Other Filters Tab will display all the available Trade Ideas filters in the dropdown. This gives you the ability to go through each and every filter and determine the values that have the greatest impact on your strategy.
Double-click on any of the numbered segments to bring up a list with all the associated trades.
The Graph on the right-hand side mirrors the results for Profit Factor, Win Rate, Average Gain per Trade, Total Gain, and Number of Trades and displays them visually. The numbers below the Graph are linked to the filter segments on the left-hand side. The dropdown menu above the Graph enables you to select one of the five performance criteria for visual analysis. The red line on the graphs indicates equilibrium. For the Profit Factor Graph, for example, the red line is drawn at 1 because above indicates overall profit and below indicates an overall loss.
You can use the insights the optimization tab is providing to make changes to your strategy via the Alert Configuration Window. An easy way to do this is to duplicate the current Alert Window, then make your adjustments and run the Oddsmaker again to see if and how the strategy improved. Repeat this process until your desired results are achieved.
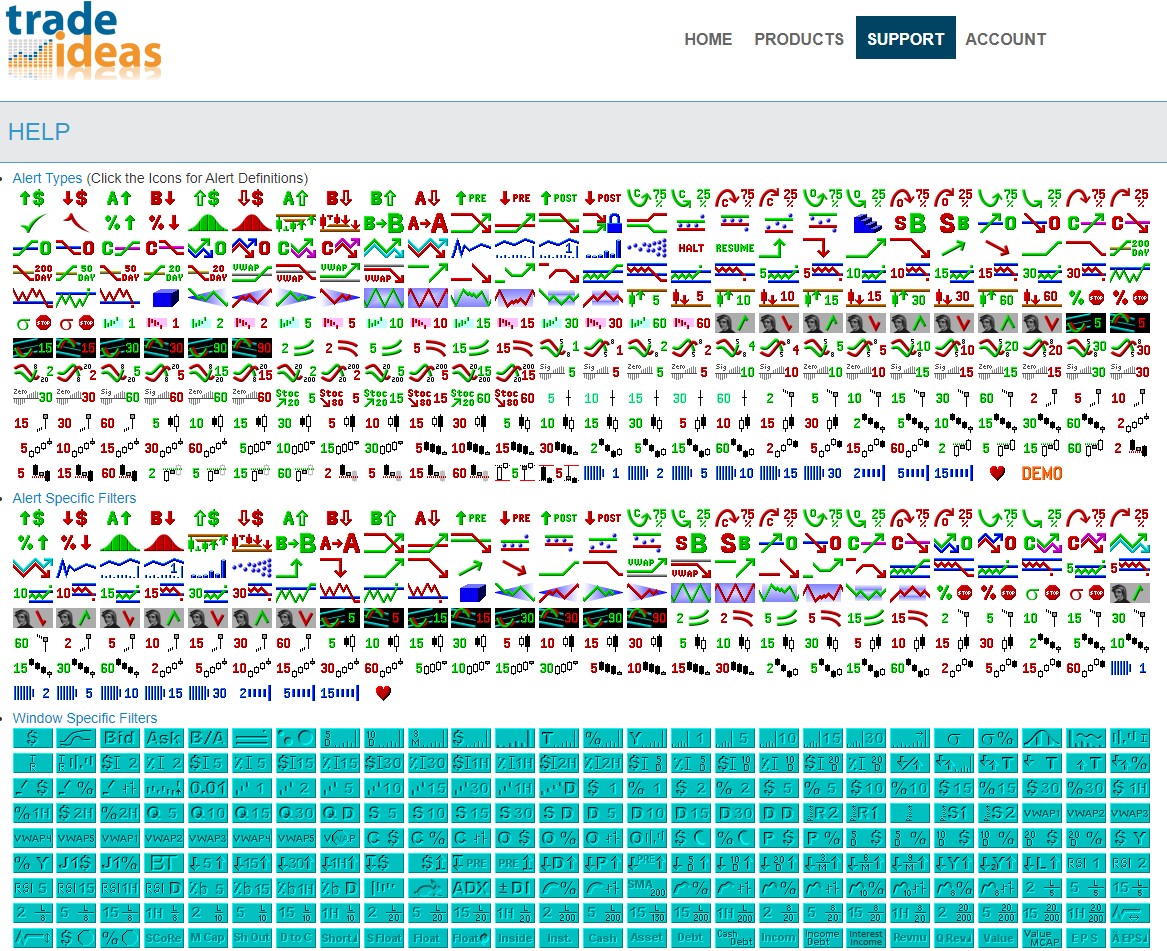
Trade Ideas Users have over 500 Alerts and Filters at their disposal to create customized scans. Visit our Alerts & Filters page for a detailed explanation of each of them.