How to use this Guide
Up-to-date Guidance
At Trade Ideas, we are committed to continuously enhancing the functionality, design, and features of our software to provide you with the best possible trading experience. Please note that while this guide is frequently updated to reflect the latest improvements, discrepancies between the documentation and the software may occasionally occur due to ongoing development.
For the most up-to-date guidance, contact our trader support team directly at support@trade-ideas.com. We appreciate your understanding and are always here to assist you in navigating any changes or updates.
Structure & Navigation
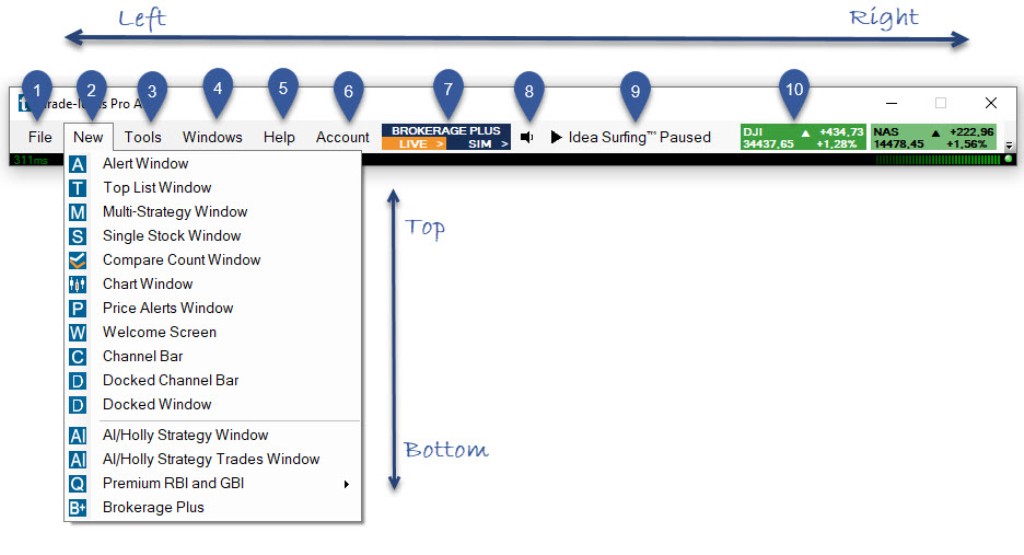
This User Guide follows a left to right and top to bottom approach in its aim to discuss each menu item of the Windows desktop version of the program.
After an introduction to Trade Ideas, users will be guided through the program setup process. Thereafter, the software's layout functionality will be highlighted.
The main focus of this User Guide will be the step-by-step presentation and explanation of all the software's feature and functions. We will start with the Toolbar, which is the core of the program and move from tab to tab (e.g. File, New, Tools, Windows, Help, Account etc.).
In an effort to address the different types of learners, most sections contain a written description, screenshots and videos.
There are several ways of using this guide:
-
To learn more about a specific feature or function, select one of the Quick Links, use the Search Function or browse through the Table of Contents.
-
To achieve an overall understanding of the software's functionality, read this User Guide from start to end.
Introduction to Trade Ideas
Established in 2003, Trade Ideas LLC caters to investors, traders, and market professionals in over 65 countries.
www.Trade-Ideas.com offers the most feature-rich stock market intelligence platform available. Our day trading software offers an array of statistical analysis and pattern recognition servers that connect directly to the exchanges and monitor every tick for every trade on the NASDAQ, AMEX, NYSE, OTC, Pink Sheets, Penny Stocks, and Canadian markets. Whether you're honing your skills in our real-time trade simulator, optimizing your strategies with the event-based Backtester, or submitting orders right from the charts, our award-winning stock trading technology enables you to find hidden profit opportunities no matter your risk tolerance or trading style.
If you’re just getting started, Trade Ideas provides the education, practice, and support you need to become a successful self-directed investor. And if you’ve been trading for years, our tools enable you to hone your skills, strategies, and confidence. The Oddsmaker will analyze your parameters and our adjustable alerts and filters, as well as custom formulas, create almost endless opportunities for refinement.
Confident Investors can enter the world of trading automation through our Brokerage Plus module which connects to participating brokers. No other market intelligence platform delivers the flexibility and customization of Trade Ideas.
Feature Overview
Have a look at these short introductory videos showcasing the main features of our Windows software:
Off to a great start in 30 Minutes!
If you are brand-new to Trade Ideas, please spend the 30 minutes it takes to watch the 10 Episodes below.
They'll equip you with all the basics you need. You'll see, you'll be a TI master in no time!
In case of any questions, simply email our support team at info@trade-ideas.com.

You’ll be surprised how fast we respond!
For hands-on help, join our daily LIVE Support!
Every trading day at 12 pm Est one of our trader educators is hosting a 1-hour Q&A session on our YouTube Channel.
To join, just visit Barrie's Trading Room on YouTube, the Live Sessions are held there during Barrie's break.
We would also like to encourage you to join Barrie's free Trading Room.
He is not only streaming on our Trade Ideas YouTube Channel, but also in a dedicated Trading Room where new and experienced traders exchange ideas in the Trader's Chat:
Now let’s get to work…
Episode 1 of 10 - Download & Installation
You’ve taken a very powerful first step towards taking control of your trading and dominating the markets. No false modesty here.
You’ve just set yourself ahead of the competition. Congrats.
This episode will guide you step-by-step through Download & Installation.
Please note: A machine reboot may be required following the installation.
Video Duration: 1min19s
For more details, head to the Download & Installation section of this User Guide or contact us at info@trade-ideas.com
Episode 2 of 10 - First Startup & Login
Once you’ve downloaded TI Pro AI, you’ll find a “TI” Icon on your desktop. Simply double-click it and Trade Ideas will launch on your desktop, prompting you to log in with your username and password.
If you run into any snags, have no worry — we’ve got your back! Check out this episode!
Video Duration: 2min49s
For more details, head to the Login and Connection sections of this User Guide or contact us at info@trade-ideas.com
Episode 3 of 10 - Toolbar & Right-Click Magic
Ok, so you’re new here. You’ve downloaded TI Pro AI and now your screen is filled with all kinds of flashing numbers and charts and alerts and lines and pictures are you’re wondering what the heck is all this stuff?
We feel you.
Just like you, we’re eager for you to learn everything you need to know. But just like anything good, patience pays.
This episode will show where to find what and how to get around. In addition to that, you'll experience some right-click magic!
Video Duration: 2min14s
For more details, head to the Toolbar and TI Elements section of our User Guide or contact us at info@trade-ideas.com
Episode 4 of 10 - Layout Styles
There’s a lot of noise in the markets. And you’ve probably already noticed a lot of bells & whistles on TI Pro. The firehose of real-time information can easily and quickly become overwhelming.
One way to overcome this sensory onslaught is to build your own custom layout that has only the specific data and tools you want to pay attention to - and nothing else.
Before you get started with your own layout, watch this episode to find out, which style suits you best.
Video Duration: 3min14s
For more details, head to the Layouts section of this User Guide or contact us at info@trade-ideas.com
Episode 5 of 10 - Creating a Free Floating Layout
97.3% of all Trade Ideas customers (totally made up number) eventually build their own custom layouts which allows them to FOCUS.
One way to build a custom layout is to start completely from scratch. A clean slate.
If you've determined that free-floating is your style, this episode will show you how to get there. If you'd like to create a docked layout, head straight to the next episode.
Video Duration: 4min10s
For more details, head to the Cloud section of our User Guide or contact us at info@trade-ideas.com
Episode 6 of 10 - Creating a Docked Layout
If you're ready to build your own docked layout, this episode will show you how to get there.
Video Duration: 3min54s
For more details, head to the Dock section of our User Guide or contact us at info@trade-ideas.com
Episode 7 of 10 - Important Intro to Scans
There are nearly 8,000 publicly traded stocks in North America. How can one possibly track them all?
Wouldn’t it be great to have a real-time watch list that only feeds you stocks that meet very specific criteria that you deem to be important to you?
You’re gonna love our Top Lists!
Traders who patiently await the right conditions to enter a trade are likely to be more successful than those who have no concept of waiting.
Problem is, how can we possibly keep up-to-the-second on every stock you want to trade that might be hitting your entry trigger?
Thankfully you don’t have to. Enter: the Trade Ideas Alert Window.
Video Duration: 3min54s
For more details, head to the Alerts & Filters Glossary and Stocks Like This section of our User Guide or contact us at info@trade-ideas.com
Episode 8 of 10 - Building a Top List Window (Scan)
Ok, so you’ve seen the power of Top Lists in action on a variety of Channels. Now you’d like to harness this power to your own unique ideas.
Yes! Now you get it!
Watch this episode to find out how to build your very own Top List Window!
Video Duration: 5min04s
For more details, head to the Top List Window section of our User Guide or contact us at info@trade-ideas.com
Episode 9 of 10 - Building an Alert Window (Scan)
Good news! You’ve already built your first Top List in Episode 8, which means you can easily figure out how to build an Alert Window.
The same mechanics apply, only there’s one very significant additional step early in the process -- you need to add an Alert which triggers a notification!
ProTip: in the config window, Alerts will show one icon next to the name of the alert, while filters will show two icons (one aqua, one purple) next to the name of the filter.
Video Duration: 5min41s
For more details, head to the Alert Window and Multi-Strategy Window section of our User Guide or contact us at info@trade-ideas.com
Episode 10 of 10 - Intro to Charts
By now you've probably already come across charts in TI Pro. There are charts on nearly every channel in the Channel Bar.
Need additional charts? Want to explore some additional time frames? Want to have a static chart set to only show you a certain stock or ETF? All of this and more is available.
Watch this episode to get a good idea of what our charts can do for you!
Video Duration: 3min13s
For more details, head to the Chart section of our User Guide or contact us at info@trade-ideas.com

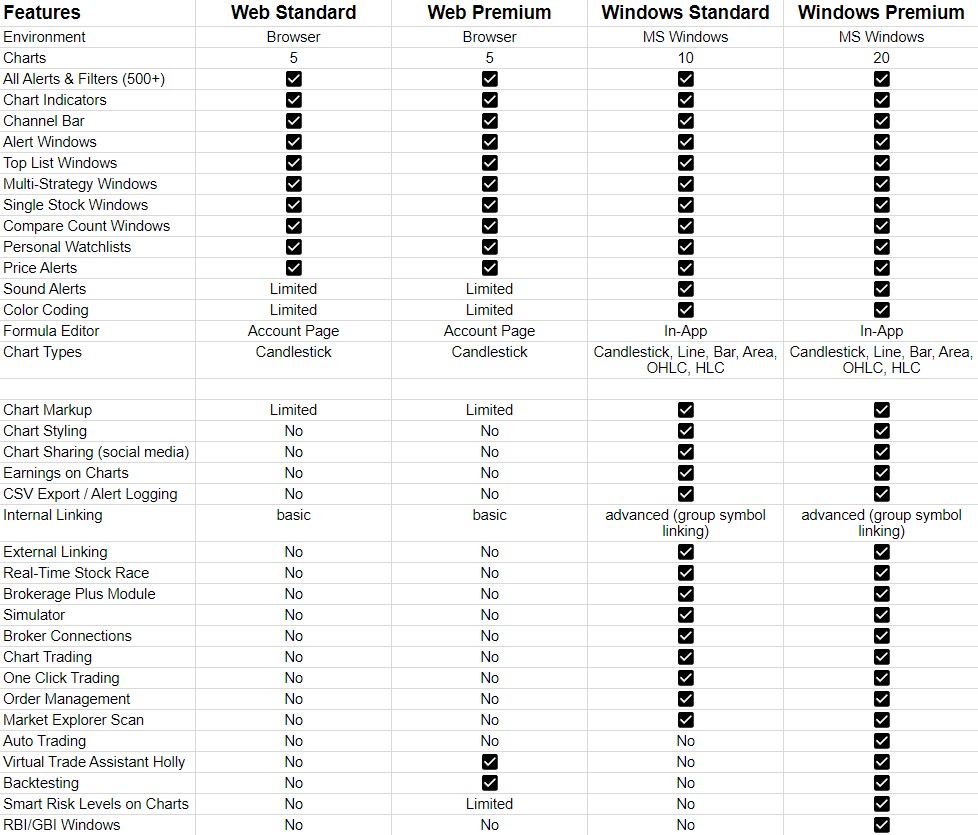
Version Comparison
Trade Ideas standalone MS Windows application is available in a Standard and Premium version. It is specifically designed for the power user who demands more than a web-based front end can offer.
For Mac users and Traders on the go, we provide a slimmer, pared-down Web Application that can be accessed here after Account creation.
Download & Installation
Account Creation
The use of the software requires an active Trade Ideas Account. To create an Account:
-
Head to our Signup page or to our Accounts page
-
Select Create a Subscription
-
Select your preferred subscription plan
-
Add your account details
-
Add your billing address and details
-
Create a username and password
-
Proceed to Checkout
Exchange Agreements
Trade Ideas servers access a lot of data from a variety of sources including the NYSE and NASDAQ exchanges. These exchanges require us to keep updated records and file accurate annual reports of subscriber information. Trade Ideas is required to verify whether each subscriber is a professional or non-professional trader.
Trade Ideas pays the exchange fees for non-professional subscribers.
Professional traders are required to pay additional fees to NYSE, AMEX, and NASDAQ.
Do you trade other people’s money or carry special licenses? If not, then you are probably not considered professional.
Here is a link to more information about professional trader status.
For assistance, email info@trade-ideas.com
System Requirements
Minimum:
-
Windows 10/Windows 11
-
32-bit system bus
-
1.5 GHZ CPU (dual or quad core)
-
4 Gigs of RAM
Preferred:
-
Windows 10/Windows 11
-
64-bit system bus
-
2.0 GHZ CPU (dual or quad core)
-
8 Gigs of RAM
Ideal:
-
Windows 10/Windows 11
-
64-bit system bus
-
2.5 GHZ CPU (dual or quad core)
-
16 Gigs of RAM
Trade Ideas for Mac Users
Our full-featured downloadable software is only compatible with Windows.
Mac users need to install additional software like Bootcamp, Fusion, or Parallels or alternatively run Trade Ideas via AWS or Windows 365.
As a Mac user or as a user of other mobile devices you can alternatively use our "slimmer" Web Version.
At this point, the Web Version doesn't support the Brokerage Plus Module or External Linking. Other differences are that users can only load 5 charts at a time and although sound alerts are working, there are no voice alerts. All our Alerts and Filters to create custom scans are however available in the web version.
To learn more about our Web version, head here
To access the Web Version, head here
Download
To download the Trade Ideas software to your Windows PC, click the Download button or head to our Website.
You will have the choice of installing either the current production version of Trade Ideas or our newest beta.
Our beta version gives you access to all our brand-new features, it is the most up-to-date. The beta version is a candidate for replacing the current production version with new features and/or fixes.
Our production version is more time-tested.
Release notes for both production and beta version are listed on the Downloads Page .
Installation
-
To initiate the installation, locate the downloaded file on your computer, right-click and select Run as Administrator
-
Select your preferred language.
-
Accept the License Agreement
-
Choose an installation folder on your PC.
-
Finish the installation
A TI Icon will be placed on your desktop for future launching of the Trade Ideas software. For the proper functioning of the program, it is essential to launch it from the Desktop Icon. Please do not start the software from the Taskbar or a custom shortcut.
First Startup
The use of the software requires an Active Account.
On first startup of the program, the Toolbar will open and you will be prompted to log in with your Username and Password.
Please note, our system is case-sensitive, your credentials have to be entered in their exact case.
If you have forgotten your username, contact our helpful support team at info@trade-ideas.com.
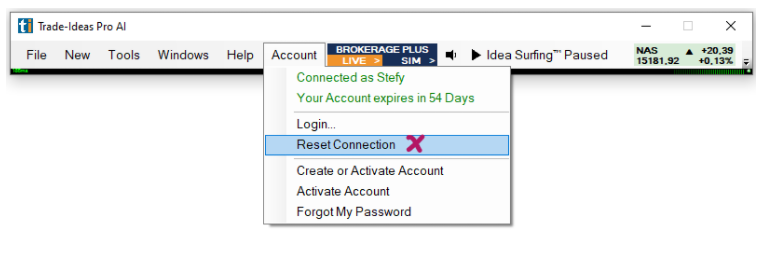
To reset or change your password, select Account from the Toolbar Menu and choose Forgot my Password or head to your Account Management page on our website.
Our over 40 preconfigured Channels are the ideal starting point for new Trade Ideas users.
-
Go to the Toolbar
-
Select New
-
Select Channel Bar or Docked Channel Bar
-
Browse through the different options and select a channel that suits your trading style or interest.
-
Once selected, a set of Charts, Top Lists, and Alert Windows will populate.
Software Layout
Trade Ideas offers two different layout options, one being free-floating layout items and the other being docked layout items. These layout options are not exclusive, they can be combined.
Free-floating layout items offer the greatest flexibility. They have the advantage of being easily combined with external charting and brokerage applications. You can arrange everything on your screen exactly the way you like it.
Docked layout items, on the other hand, make switching between layouts and browsing through different channels very smooth. All layout items are contained in a Dock, which makes moving entire layouts from one area of your screen to another very easy. Docks with their Top Tabs and slide-out Pins, help people with limited screen space to "pack in more". In addition to that, the docked layout functionality is more akin to other Windows programs and its use might therefore feel more familiar to new users of the software.
You can choose if you would like new layout items to always open in a Dock or free-floating.
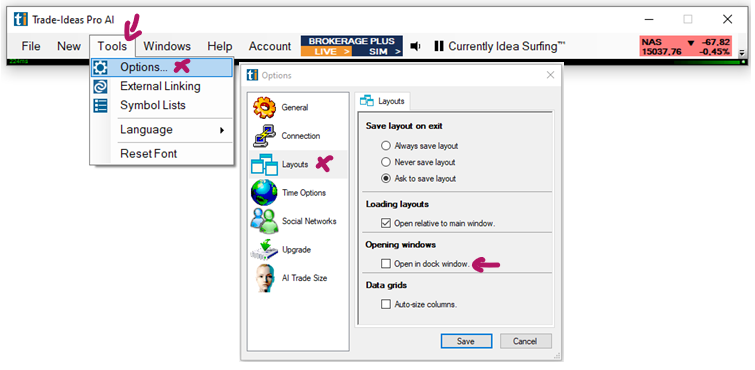
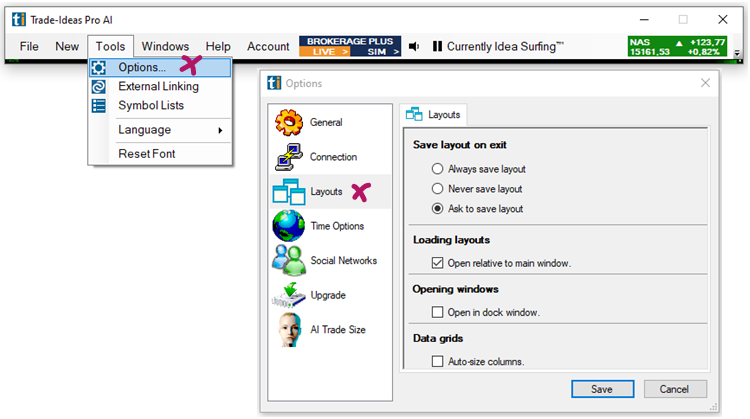
To do so, go to the Toolbar, open the Tools Tab, select Options, and then Layouts.
If you would like all newly opened windows to automatically open in a Dock, check the option Open in Dock window.
If you leave this option unchecked, you will still have the ability to manually create Docks.
Free Floating Layout
For greatest flexibility and usability, all layout items are freely movable and resizable, enabling you to create your preferred layout using multiple screens.
The main components of our software are:
-
The Toolbar: Provides access to most functions of the program
-
The Channel Bar: Plenty of channels with preconfigured, but customizable scans covering a wide variety of trading styles and opportunities
-
Alert Windows: Trigger in real-time when a specified event occurs
-
Top List Windows: Present a list of all stocks that meet specified criteria, update every few seconds
-
Multi-Strategy Windows: Combine multiple Alert Windows into one space-saving window
-
Charts: Can display various time frames and indicators. Update every few seconds
Docked Layout
If you would like all newly opened windows to automatically open in a Dock, go to the Toolbar, open the Tools Tab, select Options, and then Layouts. Here, check the option Open in Dock window.
If you leave this option unchecked, you will still have the ability to manually create Docks.
If a Dock has already been opened, all newly added windows will load into the same Dock.
The newly opened windows will initially be stacked as Tabs inside the Dock.
The layout of the Dock can be changed the following way:
Grab the left-hand side corner of a tabbed window with your mouse and drag it towards the center of the Dock.
This will bring up the placement tool.
The placement tool provides 6 placement options. Top, bottom, left, right as well as tabbed on the top and tabbed to the left.
To place a layout item at the top, drag it towards the center of the Dock and let it go, once the top part above the placement tool turns blue.
Every window inside a Dock is a mini Dock all on its own and has its own placement tool.
-
To place a layout item at the bottom, drag it towards the center of the Dock and let it go, once the bottom part below the placement tool turns blue.
-
To place a layout item on the left-hand side, drag it towards the center of the Dock and let go, once the left-hand side of the placement tool turns blue.
-
To place a layout item on the right-hand side, drag it towards the center of the Dock and let it go, once the right-hand side of the placement tool turns blue.
-
To turn a layout item into a Top Tab, drag it towards the center of the Dock and let it go, once the entire area around the placement tool turns blue.
If a dock or mini dock contains many Top Tabs, they can be viewed and opened by clicking the small downward pointing arrow on the top right-hand side of the window.
To turn a layout item into a slide-out Pin, drag it towards the small separate placement tool on the left-hand side of the Dock and let go, once the area around the small separate placement tool on the left-hand side turns blue. To enable the auto-hide function, click on the small pin icon on the top right-hand side of the window. When auto-hide is enabled, these windows will only slide out, when clicked on.
Please note, you can load any Trade Ideas Window, except the Channel Bar into an already opened Dock. To create a Docked Channel Bar, go to the Toolbar, open the New Tab, and select Docked Channel Bar. Thereafter, you can add any other windows to your Docked Channel Bar following the process outlined above.
To open a blank Dock, go to the Toolbar, open the New Tab, and select Docked Window. Give your new Dock a Name and press OK.
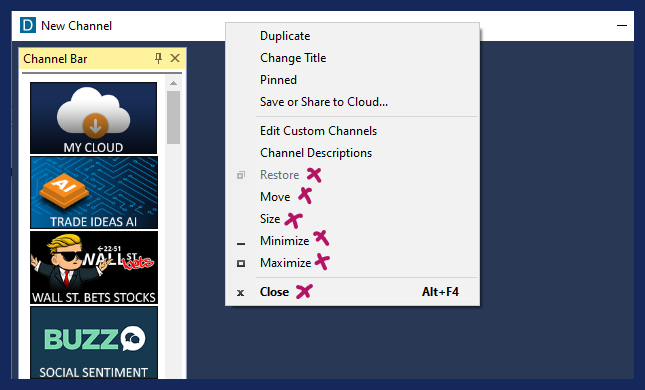
Channel Bar
Our Channel Bar contains over 40 Channels with preconfigured, but customizable scans covering a wide variety of trading styles and opportunities. They are the ideal starting point for new Trade Ideas users. We have a channel for momentum traders, one that looks for short squeezes, a premarket and after-hours channel, as well as one that focuses on gaps. There are also channels that look at fundamentals, at different sectors like China, Energy, Metals, or that focus on unusual options activity or volume, just to name a few.
Each Channel is made up of Alerts, Top List, and Multi-Strategy Windows as well as Charts enabling you to get started with trading right away.
After the first startup of the program, go to the Toolbar, open the New Tab and select Channel Bar for the free-floating version or Docked Channel Bar.
Browse through the different options and select a channel that suits your trading style or interest. Once selected, a set of Charts, Top List, and Alert Windows will populate. For an overview of the different channels have a look at the Channel Bar Description on our website.
Please note that the Channel layouts are fixed and will always populate the same way again after a restart. If you have rearranged a Channel layout and would like to keep using it this way, you need to save it to your Trade Ideas Cloud (Toolbar > File > Save or Share to Cloud before exiting the program. To open your saved custom layout, go to the Toolbar, open the File Tab and select Load from Cloud.
Another way of accessing up to five custom layouts is to create Custom Channels in the Channel Bar.
Free-Floating Channel Bar
Docked Channel Bar
Free-Floating Channel Bar
When using a free-floating Channel Bar, all Channel Layouts will open as free-floating as well. Switching Channels closes one channel layout and opens a new one. You can only open one free-floating Channel Layout at a time, whereas you can have multiple docked Channel Bars with different channels on your screen.
Custom Channel
If you have created your own layouts, you can access them by going to the Toolbar, opening the File Tab, and choosing Load from Cloud. In addition to that, you can access your default layout by going to the Toolbar, opening the File Tab, and selecting Load Layout.
Another way of accessing up to five custom layouts is to create Custom Channels in the Channel Bar.
To do so, click the Gear Icon on the left-hand side next to the Channel Bar Header and select Edit Custom Channels. Click Add Channel on the bottom left-hand side to open the Custom Channel Editor. Select an image for your new Channel from the left-hand side or upload an image from your PC by selecting Upload Image File. The chosen image will appear in the field in the center. Use the dotted cropping rectangle to select the image area that will be visible in the Channel Bar. Once selected, click Crop Image below the Image field. On the right-hand side, you will be presented with a Preview of the new Channel Image. An active Channel shows the word On displayed in the center of the image. Enter a name for your new Custom Channel below the preview on the right-hand side.
Finally, click Select from Cloud to load your layout into the new Custom Channel. Use the Search field to find your layout or scroll through the list of layout items. Highlight the layout you would like to use for your Custom Channel, then press Select on the bottom left-hand side. This will add the Cloud Link to your layout to the new Custom Channel. Hit OK when you are done. Your new Channel will now be listed in the Custom Channel List. Hit Apply to add it to the Channel Bar or Add Channel to create another Custom Channel. You can add up to five custom channels.
Your custom channels will be displayed above the main Channels of the Channel Bar. If you click on it, it will load your own layout.
To edit, remove or reorder your Custom Channels, click the Gear Icon next to the Channel Bar Header. Then select Edit Custom Channels. This will open the Custom Channel List. To reorder your Custom Channels, highlight one, then use the up and down arrows at the bottom. To delete a Custom Channel, highlight it and select Delete Channel at the bottom. To edit a Custom Channel, highlight it and select Edit Channel at the bottom, which will open the Custom Channel Editor, where you can make your desired changes.
Docked Channel Bar
To load a Docked Channel Bar, go to the Toolbar, open the New Tab and select Docked Channel Bar. Thereafter, you can add any other windows to your Docked Channel Bar following the process outlined below:
If you would like all newly opened windows to automatically open in a Dock, go to the Toolbar, open the Tools Tab, select Options, and then Layouts. Here, check the option Open in Dock window. If you leave this option unchecked, you will still have the ability to manually create Docks.
Once the option Open in Dock window is enabled, every window you open from the New Tab of the Toolbar will automatically open in a Dock.
If a Dock has already been opened, all newly added windows will load into the same Dock.
The newly opened windows will initially be stacked as Tabs inside the Dock.
The layout of the Dock can be changed the following way:
Grab the left-hand side corner of a tabbed window with your mouse and drag it towards the center of the Dock.
This will bring up the placement tool.
The placement tool provides 6 placement options. Top, bottom, left, right as well as tabbed on the top and tabbed to the left.
To place a layout item at the top, drag it towards the center of the Dock and let it go, once the top part above the placement tool turns blue.
Every window inside a Dock is a mini Dock all on its own and has its own placement tool.
-
To place a layout item at the bottom, drag it towards the center of the Dock and let it go, once the bottom part below the placement tool turns blue.
-
To place a layout item on the left-hand side, drag it towards the center of the Dock and let go, once the left-hand side of the placement tool turns blue.
-
To place a layout item on the right-hand side, drag it towards the center of the Dock and let it go, once the right-hand side of the placement tool turns blue.
-
To turn a layout item into a Top Tab, drag it towards the center of the Dock and let it go, once the entire area around the placement tool turns blue.
If a dock or mini dock contains many Top Tabs, they can be viewed and opened by clicking the small downward pointing arrow on the top right-hand side of the window.
To turn a layout item into a slide-out Pin, drag it towards the small separate placement tool on the left-hand side of the Dock and let go, once the area around the small separate placement tool on the left-hand side turns blue. To enable the auto-hide function, click on the small pin icon on the top right-hand side of the window. When auto-hide is enabled, these windows will only slide out, when clicked on.
You can resize the Dock, and mini docks inside the dock, any way you like. By grabbing their borders and dragging them.
To give a Dock a name, right-click into its header and select Change Title. Enter a new name in the Dock Window Title field, then press OK.
Duplicate
The right-click Menu provides access to the following functions of the Docked Channel Bar and Docks.
To duplicate a Docked Channel Bar or Docked Window, right-click into its header and select Duplicate. You will now have an exact copy of your Docked Channel Bar.
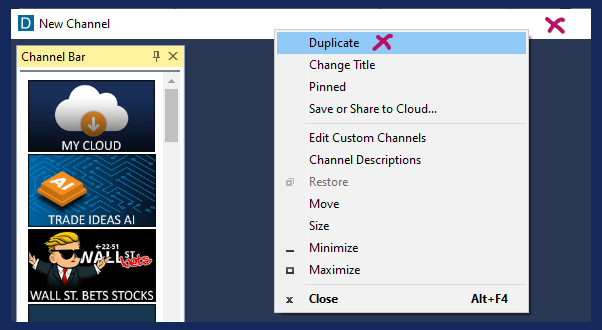
How to duplicate a Dock:
Change Title
To give your Docked Channel Bar or Docked Window a unique name, right-click into its header and select Change Title. Enter a new name in the Dock Window Title field, then press OK.
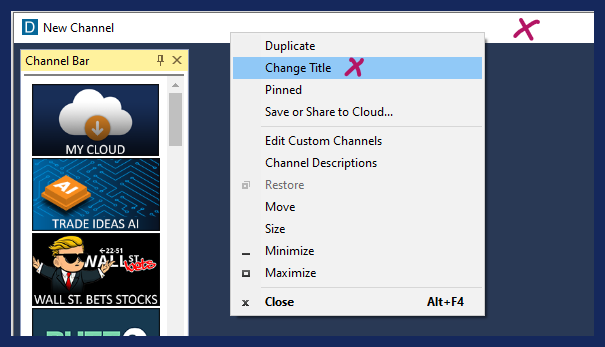
How to change a Dock Title:
Pinned
To keep a Dock on your screen permanently, even when loading a different layout or layout item that has the function Clear Previous Layout enabled, right-click into the header of the Dock and select Pinned from the dropdown.
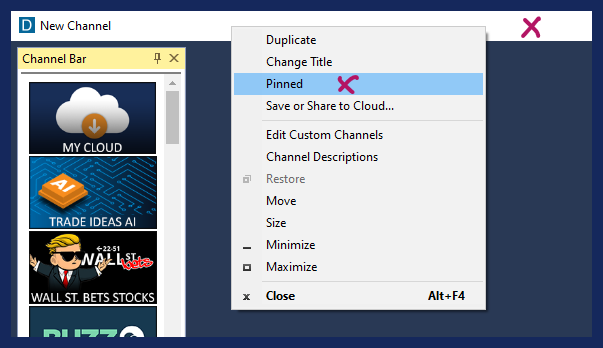
It is important to note that this Dock will stay open until you decide to unpin it.
When accidentally saved within a layout, It might load multiple times, when closing and re-opening this layout. At worst, you will have multiple versions of the Dock all running on top of each other in the same position. This can put a strain on system resources and drastically impact software performance. The pinning option should therefore be used very carefully and consciously.
A Dock should always be unpinned after the desired action is completed.
To do this, right-click into the Dock Header and remove the checkmark on Pinned.
To see all pinned and unpinned layout items, or to close them, go to the Toolbar, select Windows, and choose, Close All Unpinned, or Close All Pinned.
How to pin a Dock:
Save or Share to Cloud
Once you have created a Dock or have changed its settings, make sure to save it to the cloud for future use.
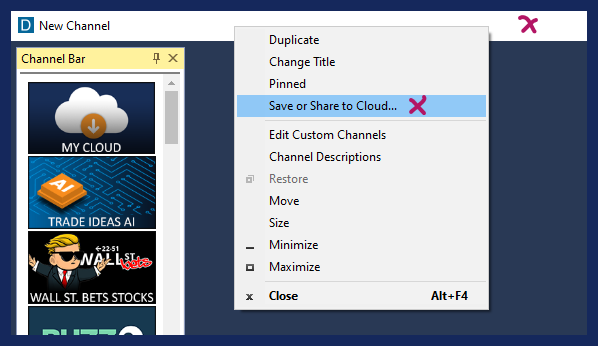
1. Right-click into the Dock Header and select Save or Share to Cloud
2. Enter a new name into the Name field or keep the automatically added one.
3. Enter a description for your new Dock or leave the Description field blank.
4. If you would like to automatically close any other open layout or Dock in the future, whenever you load this Dock, select Clear Previous Layout.
If you would like to load this Dock on top of any already opened layouts or layout items, leave this checkbox blank.
5. Select Save when you are done or select Save and Share to share the Dock with others before saving it to the cloud.
6. There are various sharing options:
-
Scan the QR code
-
Select Copy All, to save the Cloud link to your clipboard and paste it into an email or messaging app.
-
Click the Twitter icon and include a text message if you like. If you haven't connected Trade Ideas to Twitter yet, a Twitter Authorization Form will open. Log in with your Twitter username and password. Then click, Authorize App. Thereafter, copy the displayed Pin Code into the field at the bottom left-hand side of the window and select Confirm.
7. Select OK when you are done.
Your new Dock is now stored in your cloud, from where it can easily be retrieved. Just go to the Toolbar, open the File Tab and choose Load from Cloud. To find a saved Dock, you can enter its name in the Search Field, or scroll through the list. Just highlight your Dock, then choose Load.
How to Save or Share a Dock to the Cloud:
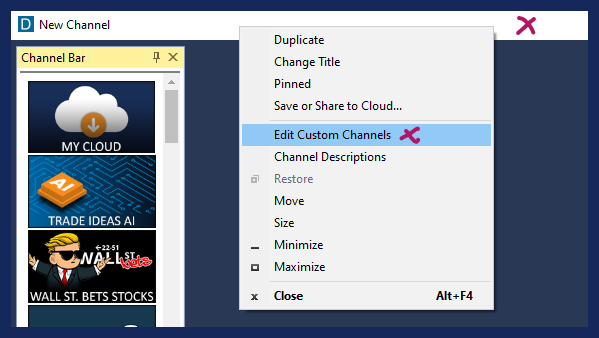
Custom Channel
If you have created your own layouts, you can access them by going to the Toolbar, opening the File Tab, and choosing Load from Cloud. In addition to that, you can access your default layout by going to the Toolbar, opening the File Tab, and selecting Load Layout.
Another way of accessing up to five custom layouts is to create Custom Channels in the Channel Bar or Docked Channel Bar.
To do so in the Docked Channel Bar, right-click into the Docked Channel Bar Header and select Edit Custom Channels.
Click Add Channel on the bottom left-hand side to open the Custom Channel Editor. Select an image for your new Channel from the left-hand side or upload an image from your PC by selecting Upload Image File. The chosen image will appear in the field in the center. Use the dotted cropping rectangle to select the image area that will be visible in the Channel Bar. Once selected, click Crop Image below the Image field. On the right-hand side, you will be presented with a Preview of the new Channel Image. An active Channel shows the word On displayed in the center of the image. Enter a name for your new Custom Channel below the preview on the right-hand side.
Finally, click Select from Cloud to load your layout into the new Custom Channel. Use the Search field to find your layout or scroll through the list of layout items. Highlight the layout you would like to use for your Custom Channel, then press Select on the bottom left-hand side. This will add the Cloud Link to your layout to the new Custom Channel. Hit OK when you are done. Your new Channel will now be listed in the Custom Channel List. Hit Apply to add it to the Channel Bar or Add Channel to create another Custom Channel. You can add up to five custom channels.
Your custom channels will be displayed above the main Channels of the Channel Bar. If you click on it, it will load your own layout.
Please note, if your layout does not include a Docked Channel Bar, the Channel Bar will disappear once you click on your Custom Channel Image and open this Custom Channel without a Channel Bar.
To edit, remove or reorder your Custom Channels, right-click into the Docked Channel Bar Header and select Edit Custom Channels. This will open the Custom Channel List. To reorder your Custom Channels, highlight one, then use the up and down arrows at the bottom. To delete a Custom Channel, highlight it and select Delete Channel at the bottom. To edit a Custom Channel, highlight it and select Edit Channel at the bottom, which will open the Custom Channel Editor, where you can make your desired changes.
How to add a Custom Channel:
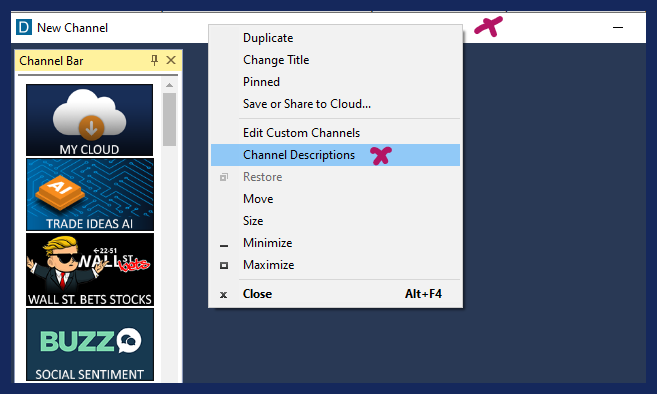
Channel Descriptions
To get an overview of the different Channels, right-click into the Docked Channel Bar Header and select Channel Descriptions. This will bring you to the Channel Bar Description on our website.
Minimize, Maximize, Restore, Close
To minimize a Docked Channel Bar, right-click into its header and select Minimize. Alternatively, you can minimize it by clicking the minus icon on the top right-hand side of the header. The Docked Channel Bar will now be hidden in the Taskbar. To bring a minimized Docked Channel Bar back, hover over the Trade Ideas Taskbar Icon, then click on the Docked Channel Bar thumbnail.
To maximize a Docked Channel Bar, right-click into its header and select Maximize. Alternatively, you can maximize it by clicking the maximize icon on the top right-hand side of the header. The Docked Channel Bar will now fill your entire screen.
To reduce the size of a maximized Docked Channel Bar, click on the restore icon on the top right-hand side of the header or right-click into its header and select Restore.
To close a Docked Channel Bar, right-click into its header and select Close. Alternatively, you can close it by clicking the x icon on the top right-hand side of the header.
Docked Window
To open a blank Dock, go to the Toolbar, open the New Tab and select Docked Window. Give your new Dock a Name and press OK.
Thereafter, you can add any other windows to your Docked Window following the process outlined below:
If you would like all newly opened windows to automatically open in a Dock, go to the Toolbar, open the Tools Tab, select Options and then Layouts. Here, check the option Open in Dock window.
If you leave this option unchecked, you will still have the ability to manually create Docks.
Once the option Open in Dock window is enabled, every window you open from the New Tab of the Toolbar will automatically open in a Dock.
If a Dock has already been opened, all newly added windows will load into the same Dock.
The newly opened windows will initially be stacked as Tabs inside the Dock.
The layout of the Dock can be changed the following way:
Grab the left-hand side corner of a tabbed window with your mouse and drag it towards the center of the Dock.
This will bring up the placement tool. The placement tool provides 6 placement options. Top, bottom, left, right as well as tabbed on the top and tabbed to the left.
To place a layout item at the top, drag it towards the center of the Dock and let it go, once the top part above the placement tool turns blue.
Every window inside a Dock is a mini Dock all on its own and has its own placement tool.
-
To place a layout item at the bottom, drag it towards the center of the Dock and let it go, once the bottom part below the placement tool turns blue.
-
To place a layout item on the left-hand side, drag it towards the center of the Dock and let go, once the left-hand side of the placement tool turns blue.
-
To place a layout item on the right-hand side, drag it towards the center of the Dock and let it go, once the right-hand side of the placement tool turns blue.
-
To turn a layout item into a Top Tab, drag it towards the center of the Dock and let it go, once the entire area around the placement tool turns blue.
If a dock or mini dock contains many Top Tabs, they can be viewed and opened by clicking the small downward pointing arrow on the top right-hand side of the window.
To turn a layout item into a slide-out Pin, drag it towards the small separate placement tool on the left-hand side of the Dock and let go, once the area around the small separate placement tool on the left-hand side turns blue. To enable the auto-hide function, click on the small pin icon on the top right-hand side of the window. When auto-hide is enabled, these windows will only slide out, when clicked on.
You can resize the Dock, and mini docks inside the dock, any way you like. By grabbing their borders and dragging them.
To give a Dock a name, right-click into its header and select Change Title. Enter a new name in the Dock Window Title field, then press OK.
Duplicate
To duplicate a Dock, right-click into its header and select Duplicate. You will now have an exact copy of your Dock.
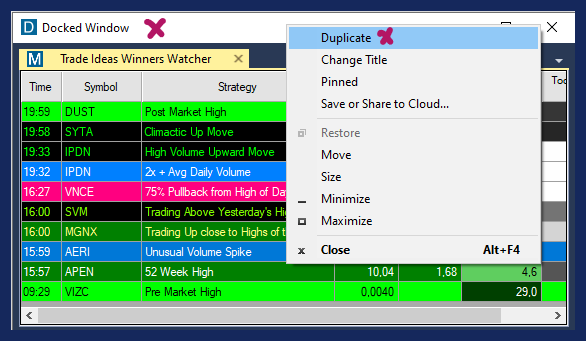
How to duplicate a Docked Window:
Change Title
To give your Docked Window a unique name, right-click into its header and select Change Title. Enter a new name in the Dock Window Title field, then press OK.
How to change a Docked Window Title:
Pinned
To keep a Dock on your screen permanently, even when loading a different layout or layout item that has the function Clear Previous Layout enabled, right-click into the header of the Dock and select Pinned from the dropdown.
It is important to note that this Dock will stay open until you decide to unpin it. When accidentally saved within a layout, It might load multiple times, when closing and re-opening this layout. At worst, you will have multiple versions of the Dock all running on top of each other in the same position. This can put a strain on system resources and drastically impact software performance. The pinning option should therefore be used very carefully and consciously. A Dock should always be unpinned after the desired action is completed.
To do this, right-click into the Dock Header and remove the checkmark on Pinned.
To see all pinned and unpinned layout items, or to close them, go to the Toolbar, select Windows, and choose, Close All Unpinned, or Close All Pinned.
Save or Share to Cloud
Once you have created a Dock or have changed its settings, make sure to save it to the cloud for future use.
1. Right-click into the Dock Header and select Save or Share to Cloud
2. Enter a new name into the Name field or keep the automatically added one.
3. Enter a description for your new Dock or leave the Description field blank.
4. If you would like to automatically close any other open layout or Dock in the future, whenever you load this Dock, select Clear Previous Layout.
If you would like to load this Dock on top of any already opened layouts or layout items, leave this checkbox blank.
5. Select Save when you are done or select Save and Share to share the Dock with others before saving it to the cloud.
6. There are various sharing options:
-
Scan the QR code
-
Select Copy All, to save the Cloud link to your clipboard and paste it into an email or messaging app.
-
Click the Twitter icon and include a text message if you like. If you haven't connected Trade Ideas to Twitter yet, a Twitter Authorization Form will open. Log in with your Twitter username and password. Then click, Authorize App. Thereafter, copy the displayed Pin Code into the field at the bottom left-hand side of the window and select Confirm.
7. Select OK when you are done.
Your new Dock is now stored in your cloud, from where it can easily be retrieved. Just go to the Toolbar, open the File Tab and choose Load from Cloud. To find a saved Dock, you can enter its name in the search field, or scroll through the list. Just highlight your Dock, then choose Load.
Minimize, Maximize, Restore, Close
To minimize a Docked Window, right-click into its header and select Minimize. Alternatively, you can minimize it by clicking the minus icon on the top right-hand side of the header. The Dock will now be hidden in the Taskbar. To bring a minimized Docked Channel Bar back, hover over the Trade Ideas Taskbar Icon, then click on the Dock thumbnail.
To maximize a Dock, right-click into its header and select Maximize. Alternatively, you can maximize it by clicking the maximize icon on the top right-hand side of the header. The Docked Window will now fill your entire screen.
To reduce the size of a maximized Docked Window, click on the restore icon on the top right-hand side of the header or right-click into its header and select Restore.
To close a Dock, right-click into its header and select Close. Alternatively, you can close it by clicking the x icon on the top right-hand side of the header.
Duplicate Function Docked vs Free-Floating Windows
In addition to the main right-click menu options, Docked Windows have the following 3 additional options:
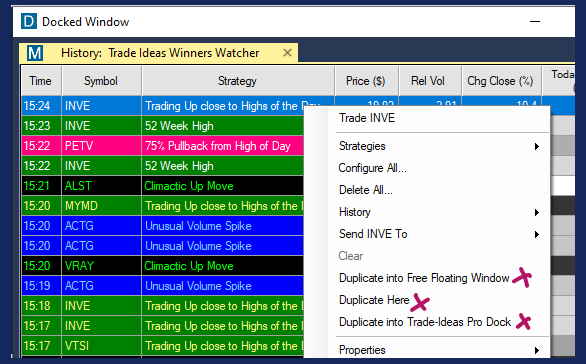
1. Duplicate into free-floating Window
To open a copy of your docked window as a free-floating window, right-click into the docked window and select Duplicate into free-floating Window. An exact copy of your docked window will now be opened as a free-floating window.
2. Duplicate Here
To create a copy of your docked window inside the Dock, right-click into the docked window and select Duplicate Here. An exact copy of your docked window will now be opened inside your Dock.
3. Duplicate into XYZ Dock
To load a copy of your docked window inside another Dock, right-click into the docked window and select Duplicate into XYZ Dock. An exact copy of your docked window will now be opened inside Dock XYZ.
In addition to the other right-click menu options, Free-floating Windows have the following 2 additional options:
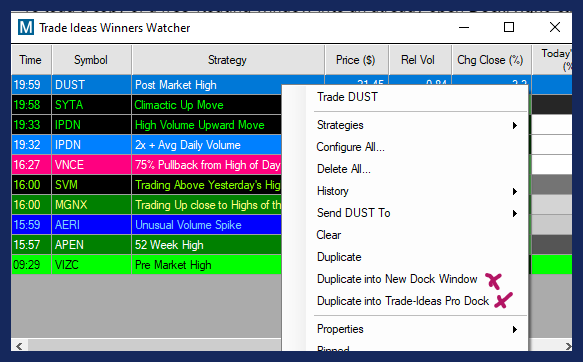
1. Duplicate into New Dock Window
To open a copy of a free-floating window in a new Dock, right-click into the free-floating window and select Duplicate into New Dock Window. An exact copy of your free-floating window will now be opened in a new Dock.
2. Duplicate into XYZ Dock
To load a copy of a free-floating window into an already open Dock, right-click into the free-floating window and select Duplicate into XYZ Dock, where XYZ stands for the Name of that particular Dock. An exact copy of your free-floating window will now be added to the chosen Dock.
Toolbar
The Toolbar provides easy access to most of the program's functions. In addition to that, it can be used to control the other layout items.
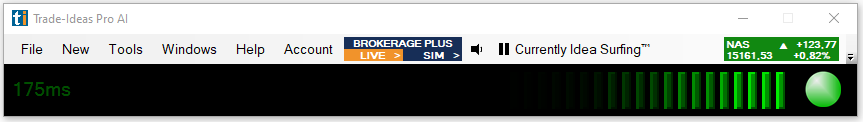
Minimize the Toolbar by clicking the minus sign in the upper right-hand corner, and all other windows will minimize as well. Bring the minimized Toolbar back from the Taskbar of your computer, and all other layout items will restore as well.
You can also control the behavior of the layout items via the Windows Tab of the Toolbar.
The Toolbar is the core control center of the program, providing access to most of its features. Each menu item of the Toolbar and its specific function within the program will be discussed below, going from left to right.
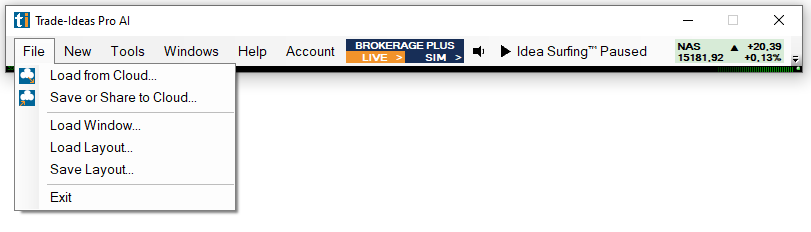
File Tab
The File Tab's main function is to save, load and share your personal settings and custom layouts in the Trade Ideas Cloud.
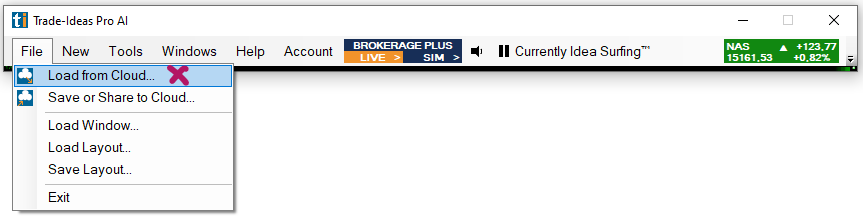
Load from Cloud
The Trade Ideas Cloud feature allows you to save, load, and share your personal layouts and strategies, making worries about computer crashes a thing of the past. You can access your cloud from any computer, so using multiple devices is trouble-free. Please note, however, that you can only be logged into one instance of the program at a time. In addition to saving your layouts and strategies, our cloud feature also lets you share them with others with one simple click.
The Load from Cloud Window displays the name, the time and date, the file type as well as the number of windows an item contains. Click on a header, to sort by it.
The search field at the top, as well as the filter function to the right, make the retrieval of specific items easy.
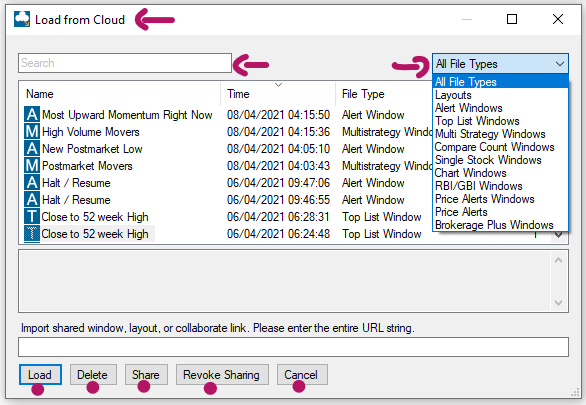
Once you have selected an item, you have the choice of loading, deleting, or sharing it. In addition to that, you can revoke the sharing of any previously shared layouts or strategies.
There are various sharing options:
-
Scan the QR code
-
Select Copy All, to save the Cloud link to your clipboard and paste it into an email or messaging app.
-
Click the Twitter icon and include a text message if you like.
To load a Cloud link that someone has shared with you, paste the URL string into the Import field. Then select Load.
To exit the menu, select Cancel or click on the X in the upper right-hand corner.
Save or Share to Cloud
If you have rearranged a channel layout or created a new layout and would like it to always open this way, you need to save it to your cloud.
Open the File Tab of the Toolbar and select Save or Share to Cloud.
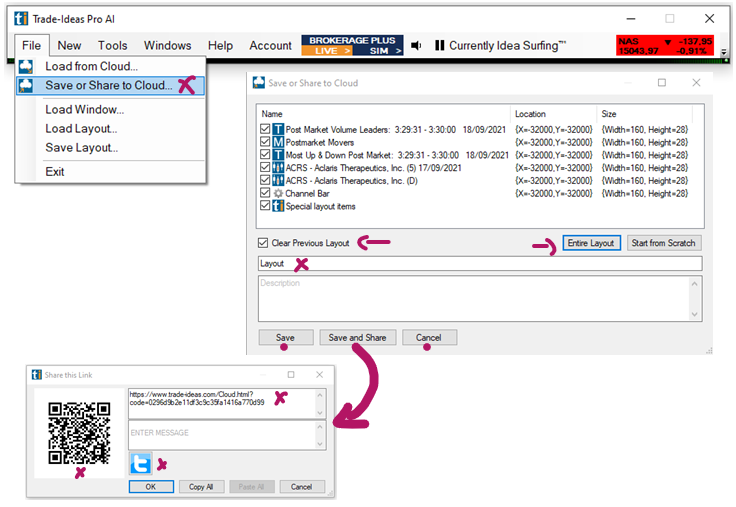
To keep all layout items exactly as arranged, select Entire Layout. You will see that all items will now have a checkmark.
To only include certain layout items, make your selection by checking individual boxes.
Start from Scratch will deselect all checkboxes.
Enter a name and a description for your new layout.
If you would like to automatically close any other open layout or channel in the future, whenever you load this new layout, select Clear Previous Layout.
If you would like to load this layout on top of any already opened layout, leave this checkbox blank.
Select Save when you are done or select Save and Share to share the layout with others before saving it to the cloud.
There are various sharing options:
-
Scan the QR code
-
Select Copy All, to save the Cloud link to your clipboard and paste it into an email or messaging app.
-
Click the Twitter icon and include a text message if you like. If you haven't connected Trade Ideas to Twitter yet, a Twitter Authorization Form will open. Log in with your Twitter username and password. Then click, Authorize App. Thereafter, copy the displayed Pin Code into the field at the bottom left-hand side of the window and select Confirm.
Select OK when you are done.
Your new layout or layout item is now stored in your cloud, from where it can easily be loaded. Just go to the Toolbar, open the File Tab and choose Load from Cloud. To find a saved layout, you can enter its name in the search field, or scroll through the list. Highlight your layout, then choose Load.
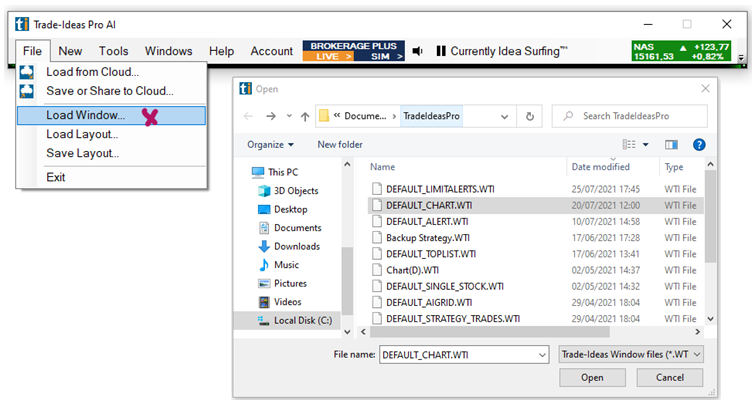
Load Window
The Load Window option provides access to the default version of your Trade Ideas windows. The default layouts of your Chart, Single Stock, Brokerage Plus, and AI Windows are saved in the TradeIdeasPro folder on your local computer.
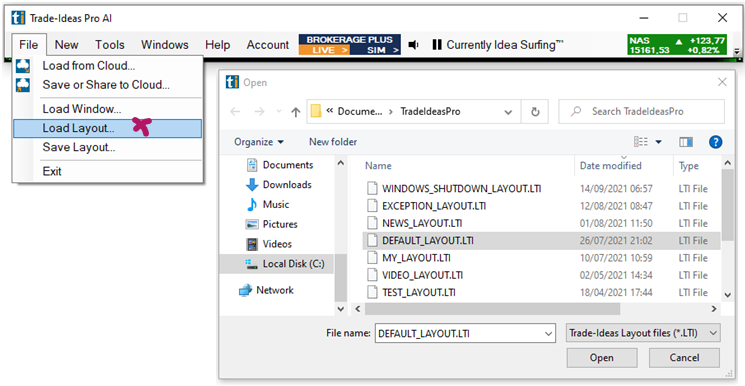
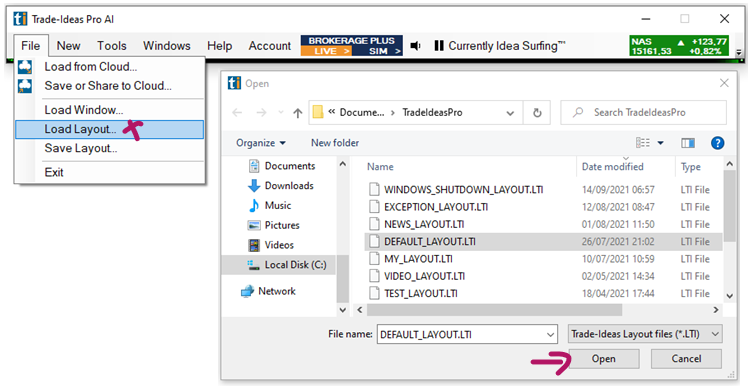
Load Layout
The Load Layout option provides access to the default layout, which populates whenever you start the program and any other layout that you have saved via the path Toolbar > File Tab > Save Layout. These layouts are saved in the TradeIdeasPro folder on your local computer.
More settings for your default layout can be found in the Tools Tab of the Toolbar under Layouts.
Here, you can choose what happens when you exit the software. You can choose Always save layout, Never save layout or Ask to save layout.
Save Layout
The Save Layout option enables you to save your current layout as the default. This default layout will load whenever you start the program.
To save a layout as your default, select Save Layout and don't alter the automatically given name DEFAULT_LAYOUT.LTI.
If you give your layout a different name, it can be saved in the layouts folder without being used as the default layout.
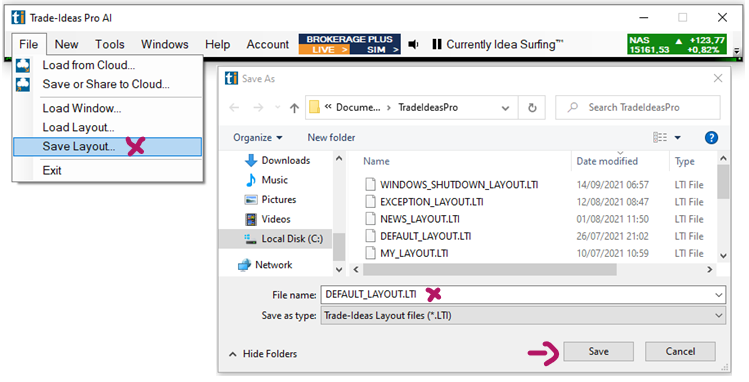
To access any saved layout, open the File Tab of the Toolbar and select Load Layout. This will open the TradeIdeasPro folder on your local computer where these layouts are saved.
More settings for your default layout can be found in the Tools Tab of the Toolbar under Layouts. Here, you can choose what happens when you exit the software. You can choose Always save layout, Never save layout or Ask to save layout.
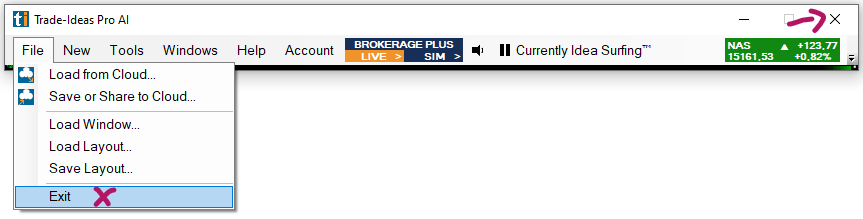
Exit
Exit closes the application.
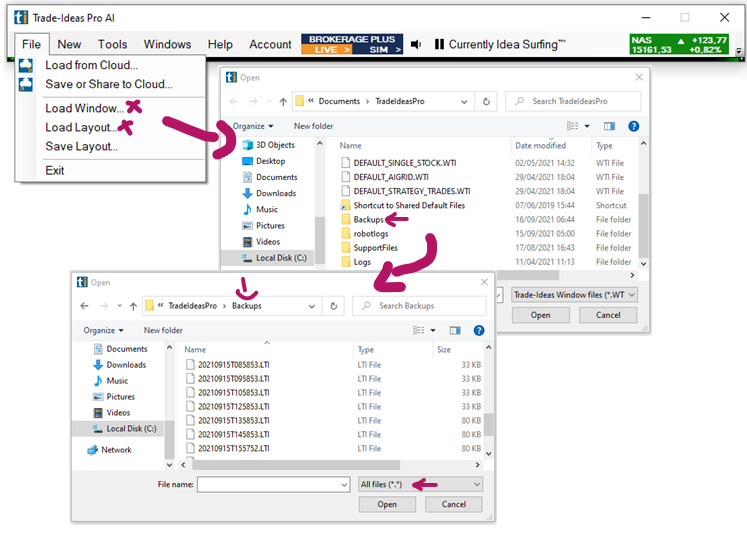
Backups, Logs, Support Files
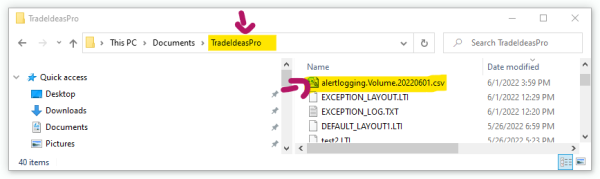
The software automatically creates backup files of your default layout in regular intervals while the program is running. These backup files with the extension .LTI are stored on your local computer in the TradeIdeasPro Backups folder. The Backups folder can be accessed via the Load Layout and Load Window option. Select Backups from the list of available files and folders. To see the individual .LTI files, select All Files from the dropdown in the bottom right-hand corner of the popup menu. You will find multiple backup files of your default layout covering several days.
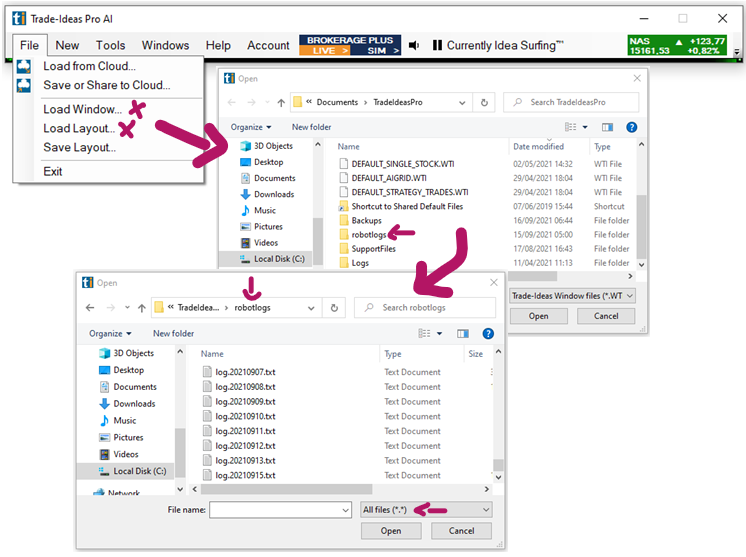
The folder robotlogs (Toolbar > File > Load Window/Load Layout > robotlogs) contains your log files in txt format. Each file is dated.
If you contact our support team for troubleshooting purposes, you might be asked to send your log files via the Send Files to Support option in the Help Tab of the Toolbar (Toolbar > File > Load Window/Load Layout > SupportFiles).
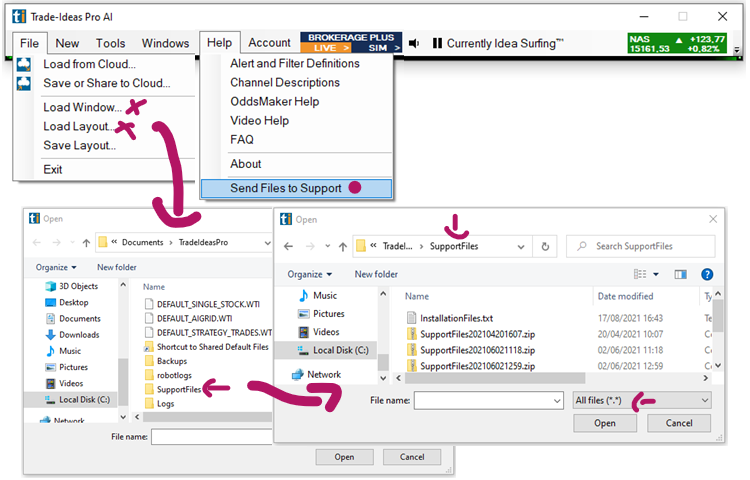
The SupportFiles folder contains the zip folder for each upload. You can access it by selecting File from the Toolbar, then selecting Load Window or Load Layout, and double-clicking the SupportFiles folder.
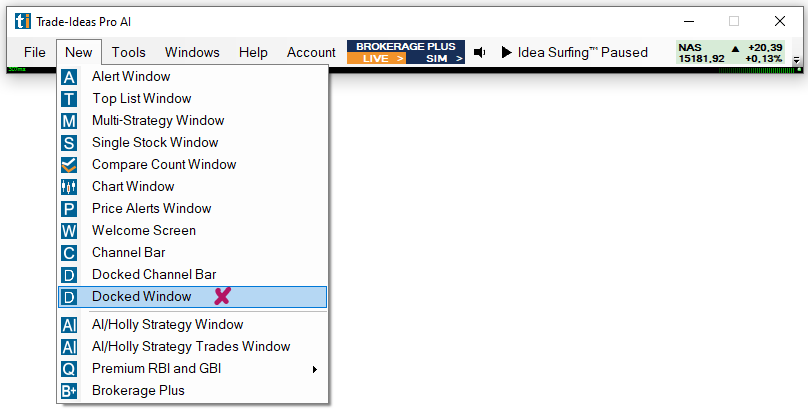
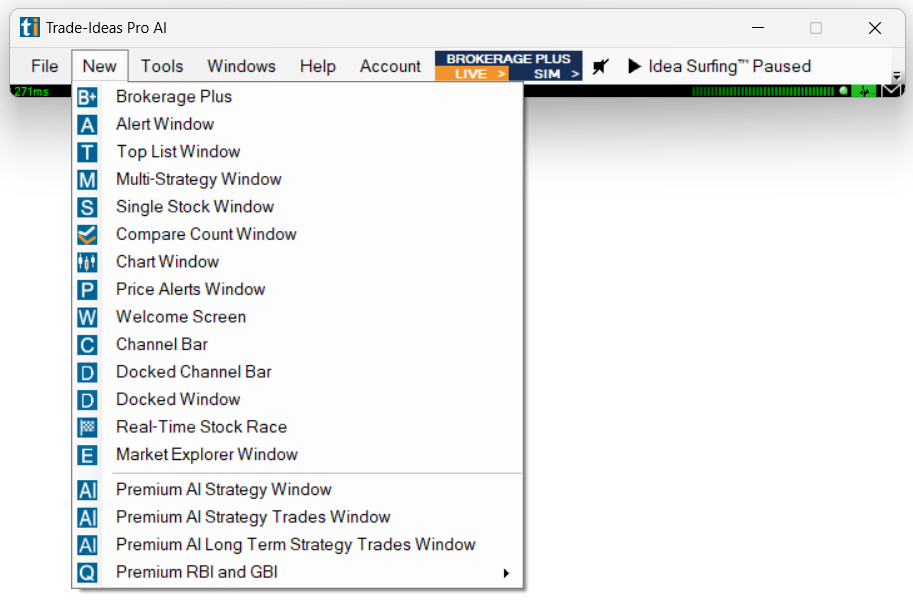
New Tab
The New Tab enables you to load new instances of the different types of Trade Ideas Windows. In addition to that, you can open the Channel Bar and the Brokerage Plus Module.
Brokerage Plus
The Brokerage Plus Module is the control center for all your orders and positions. It connects to participating brokers, enabling you to execute trades directly within Trade Ideas via one-click order entry from charts and scanners. In addition to that, it enables you to automate your own strategies. It also provides access to a real-time simulator, in which you can test your strategies or learn trading before going live. For detailed info jump to the Brokerage Plus section.
Alert Window
Stream and display events as they happen in real-time. The Alert Window monitors and streams events in real-time based on customizable parameters. New events appear as line items in the alert window. You can add graphically rich columns and sound alerts to enhance and structure the data. Each Alert window is marked with an “A” on the top left-hand side of the window. There can be any number of Alert Windows. For detailed info jump to the Alert Window section.
Top List Window
Find hidden opportunities by ranking and sorting multiple data points at the same time using innovative color-assisted sorting. A Top List Window displays a list of symbols that are meeting specified criteria. Each Top List Window is marked with a “T” in the top left-hand side of the window. Instead of showing a real-time stream of event-based alerts as displayed in an Alert Window, the Top List Window updates its list of filtered symbols every 30 seconds. It is akin to an automatically refreshing and updating spreadsheet and can be sorted in many different ways. By default, each Top List window delivers the top 100 symbols based on your custom configuration. This record count can be extended to show a maximum of 1000 symbols. There can be any number of Top List Windows. For detailed info jump to the Top List Window section.
Multi-Strategy Window
A Multi-Strategy Window allows you to combine multiple independent Alert Windows into a single space-saving container window. Each strategy contains its own unique alert and filter requirements. As new signals arrive, they stream in real-time. For easy visual differentiation, the color scheme for each strategy can be customized. For detailed info jump to the Multi-Strategy Window section.
Single Stock Window
The Trade Ideas Single Stock Windows provides key fundamental and other customizable data about a chosen stock. With Symbol Linking enabled, it will automatically display details about the symbol that you have selected in your scanner or chart. Its News Tab displays the latest Google news of the stock, the Profile Tab provides insight into the company's field of operation, the Insider Tab shows Insider Trades, and the Similar Tab displays a list of stocks that are similar either in price action or business operation. For detailed info jump to the Single Stock Window section.
Compare Count Window
The Compare Count Window offers a visual comparison of two strategies. Typically, it is used to compare a bullish against a bearish strategy, and by default, it compares New Highs versus New Lows. It is a great visualization tool that can provide an indication of what the markets are up to. For detailed info jump to the Compare Count Window section.
Chart Window
The Chart Windows allow you to visually confirm an alert. The time frames range from 1 minute to monthly. Charts can be marked up with trend lines and other annotations, a variety of indicators can be added, and price alerts can be set. With an account at a participating broker, orders can be sent directly from the charts either via one-click order entry or drag and drop. For detailed info jump to the Chart section.
Price Alerts Window
Our software enables you to set up Price Alerts for stocks. These Price Alerts will be displayed not only visually in the charts, but are also listed in the Price Alerts Window. Once the selected price is reached, the Price Alerts Window will pop up to alert you visually and you can additionally enable sound alerts. You can add notes to your Price Alerts and an expiration and you can even share them with fellow traders. For detailed info jump to the Price Alerts section.
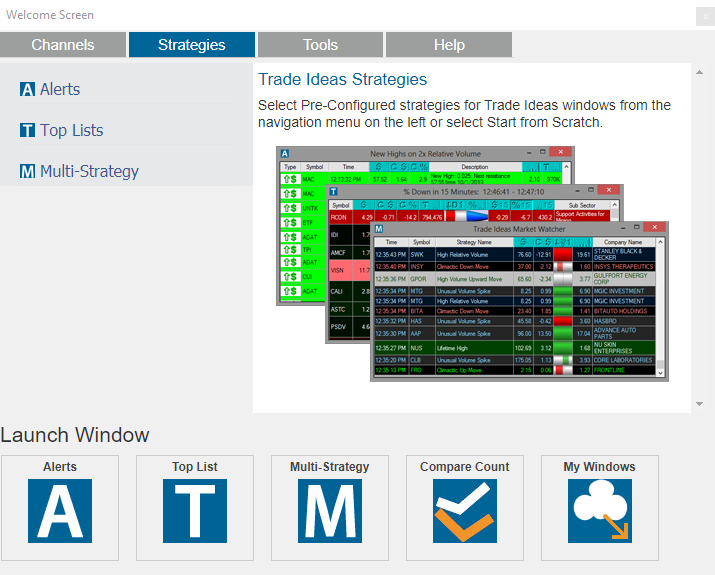
Welcome Screen
The Welcome Screen provides an overview of and access to some of the different Channels of the Channel Bar and some individual bullish and bearish strategies. In addition to that, it describes some of the Trade Ideas Windows and Tools and provides easy access to them.
Channel Bar
Our Channel Bar contains over 40 Channels with preconfigured, but customizable scans covering a wide variety of trading styles and opportunities. They are the ideal starting point for new Trade Ideas users. Each Channel is made up of Alerts, Top List, and Multi-Strategy Windows as well as Charts enabling you to get started with trading right away. For detailed info jump to the Channel Bar section.
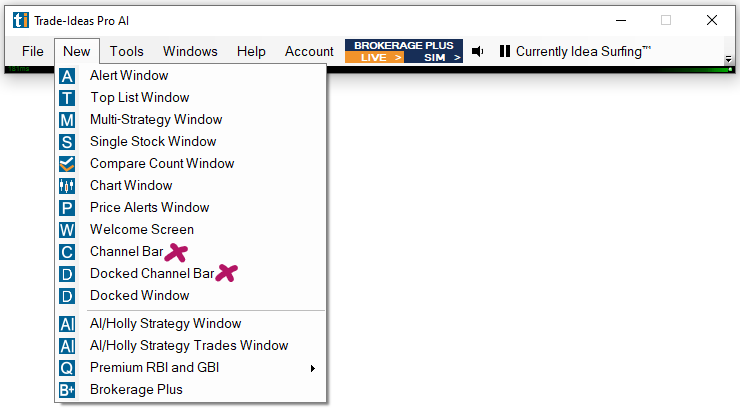
Docked Channel Bar
Trade Ideas offers two different layout options, free-floating and docked. These layout options are not exclusive, they can be combined. Docks make switching between different layouts and browsing through different channels a breeze. In addition to that, a Dock can easily be moved from one area of your screen to another. Our Docked Channel Bar contains over 40 Channels with preconfigured, but customizable scans covering a wide variety of trading styles and opportunities. They are the ideal starting point for new Trade Ideas users. Each Channel is made up of Alerts, Top List, and Multi-Strategy Windows as well as Charts enabling you to get started with trading right away. For detailed info jump to the Docked Channel Bar section.
Docked Window
Trade Ideas offers two different layout options, free-floating and docked. These layout options are not exclusive, they can be combined. Docks make switching between different layouts and browsing through different channels a breeze. In addition to that, a Dock can easily be moved from one area of your screen to another. For detailed info jump to the Docked Window section.
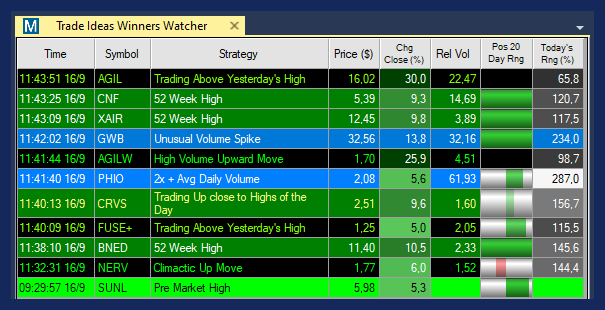
Real-Time Stock Race
The Real-time Stock Race enables you to see important metrics that are generally displayed in our spreadsheet-like Top List Windows, in a very easy and engaging way. Your top-ranking stocks will race against each other, helping you to see winners, the losers, and the ones in the middle field at a glance! The Real-Time Stock Race is a unique way of data visualization that distills the stock market action down to its essence and combats the information overload many traders face. For detailed info jump to the Real-Time Stock Race section.
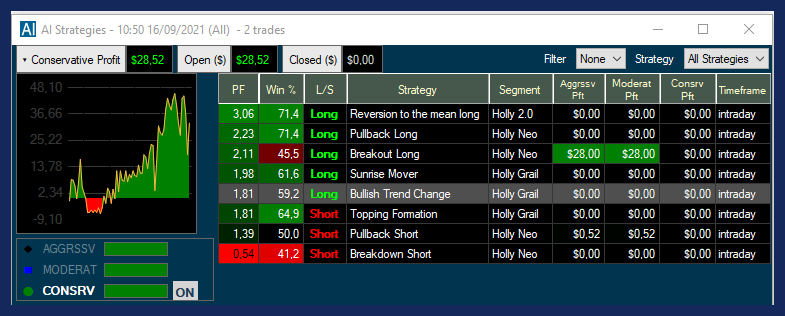
Premium AI Strategy Window
The Premium AI Strategy Window will list the strategies that the Trade Ideas investment discovery engine Holly AI, after a long night of backtesting and optimization, has carefully selected for the upcoming trading day. For detailed info jump to the AI/Holly Strategy Window section.
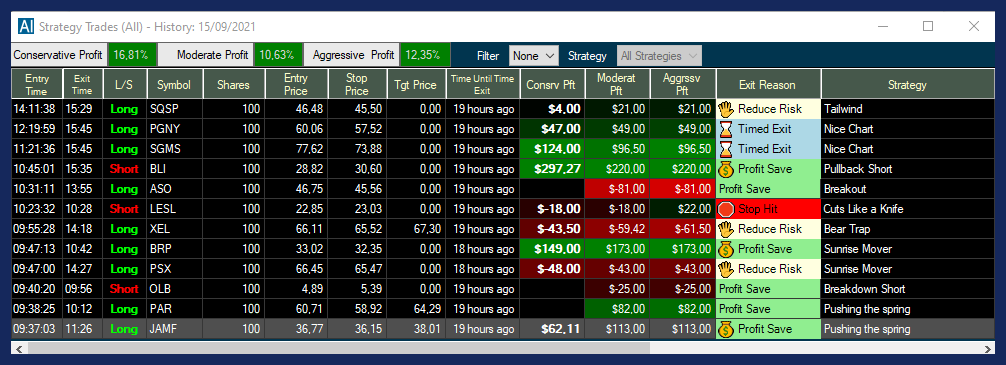
Premium AI Strategy Trades Window
Our Holly AI is a Virtual Assistant, designed to provide real-time trade suggestions, including entry prices, stops, and targets. To see Holly’s trading in action, head to the AI Strategy Trades Window. All the trades that Holly enters during the day will appear here. For detailed info jump to the AI/Holly Strategy Trades Window section.
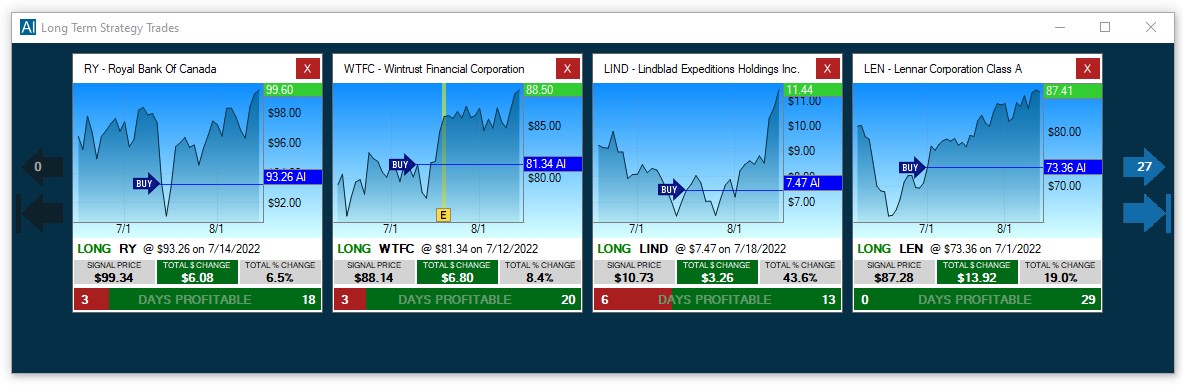
Premium AI Long Term Strategy Trades Window
Holly exits all her trades at the end of each trading day. However, the trade catalysts don’t simply expire when the stock market closes. Some of these triggers offer the potential to catapult a stock over the course of several days or weeks in the direction of the day’s trading signal. The AI Longterm Strategy Trades Window enables you to see these trades. Traders can now benefit from Holly’s carefully selected trades beyond the initial trading day, and easily track them. For detailed info jump to the Premium AI Long Term Strategy Trades Window section.
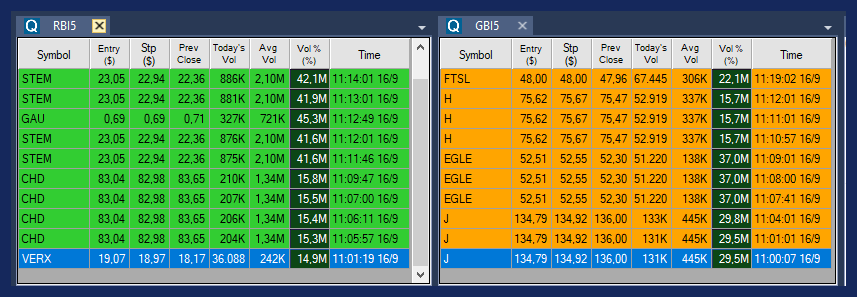
Premium RBI and GBI
The Premium RBI and GBI Alert Windows are based on a pattern recognition system and expect continuation. RBI stands for red bar ignored and GBI for green bar ignored. These alerts can be shown on 5-, 15- and 30-minute timeframes. The RBI alert requires at least four green bars in precession of a red bar. The alert triggers once the subsequent bar takes out the RBI’s high. The GBI alert requires at least four red bars in precession of a green bar. The alert triggers once the subsequent bar takes out the GBI’s low. For detailed info jump to the Premium RBI/GBI section.
Market Explorer Window
The Trade Ideas Market Explorer is a sophisticated tool that enables us to build dedicated high-performance scans for our users beyond the software’s boundaries. For detailed info jump to the Market Explorer section.
Tools Tab
The Tools Tab provides access to various personalization options. You can modify the font, make layout, language, and time adjustments, configure your connection, create personal Symbol Lists, and set up internal as well as external linking.
In addition to that, the Tools Tab provides access to our Custom Formula Editor.
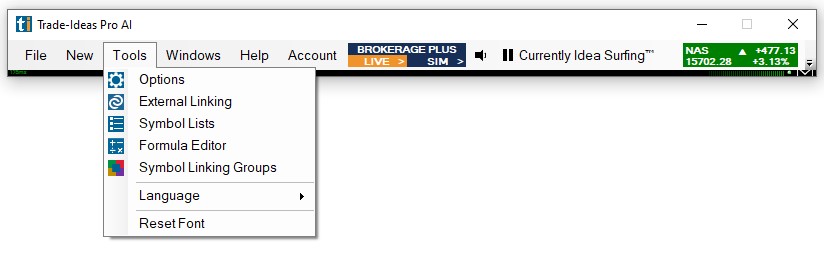
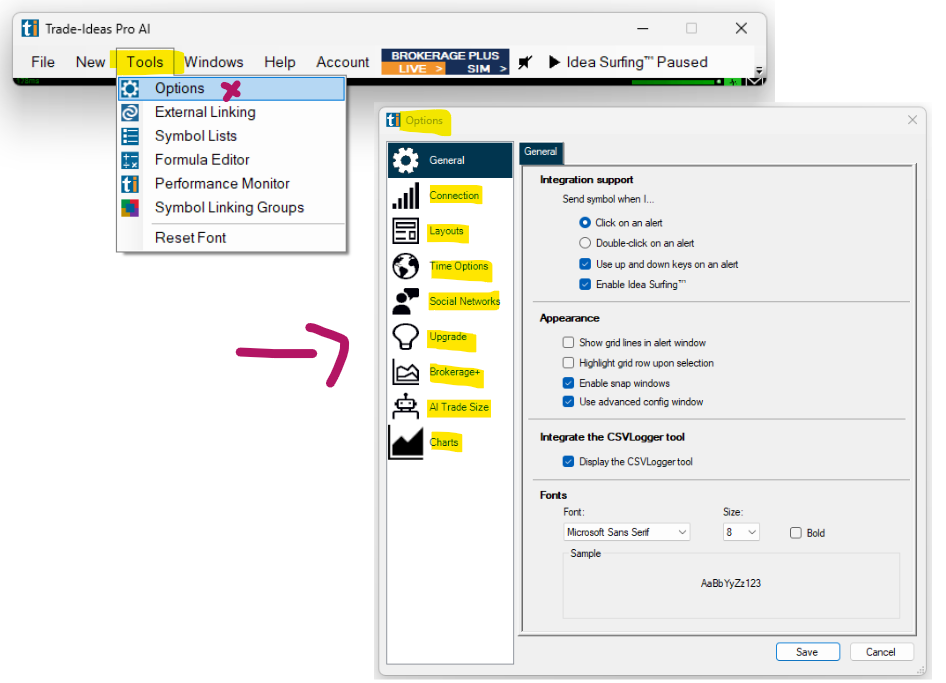
Options
The Options Menu enables you to adjust various settings of the program.
Check out the individual option sections for more details:
General
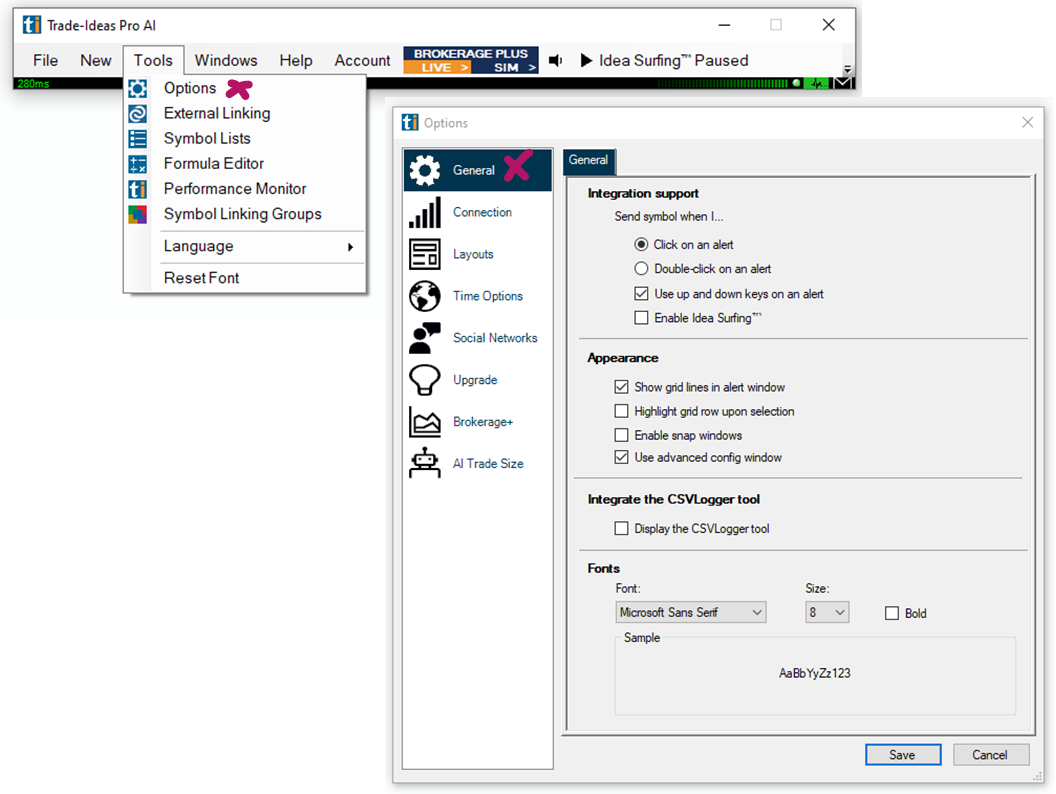
Integration Support
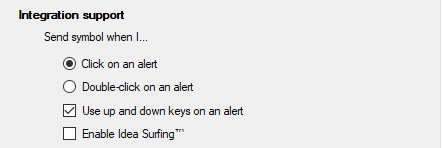
Here, you can choose if the symbol displayed in a Trade Ideas Window will be sent to other linked applications or windows, like a Chart or a Single Stock Window with a single click or a double-click.
Furthermore, you can decide whether you would like to be able to use your up and down keyboard keys to toggle through alerts.
Lastly, you can enable or disable Idea Surfing.
Appearance
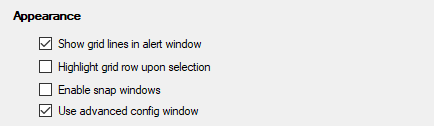
Here, you can choose if your Alert and Top List Windows are displayed with or without grid lines.
In addition to that, you can check or uncheck if the entire row of an Alert or Top List Window will be highlighted upon selection.
This option is useful if you would like to copy and paste an entire data row into a spreadsheet. If you would like to be able to highlight and/or copy and paste individual columns or cells, uncheck this option.
When Snap Windows are enabled, the program will try to close any gaps between windows. If gaps between windows are desired, this option should be unchecked.
By default, the Advanced Config Window is enabled for all Alert and Top List Windows and can be accessed via the right-click Menu under Configure.
If this option is disabled, a very limited Config Window will be presented when selecting Configure via the right-click menu. Here, you can only customize the minimum and maximum price of stocks to scan for as well as the minimum average volume. Additionally, you can change the strategy name and choose an entirely new strategy. You cannot add alerts and filters, symbol lists, or make a selection of which exchanges will be scanned or which columns will be shown. You can, however, always switch to the Advanced Config Window by selecting the Advanced Button.
Integrate the CSVLogger tool
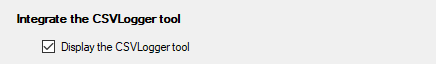
When this tool is enabled here, as well as in an individual Top List or Alert Window, the incoming alerts will automatically be added to a CSV file which is stored in the TradeIdeasPro folder on your PC.

Fonts
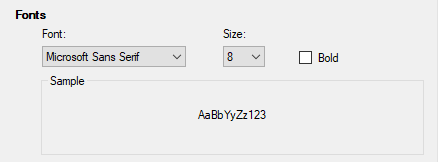
You can customize the look and feel of our program by selecting your preferred font size. You can choose from a variety of fonts, increase or decrease the font size or make it bold.
If you are unhappy with your font settings, just go to Tools Tab of the Toolbar and choose Reset Font from the dropdown to restore the default.
Connection
The default Connection Type is Primary. This connects you to our main server bank and is generally the fastest connection. The Primary connection requires connection over the specific Port 8844, which might be an issue depending on your network.
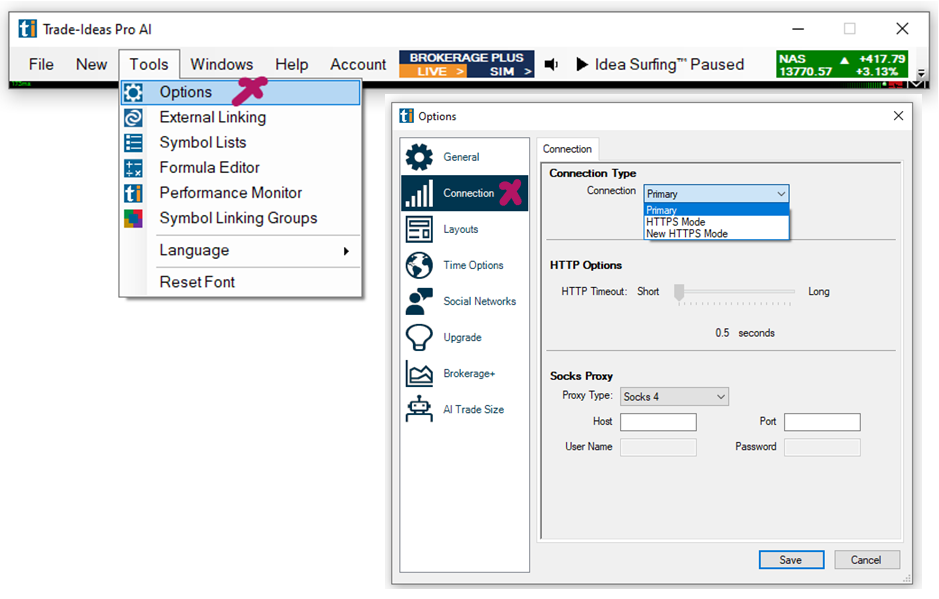
If you are experiencing connectivity issues due to being on a controlled network (Firewall, Antivirus software, ISP settings, Hotspot) select HTTPS Mode. This way, you connect over the standard web browser available ports. Meaning, as long as you are able to browse the internet on your network, you will also be able to connect to Trade Ideas. HTTPS Mode and New HTTPS Mode both use the same port configuration, standard secure Web Port 443.
Whenever you make changes to the Connection Type settings, you have to reset your connection. To do so, choose the Accounts Tab from the Toolbar and select Reset Connection.
Layouts
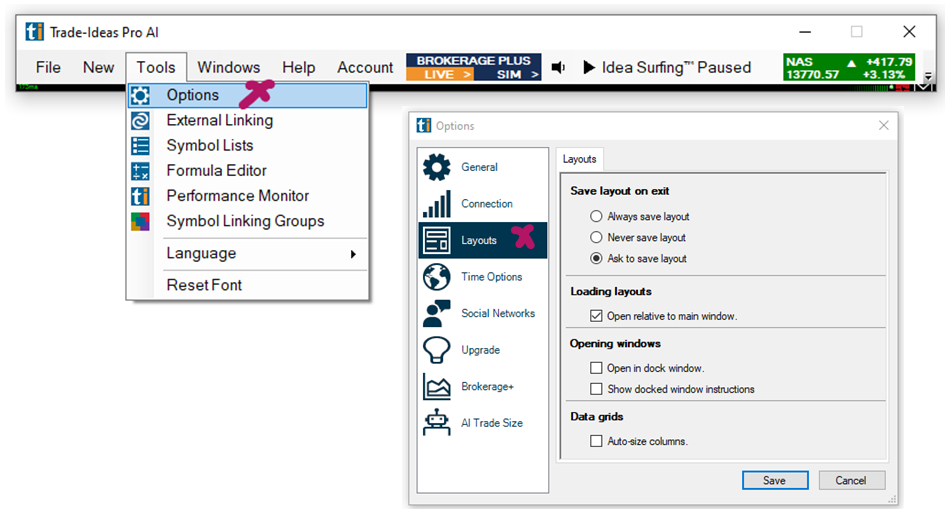
Save layout on exit
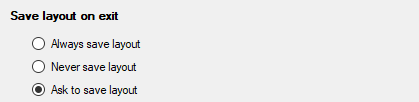
Here, you can choose whether the program automatically always saves the open layout, never saves the layout, or prompts you, if you would like to save the layout on exit.
Loading layouts
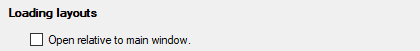
When the option Open relative to main window is selected, all other layout items (Channel Bar, windows) will always open relative to the lower left-hand corner of the Toolbar. With this option enabled, it is easy to move your entire layout to a different monitor. Simply place your Toolbar on the monitor of your choice, then reload your layout.
Opening windows
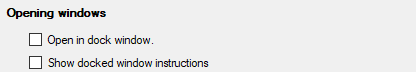
You can choose if you would like new layout items to always open in a Dock or free-floating.
If you would like all newly opened windows to automatically open in a Dock, check the option Open in dock window.
If you leave this option unchecked, you will still have the ability to manually create Docks.
Check the option Show docked window instructions for further info about our Docks.
Data grids
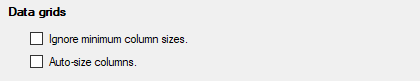
Ignore minimum column sizes When this option is checked, the minimum column sizes of the program's global settings will be ignored.
Auto-size columns If this option is checked, the program will auto-size the column based on the available space. Uncheck the option Auto-size columns if you prefer narrow columns.
Collaborate Strings
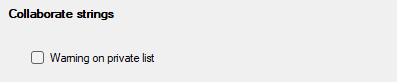
When the option Warning on private list is enabled, you will receive a warning message, whenever you share a scan that contains a personal symbol list.
Personal symbol lists cannot be transferred by sharing a scan, this means that the user you shared the scan with, will not see the same results as you. The other user might see no stocks, or he might see stocks from a random list of his own.
Only scans that contain no personal symbol lists will generate the same results when shared.
You can, however, share scans that contain preset TI symbol lists.
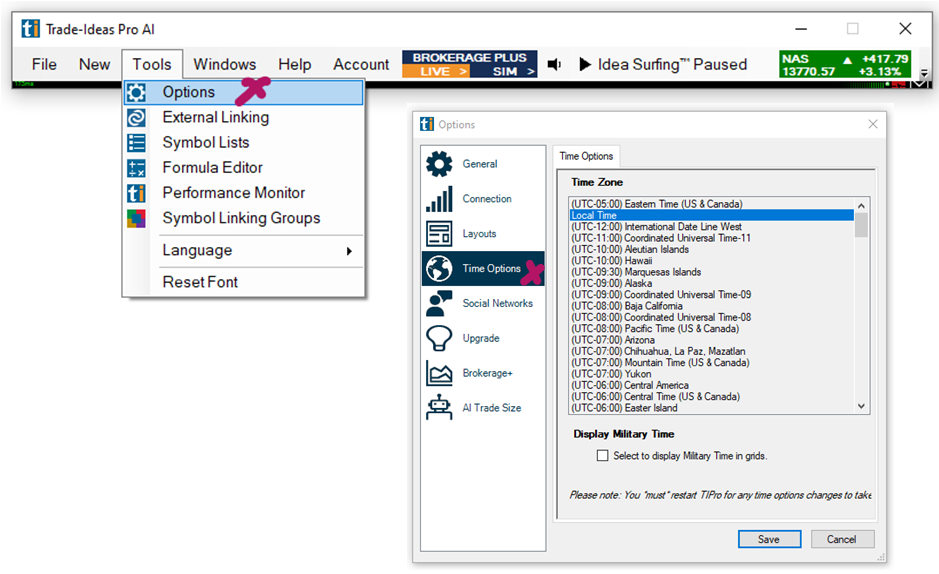
Time Options
Here, you can choose your own Time Zone or any other Time Zone you would prefer the software to operate with.
If your Brokerage account is connected to Trade Ideas via API, make sure that your PC’s Windows Operating System, the Trade Ideas software, and your Broker’s platform are all set to the same time settings and regional formatting.
Please note that a restart is required for any Time Zone changes to take effect.
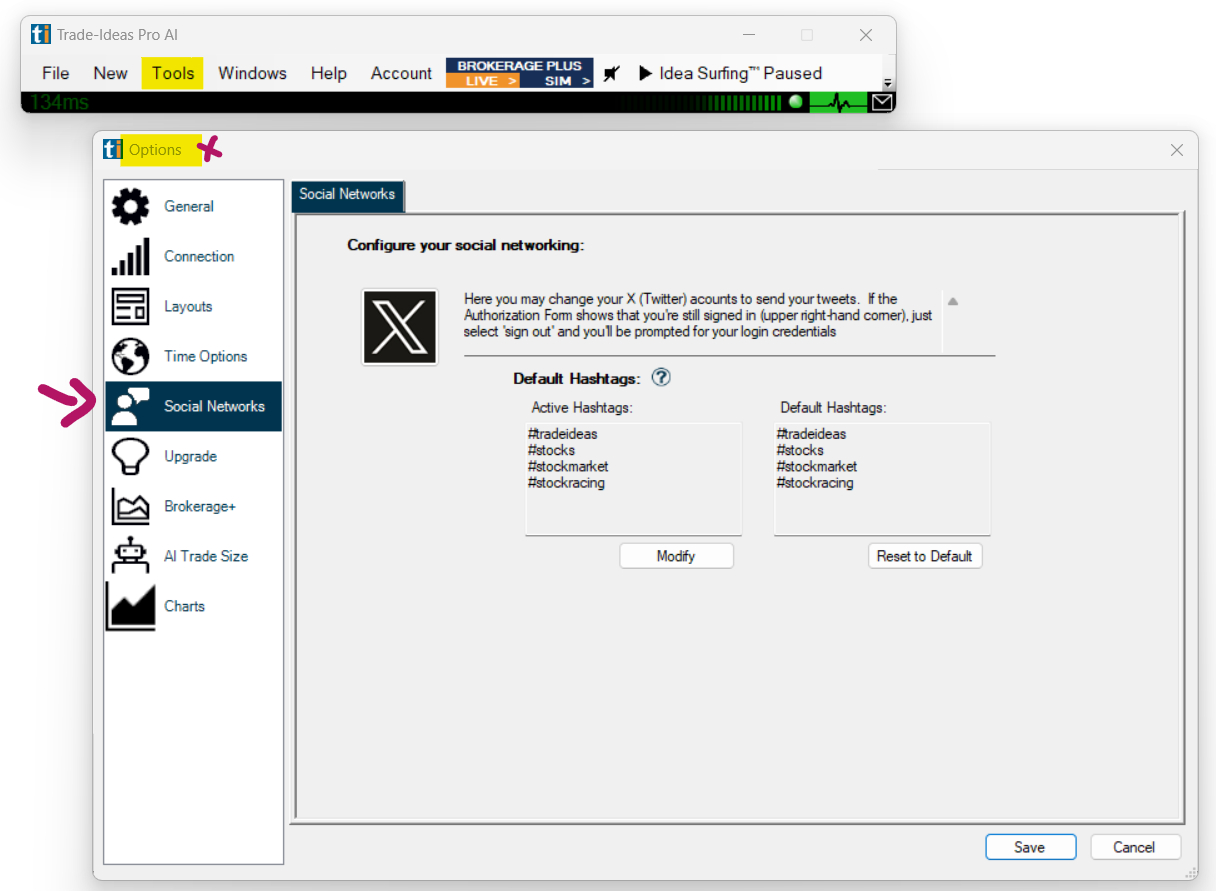
Social Networks
Our Collaboration feature allows you to share your scans, price alerts, charts, and other Trade Ideas Windows with your friends and followers on X, formerly known as Twitter.
To connect to your X account, click the X icon, then enter your X username and password and authorize TI Pro. After logging in, copy the PIN above into the box on the bottom left-hand side. Then click Confirm.
You can also customize the Default Chart Share Hashtags.
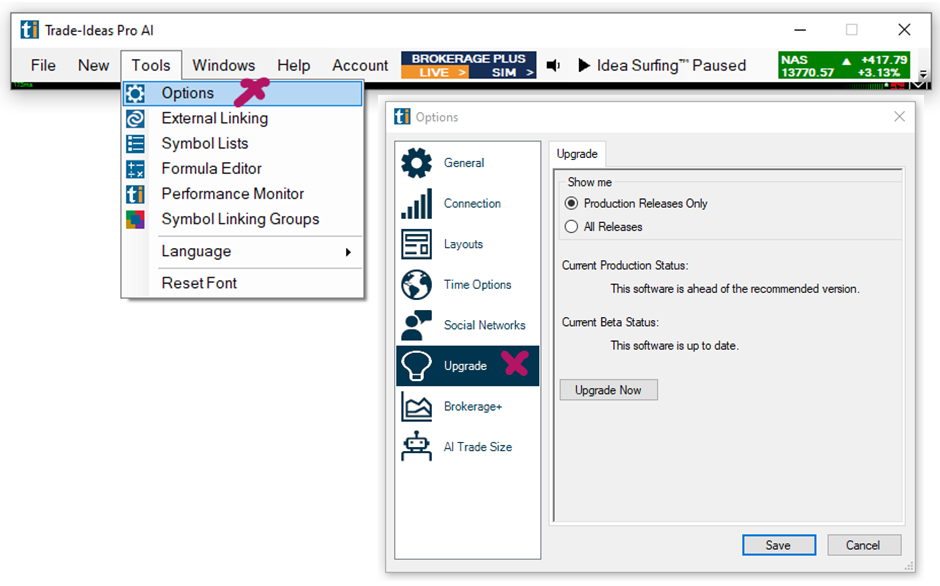
Upgrade
In the Show Me section, you can specify if you would like to be informed of All Releases or Production Releases Only.
The New Tab of the Toolbar will turn green whenever there is a new version of the software available.
The Upgrade Now button will open our Download page in your browser window.
Brokerage Plus Preferences
The Preferences Menu enables you to set up defaults for the Manual Entry Order Panel as well as Custom Quick Buttons.
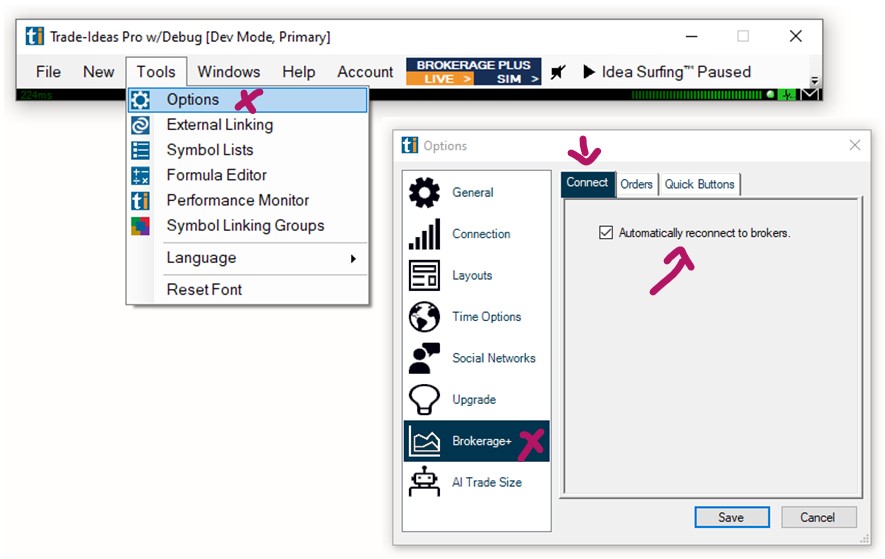
Connect Tab
When the option Automatically reconnect brokers is checked, our program will automatically establish a connection to the last Broker(s) and/or simulator you were connected to.
Please note, in order to establish the connection automatically, your brokerage platform needs to be up and running before the Brokerage Plus Module is opened.

Orders Tab
The Orders Tab enables you to configure the default Order Entry Panel settings:
Quick Buttons Tab
The Quick Buttons Tab enables you to create "Hotkeys" to speed up your trading.
Connect Tab
When the option Automatically reconnect brokers is checked, our program will automatically establish a connection to the last Broker(s) and/or simulator you were connected to.
Please note, in order to establish the connection automatically, your brokerage platform needs to be up and running before the Brokerage Plus Module is opened.
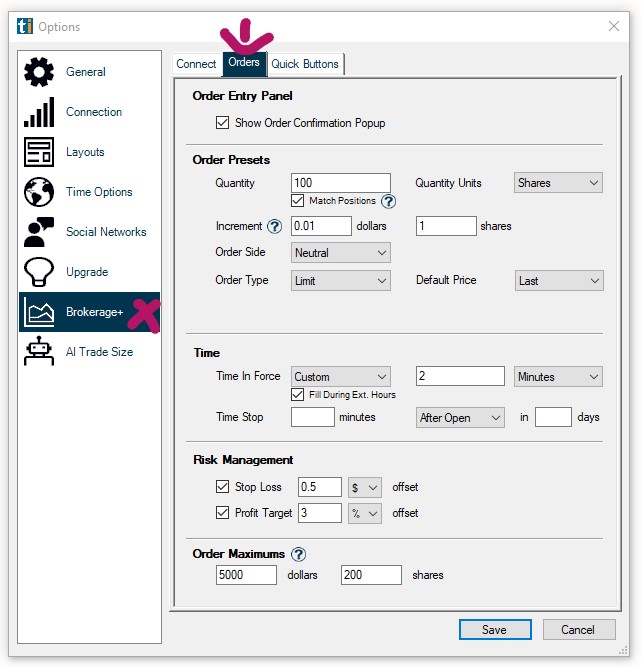
Orders Tab
The Orders Tab enables you to configure the default Manual Order Entry Panel settings:
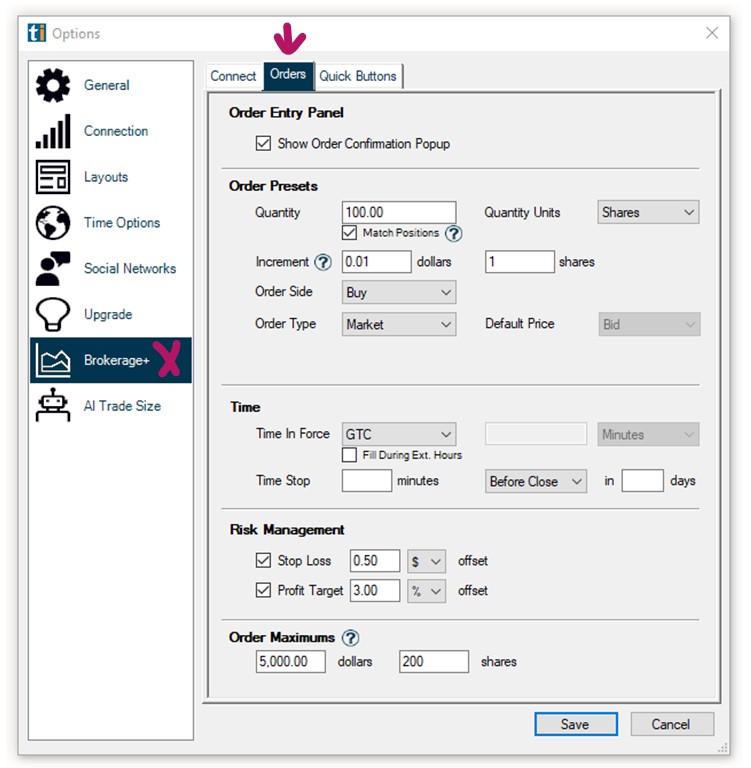
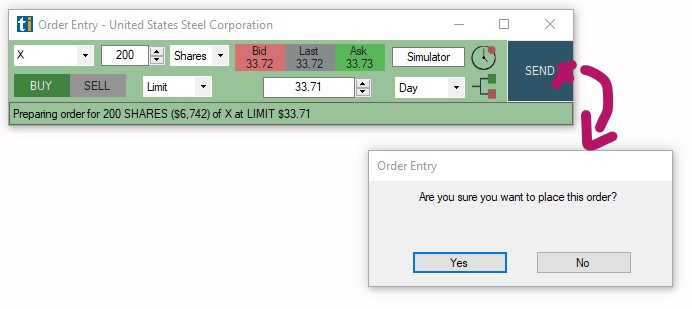
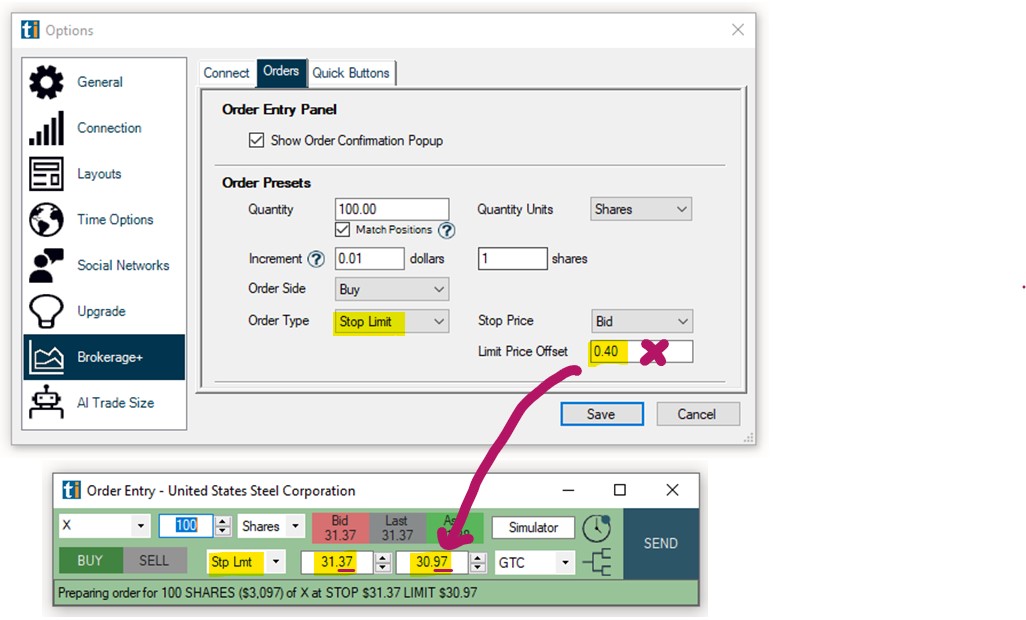
Show Order Confirmation Popup
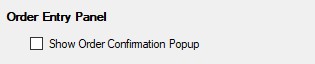
When this option is checked, a popup will open and ask for order confirmation after pressing the Send Button of the Order Entry Panel:
Order Presets
The Order Presets section enables you to define default settings/values for the fields of the Manual Order Entry Panel, saving you time when submitting manual orders:
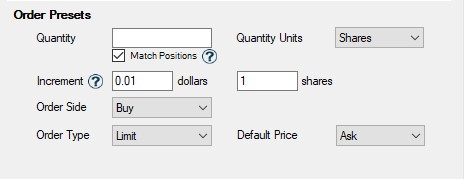
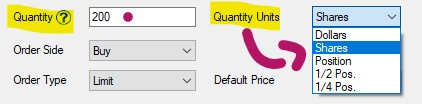
Quantity/Quantity Units: Use the Quantity field together with the Quantity Units dropdown to define a default number of shares or a dollar amount for orders made via the Manual Order Entry Panel:
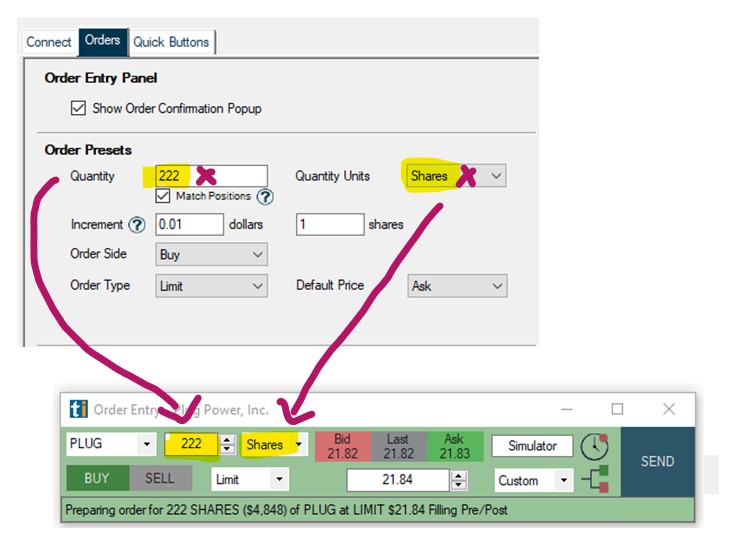
Example: If you entered 222 as the Quantity and selected Shares as Quantity Units, the Manual Order Entry Panel would always be prefilled with these values.
Match Positions: When this option is checked, the Quantity field will be prefilled with the value defined in the Quantity field, unless a position already exists. Existing positions, will use the current position size instead.
When this option is unchecked, the Quantity field will be prefilled with the value defined in the Quantity field for all symbols.
Increment: Here, you can define the amount to be added/substracted from the value entered in the Quantity field when using the increment and decrement buttons to the right of the Quantity Field. The default is set to 1 cent/1 share increase/decrease.
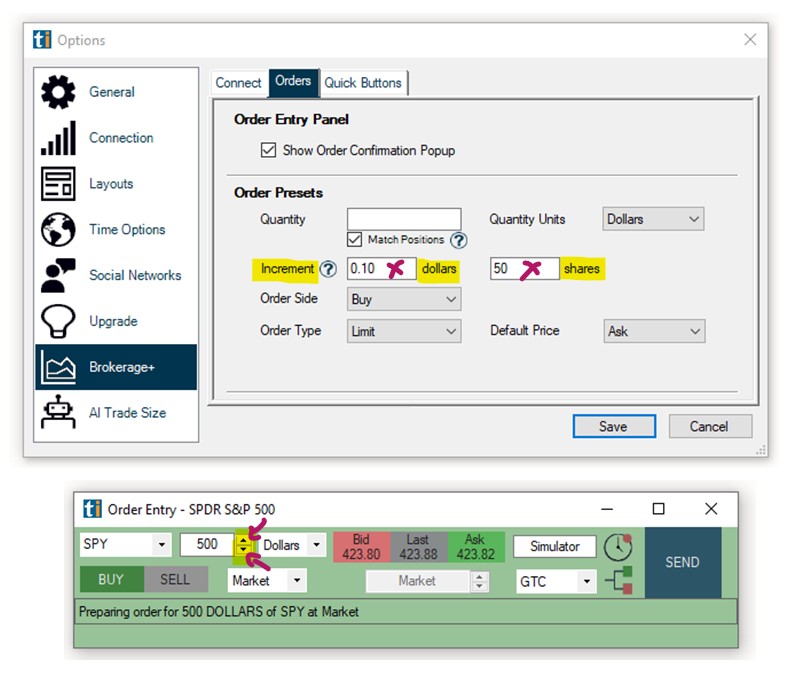
Example: If you entered 0.10 as the dollar increment, each click on the increment/decrement button would increase/decrease the dollar amount in the Quantity Field by 10 cents.
Example: If you entered 50 as the shares increment, each click on the increment/decrement button would increase/decrease the share number in the Quantity Field by 50.
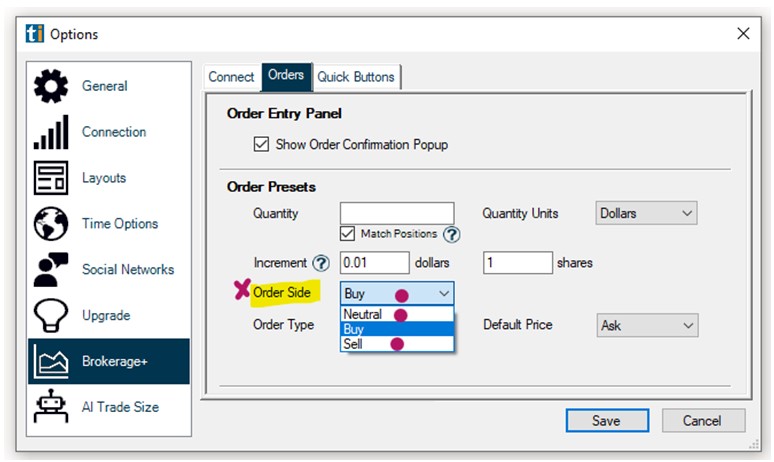
Order Side: Here, you can choose a preset order direction. Select Buy, if you generally go long, select Sell if you generally short stocks, select Neutral to make an ad-hoc selection directly in the Order Entry Panel.
Order Type: Here, you can choose one of 4 different order types to pre-populate in your Manual Order Entry Panel. Choose between Limit Order, Market Order, Stop Order or Stop Limit Order. Depending on your order type selection, further fields will populate.
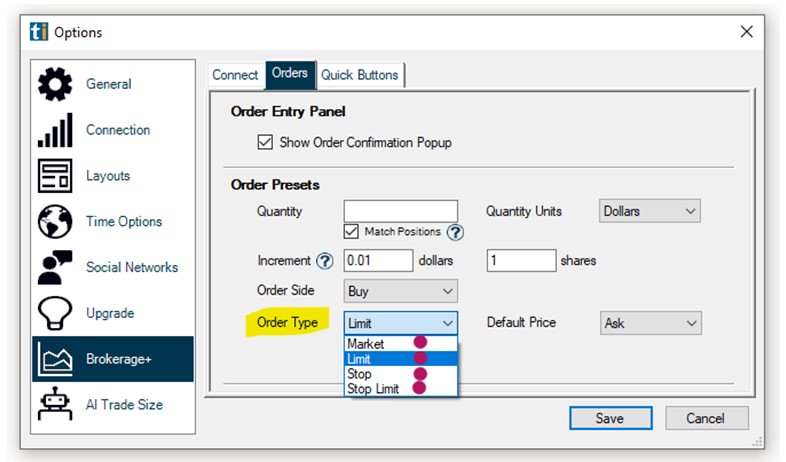
Market order: No further options
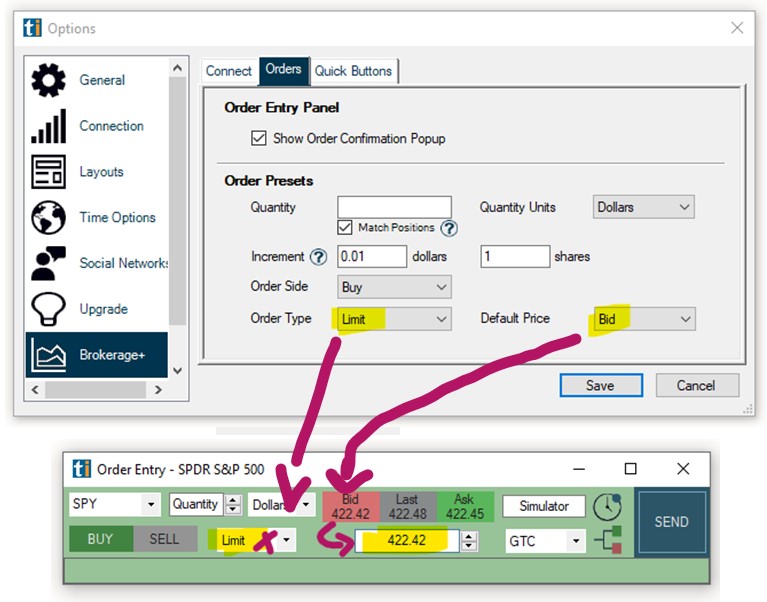
Limit Order: Decide whether the Default Price in the Manual Order Entry Panel will be the Last Price, Bid Price or Ask Price of the stock at that time. Select None to enter a Limit Price ad-hoc.
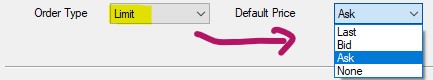
Example: If you entered Limit as your Order Type and selectd Bid as the Default Price, the Manual Order Entry Panel would be prefilled with the choosen values as shown below:
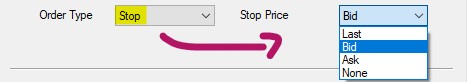
Stop Order: Decide whether the Stop Order in the Manual Order Entry Panel will be placed at the Last Price, the Bid Price or the Ask Price of the stock at that time. Select None to enter a Stop Price ad-hoc.
Stop Limit Order: Decide whether the Stop Order in the Manual Order Entry Panel will be placed at the Last Price, the Bid Price or the Ask Price of the stock at that time. Select None to enter a Stop price ad-hoc.
Enter a Limit Price Offset from the Stop Price at which the Limit Order will be placed.
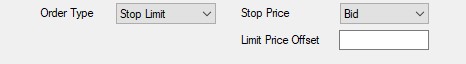
Example: If you entered Buy as your Order Side, Stop Limit as your Order Type and 0.40 as the Limit Offset Price, your Limit Order would be placed 40 cents below the chosen Stop Order Price as shown below:
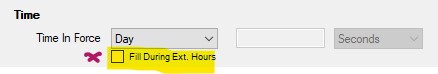
Time in Force:
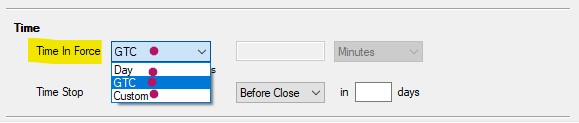
The Time in Force Field enables you to define when your submitted order will expire if not filled.
DAY: Order will remain open until today’s market close.
GTC (Good Till Cancelled): Order will remain open until you manually cancel it.
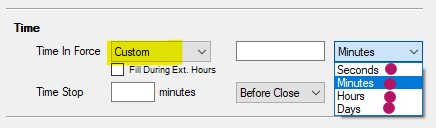
Custom: Select a custom time period in Seconds, Minutes, Hours or Days.
Fill During Extended Hours: When checked, orders can be submitted in premarket and postmarket via the Manual Order Entry Panel.
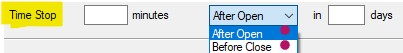
Time Stop: To add a Time Stop to your orders by default, enter a time in minutes and select if the time period will be calculated based on the Open or Close.
Example: If you entered 30 minutes and selected Before Close from the dropdown, your position would be exited via Time Stop at 3:30 pm Est today.
Example: If you entered 30 minutes and selected After Open in 3 Days from the dropdown, your position would be exited via Time Stop at 10:00 am Est. 3 days from now.
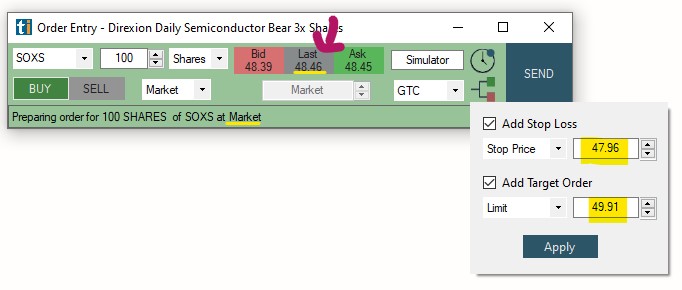
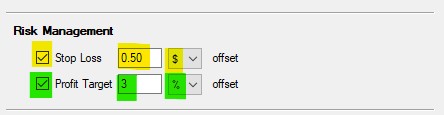
Risk Management:
To add a Stop Loss and/or Target (Bracket Order) to your orders by default, add a checkmark to either option and enter the Stop Loss/Target amount per share in either dollar or percent.

Example: If you entered 0.50 as your Stop Loss Offset amount and selected $ from the dropdown, a Stop Loss of 50 cents would be submitted together with your entry order.
Example: If you entered 3 as your Target Offset amount and selected % from the dropdown, a Target Order would be placed 3% above the Entry Order price.
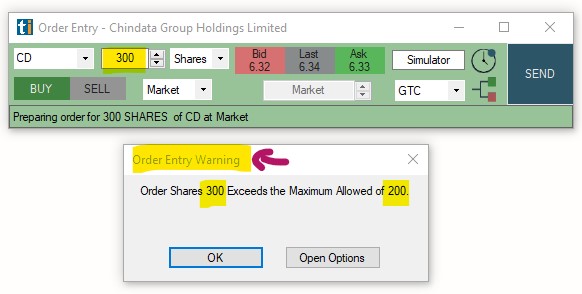
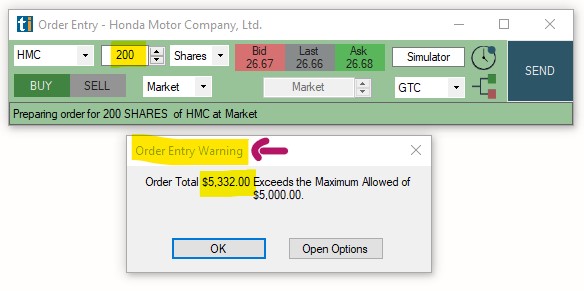
Order Maximums:
The Order Maximum option is a fail safe against user error. It enables you to limit the size of your position. When a maximum in Dollars and/or Shares is set, orders will not be submitted if they exceed your set maximum.
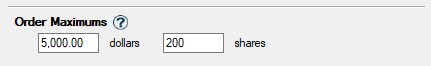
Example: If you entered 5000 Dollars and 200 Shares as your maximum position size, any order that exceeds one of these maximums won't be submitted and a warning message will appear.
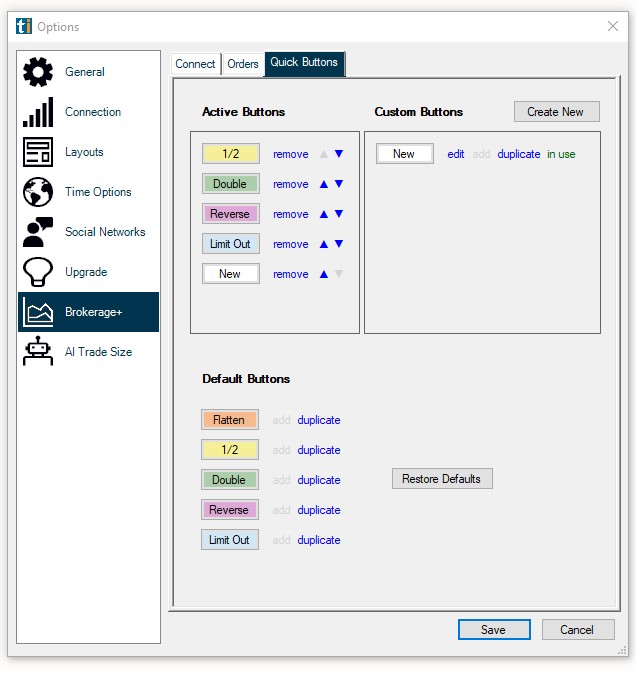
Quick Buttons
The Quick Buttons Tab enables you to create Hotkeys to speed up your trading and order process.
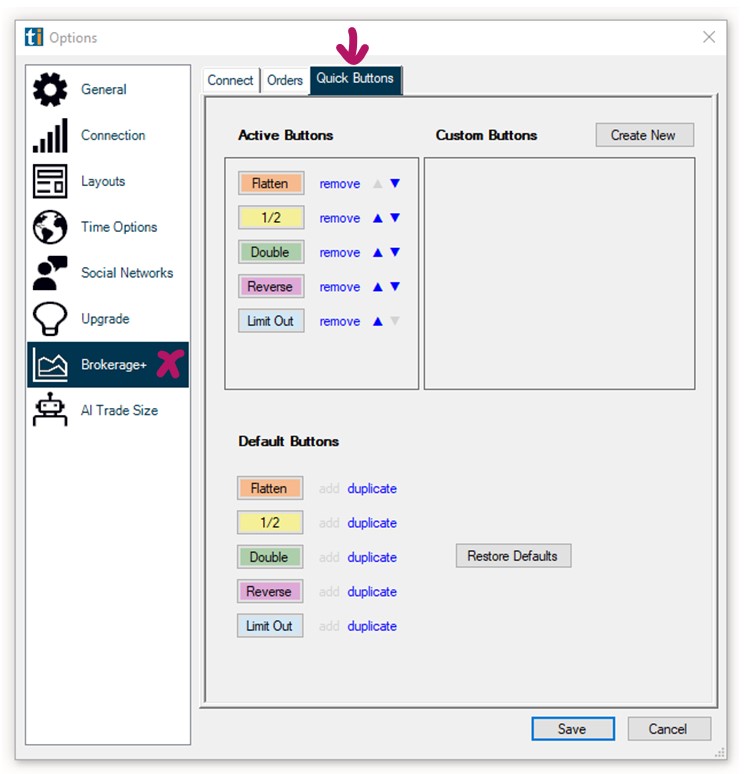
Default Quick Buttons
By default the following 5 Quick Buttons are available in the Positions Tab of Brokerage Plus.
To add/remove these Rapid Order Buttons from your Positions Tab, click on the Gear Icon in the bottom right-hand corner and check/uncheck the option Show Order Buttons.
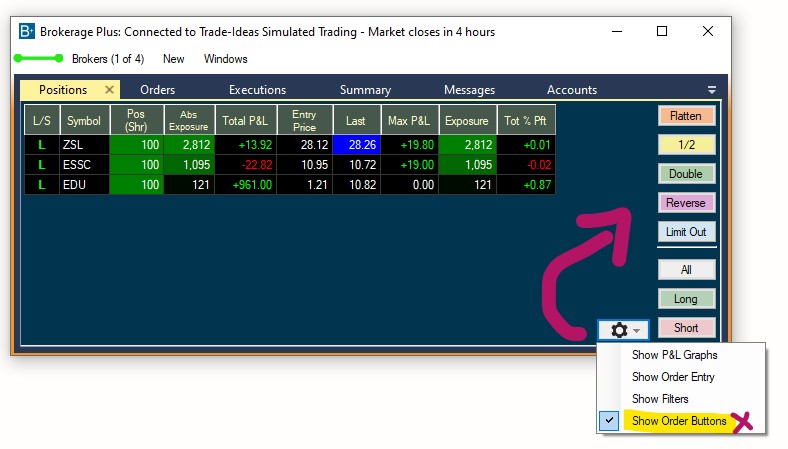
Flatten: Will exit the current positions by initiating a market order (only executable during market hours).
½: Will half the number of shares held by initiating a market order.
Double: Will double the number of shares held by initiating a market order.
Reverse: Will close the current long/short positions and enter into new short/long positions by initiating a market order, which is double in size to the current order but trading in the opposite direction.
Limit Out: Enables you to exit one or all of your trades at once whilst applying a Limit Offset to the price that the stock is currently trading at. Highlight the position you would like to exit, then add the Limit Offset that you would like to apply to the current Bid/Ask price of the stock.
All: Highlights all your positions at once.
Long: Highlights all your active Long positions at once. To highlight a single position, simply click on it.
Short: Highlights all your active Short positions at once. To highlight a single position, simply click on it.
Custom Quick Buttons
There can be a maximum of 5 Quick Buttons.
To add a custom Hotkey, you will need to delete a default Hotkey from the Active Buttons Field on the left-hand side by selecting Remove:
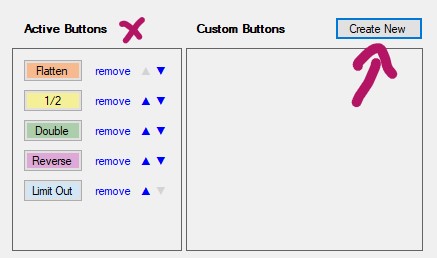
To create a new Quick Button, select Create New. This will open the Quick Button Create Window.
Example of Creating a Custom Quick Button for Trading
Button Attributes
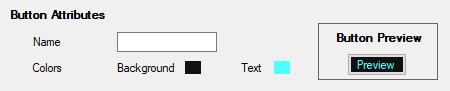
Give your button a Name and select a Background Color as well as a Text Color.
Order Setup
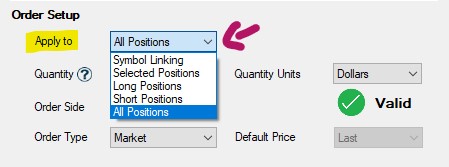
Apply to -> Symbol Linking: When this option is selected, the defined button action will be applied to the currently symbol-linked ticker, whenever this Quick Button is clicked.
The currently symbol-linked ticker will always display in the Manual Order Entry Panel as well, making it easy to detect.

Head here to learn more about Brokerage Plus Symbol Linking
Apply to -> Selected Positions: When this option is selected, the defined button action will be applied to all highlighted positions.
To highlight a position, click on it. To highlight multiple positions press the Ctrl key while selecting positions with your cursor.
A Quick Button will be greyed out, until a position is highlighted. Highlighting a position, will activate the button. Once pressed, the Hotkey Action will be applied to the selected position.
Apply to -> Long Positions: When the Quick Button is clicked, the Hotkey Action will be applied to all current short positions. When this option is selected, short positions don't require highlighting to be affected by this Quick Button.
Apply to -> Short Positions: When the Quick Button is clicked, the Hotkey Action will be applied to all current short positions. When this option is selected, short positions don't require highlighting to be affected by this Quick Button.
Apply to -> All Positions: When the Quick Button is clicked, the Hotkey Action will be applied to all current positions. When this option is selected, positions don't require highlighting to be affected by this Quick Button.
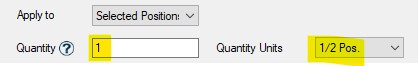
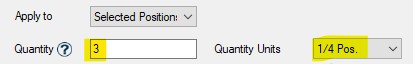
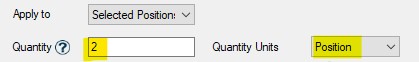
Quantity and Quantity Units
Enter the Quantity, e.g. 200 and the Quantity Units, e.g. Shares, Dollars, Position, 1/2 Position or 1/4 Position.
Example 1: You hold 100 shares of XYZ. If you enter 1 in the Quantity field and 1/2 Position in the Units Field, an order for 50 shares will be sent (100 shares/2)
Example 2: You hold 200 shares of XYZ. If you enter 3 in the Quantity field and 1/4 Position in the Units Field, an order for 150 shares will be sent 3 x (200 shares/4)
Example 3: You hold 500 shares of XYZ. If you enter 2 in the Quantity field and Position in the Units Field, an order for 1000 shares will be sent 2 x 500 shares
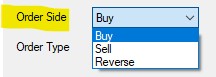
Order Side
Choose if a click on the Quick Button will Buy Shares, Sell Shares or take the opposite direction of the current position (reverse).
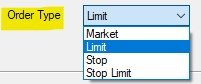
Order Type
Choose if your order will be submitted as a Market, Limit, Stop or Stop Limit.
Default Price
Choose which price your Quick Button Order will be based on by default. The presented options will depend on your selected Order Type (Market, Limit, Stop or Stop Limit).
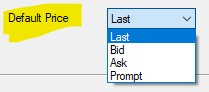
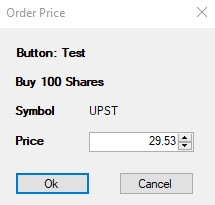
If Prompt is selected, an Order Price popup will open once the Quick Button is pressed, which will prompt you to enter the price ad-hoc.
Time in Force:

The Time in Force Field enables you to define when your submitted order will expire if not filled.
DAY: Order will remain open until today’s market close.
GTC (Good Till Cancelled): Order will remain open until you manually cancel it.
Custom: Select a custom time period in Seconds, Minutes, Hours or Days.
Fill During Extended Hours: When checked, orders can be submitted in premarket and postmarket via the Manual Order Entry Panel.
Time Stop: To add a Time Stop to your orders by default, enter a time in minutes and select if the time period will be calculated based on the Open or Close.
Example: If you entered 30 minutes and selected Before Close from the dropdown, your position would be exited via Time Stop at 3:30 pm Est today.

Example: If you entered 30 minutes and selected After Open in 3 Days from the dropdown, your position would be exited via Time Stop at 10:00 am Est. 3 days from now.

Risk Management:
To add a Stop Loss and/or Target (Bracket Order) to your orders by default, add a checkmark to either option and enter the Stop Loss/Target amount per share in either dollar or percent.
Example: If you entered 0.50 as your Stop Loss Offset amount and selected $ from the dropdown, a Stop Loss of 50 cents would be submitted together with your entry order.
Example: If you entered 3 as your Target Offset amount and selected % from the dropdown, a Target Order would be placed in 3% distance from the Entry Order price.
AI Trade Size
By Default, the Risk Size for all Holly AI trades and calculations is set to 100 shares per trade. This setting can be adjusted to reflect your personal investment style.
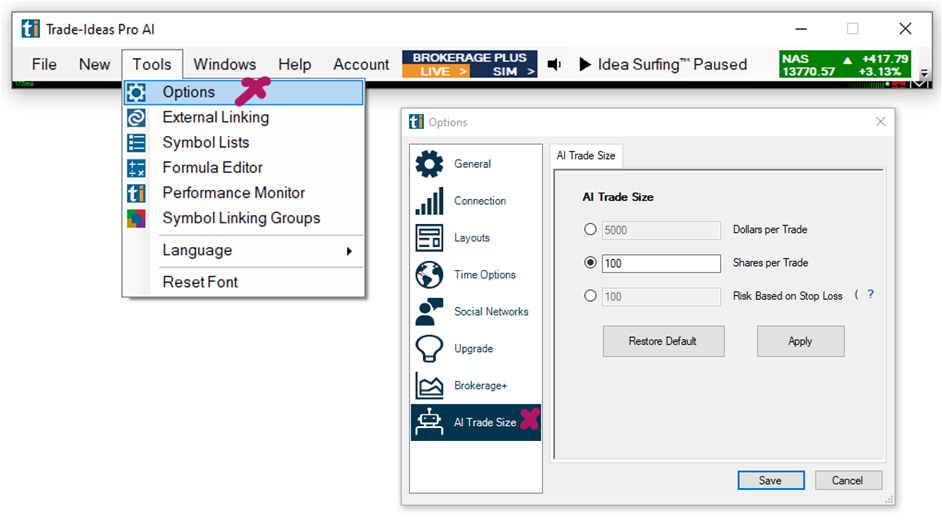
You have the choice between defining Holly’s entry parameters based on Dollars per Trade, Shares per Trade, or a Risk based on Stop Loss.
-
Dollars
If you entered $2000 as the amount and the stock price is $20, Holly will buy 100 shares. If the stock price is $40, she will only buy 50 shares.
-
Shares
You can enter a fixed number of Shares per trade to buy or short.
-
Risk
If you choose to risk $100 and Holly’s algorithmic stop loss per trade is $0,20, she will buy 500 shares per trade.
-
Default
By Default, the AI Profit & Loss is based on 100 shares per trade.
These settings will be used to calculate the Profit & Loss in the AI Trades Window and the AI Strategy Trades Window
Charts
Picture in Picture Browser Charts
Our HTML Charts with advanced annotation tools and picture-in-picture charting are now loading as default charts.
You can control which chart type, our Legacy Charts or the HTML Charts, are loading by default.
To adjust the default settings, go to the Toolbar, open the Tools Tab, select Options and then Charts.
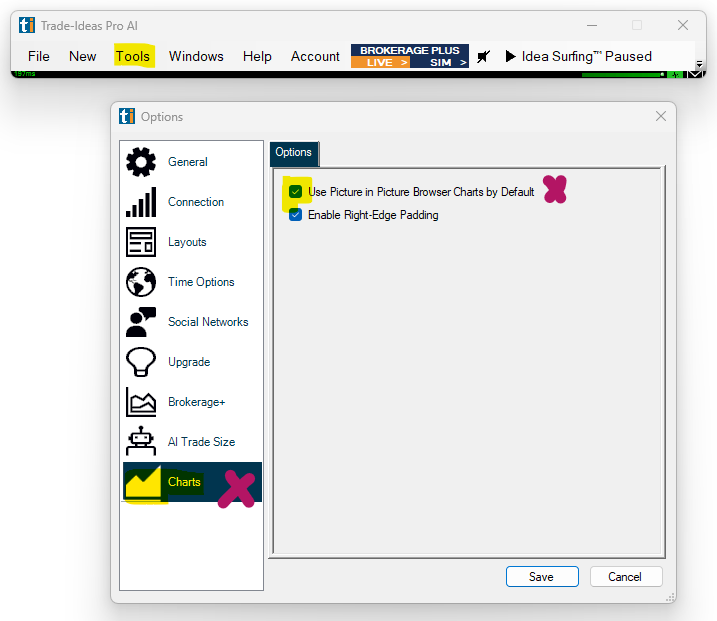
To make our legacy charts the default, remove the check-mark from Use Picture in Picture Browser Charts by Default
To use the Picture in Picture Browser Charts, also known as PiP-Charts, no action needs to be taken.
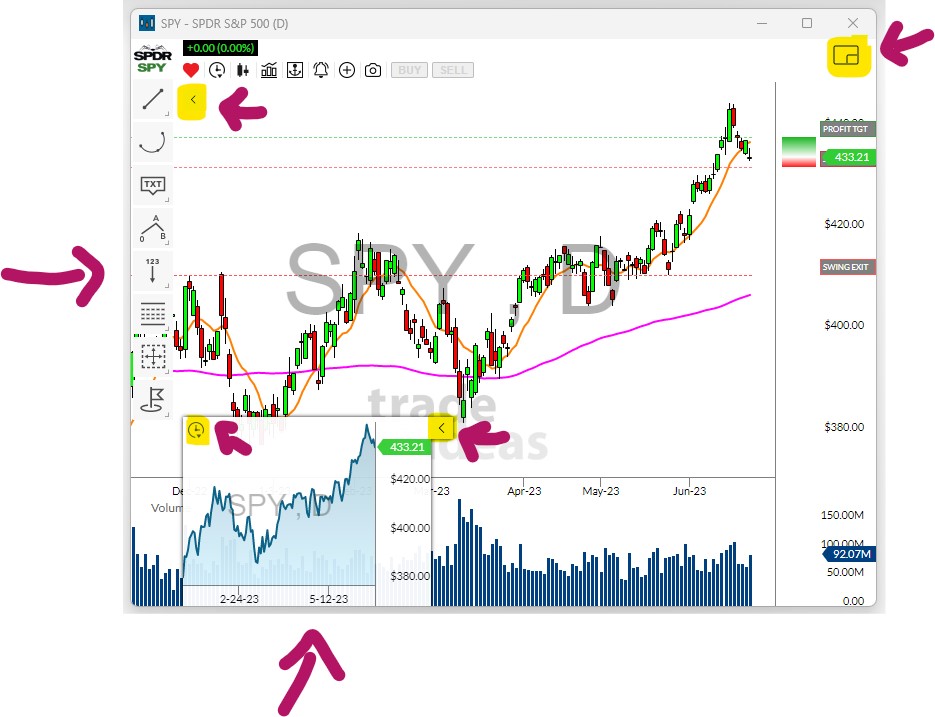
Enable Right-Edge Padding
Our Charts now contain right-edge padding by default.
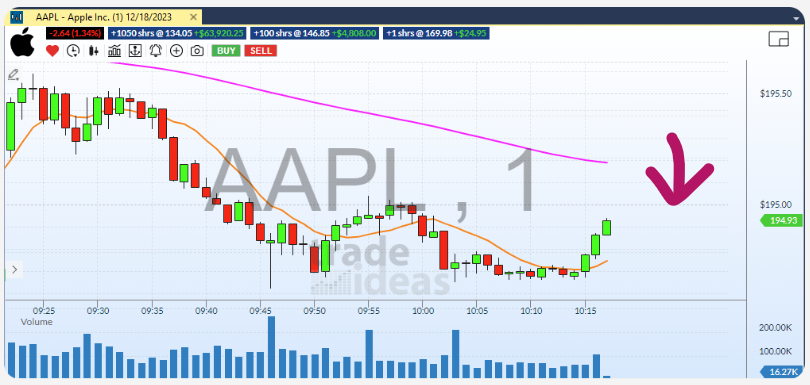
To disable this feature, deselect this option here.
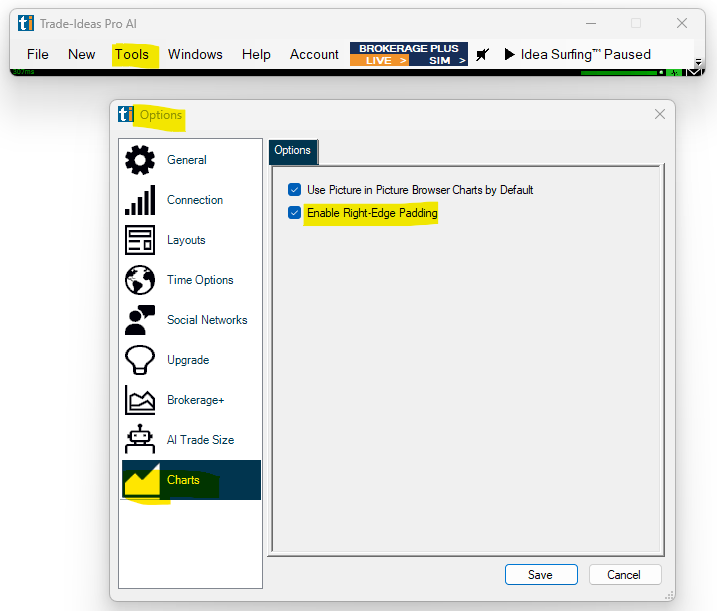
External Linking
Our External Linking Feature enables you to sync an external platform like your brokerage or charting app, with Trade Ideas. With External Linking enabled, every symbol you click on in Trade Ideas will automatically load in the other platform’s order entry, chart, or similar target field.
For Symbol Linking to work, it is crucial that you start Trade Ideas as well as the other platform in Admin Mode. To do so, right-click the Trade Ideas Desktop Icon and select Run as Administrator. Do exactly the same with the target platform.
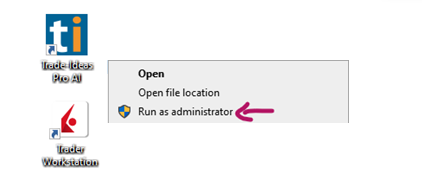
Next, head to the Toolbar, open the Tools Tab and select External Linking. Click Add Link in the External Linking Window and follow the Add External Linking Instructions in the next window precisely. Move your mouse to the target field (e.g. order entry field, chart symbol field) of your other platform and hover over it without clicking. Whilst hovering your cursor over the target field, press the Shift key of your keyboard.
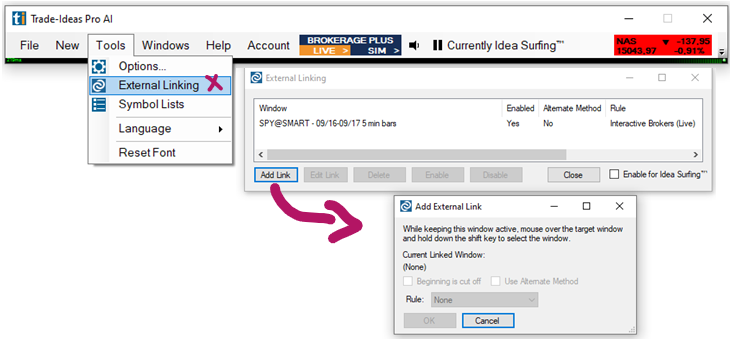
If you click, instead of just hovering, the Add External Link Window will turn pink. To return its focus, click on it, then hover over the target field and press the Shift key of your keyboard.
Make sure that there is no overlapping between Trade Ideas windows and your target windows while creating the linking. To receive focus, the target needs to be on top.
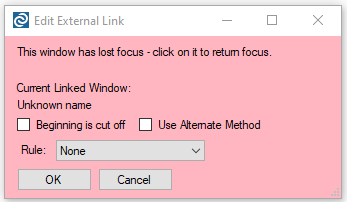
Once the link has been established the window will list it as the Current Linked Window. Depending on the platform you are linking to, you can select the corresponding linking rule from the dropdown which contains RegEx expressions, which are character translation rules. If no rule is available for your platform, select None. This is the most generic form of linking.
Generally, you can leave the checkbox Beginning is cut off and the checkbox Use Alternate Method unchecked.
The function Beginning is cut off, will insert a brief pause before the symbol is sent, which helps when the timing of the link populating between the platforms is an issue.
Adding the Use Alternate Method checkbox in the Add External Link window sends the entire symbol in All Caps followed by a carriage return, which forces the target to accept the symbol as a complete symbol. This can help to circumvent the autocomplete of symbols that some platforms utilize.
Once the linking is established, press Close or Add Link to create another external link. You can also Edit or Delete the Link as well as temporarily Disable and later Enable it. If you check the option Enable for Idea Surfing. The target field will be included in the 7-second cycling through the top 3 symbols of all open Top Lists as well as the Holly Strategy Trades Window and the Price Alerts Window. The different symbols will then be displayed in your externally linked chart or other target field.
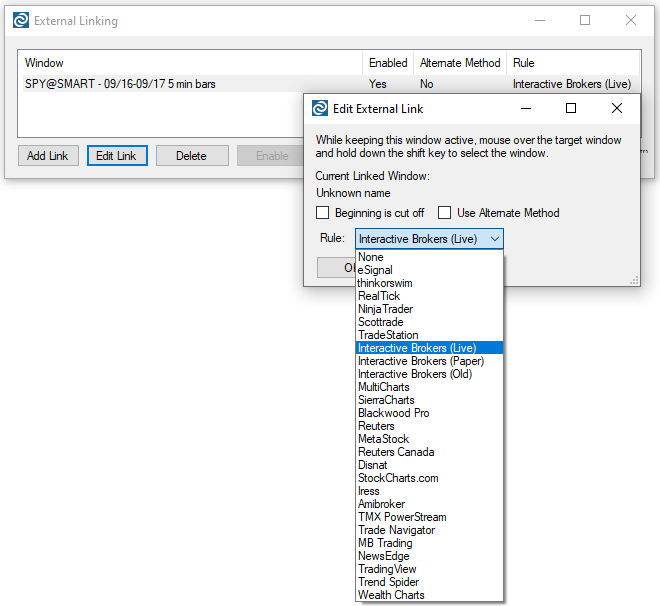
Once the external link has been established, you might need to click into the target field for it to start working.
Some platforms lose focus easily which makes External Linking more difficult. The only way to bring the target platform back to focus is to click into the target field to force it to pay attention.
If the External Linking seems inconsistent, go to the Toolbar, select Options, and then General. Here, go to Integration Support and select Double-click on an Alert. This will provide a stronger signal to the External Linking Feature.
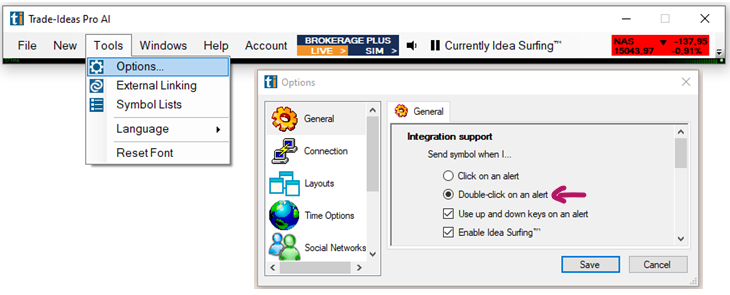
Once you have successfully built the linking, always follow this process to ensure that the linking setup will remain after a restart. Always close Trade ideas first, then close the target platform. This way, your default layout saves the linking setup on exit.
Always open the Target Platform first, then start up Trade Ideas. The Linking target must be open and available to receive links when Trade Ideas opens, otherwise, the linking setup will be discarded.
Running the programs as Administrator is only required while you are building the external links as that is what grants the programs access to the Background System Variable that is used to transfer the symbol to the Target program. After the links have been established you can run the programs in normal mode.
You can link to more than one platform simultaneously, the same symbol will always be sent to all the linked platforms.
How to externally link to ToS:
How to externally link to Tradingview:
How to externally link to TradeStation:
Symbol Lists
The Symbol List feature allows you to include or exclude certain stock symbols from your scans.
Create a new symbol list
The software offers two places to create a new Symbol List, you can go to the Toolbar, select Tools, and then Symbol Lists or create a Symbol List via right-click directly in the Symbol Lists Tab of the Config Window of your scan.
To Create a new Symbol List, go to the Toolbar, select Tools, and then Symbol Lists.
The field on the top left-hand side of the new window displays all the already existing Symbol Lists and the number of symbols they contain.
To create a new Symbol List, select Create New List on the bottom right-hand side.
Give your new list a name, then click OK.
Your newly created list will now appear in the Symbol List field.
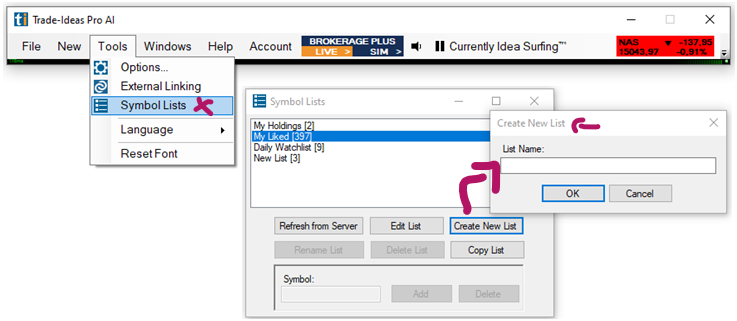
Add single symbols to one or multiple Symbol List(s)
To quickly add or delete a single symbol, highlight the Symbol List, then enter the ticker in the Symbol Field in upper or lower case and click Add or Delete. The symbol will now be added to or removed from all the currently highlighted lists. The program will automatically remove duplicate symbols during addition and ignore any removal request if the symbol does not exist in the symbol list.
To select more than one list at once, press the control key on your keyboard while selecting the lists with your mouse.
Add multiple symbols to a Symbol List
To add multiple symbols to your newly created Symbol List, double-click on your list to open it.
This will take you to another window where you can enter the stock symbols. There is no limit to the number of symbols you can add to a symbol list. The program automatically will convert the symbols to the upper case, remove duplicates and sort the list alphabetically.
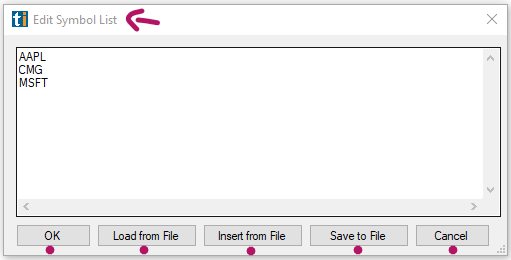
Typing
You can enter stocks manually by typing.
Copy & Paste
You can copy & paste symbols from any document. The symbols should be added one line per symbol, in upper or lower case.
You can also copy & paste selected symbols or entire symbol columns from your scans. To do this, first go to the Toolbar, select Tools, Options, and then General. Here, uncheck Highlight grid row upon selection.
By default, the entire row is highlighted when you select a column in the scan. Unchecking this option will enable you to highlight individual columns.
Now, go to your scan and highlight the symbols you would like to add to your Symbol List.
Thereafter, copy the data by using the Windows copy command, pressing the Control and C keys on your keyboard.
Now, go back to your newly created Symbol List and paste the symbols into it using the Windows paste command, pressing the Control and V keys on your keyboard.
Upload from File
In addition to manually adding stock symbols, you also have the option to upload a text file from your local PC by choosing Load from File. Please note, that this will overwrite any already added symbols.
If you would like to upload additional symbols to an already existing Symbol List, choose the option Insert From File instead.
Download Symbol List to PC
To save a copy of your Symbol list to your local PC, select the Save to File option.
Once you have added your symbols, hit OK.
Edit, Copy, Rename or Delete a Symbol List
To edit a Symbol List, select the Edit List button, which will bring you back to the symbol entry window.
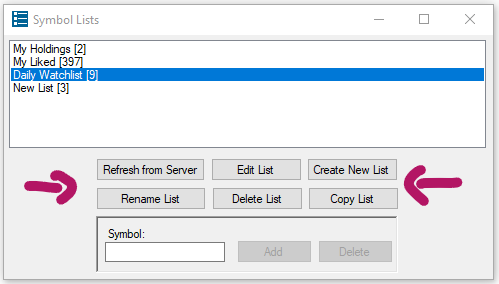
To copy a Symbol List, select the Copy List button. Type the name of the new symbol list and press the OK to copy the list and populate it with the symbols from the currently selected lists.
To rename the list, highlight it and select the Rename List button.
To delete a list, highlight it and select the Delete List button.
The Refresh from Server button is used to clear the cache and reload it with the symbol lists from the server. This operation is automatically performed upon application startup. Select this option to ensure syncing, whenever you have made changes to your symbol lists.
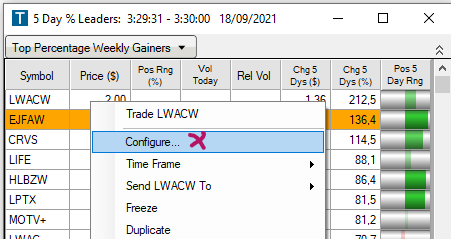
Include or Exclude Symbol Lists from Scans
Now that we have our symbol list, we can go into our scan, to include or exclude the symbols it contains.
Right-click into your scan and select Configure.
Now, open the Symbol Lists Tab.
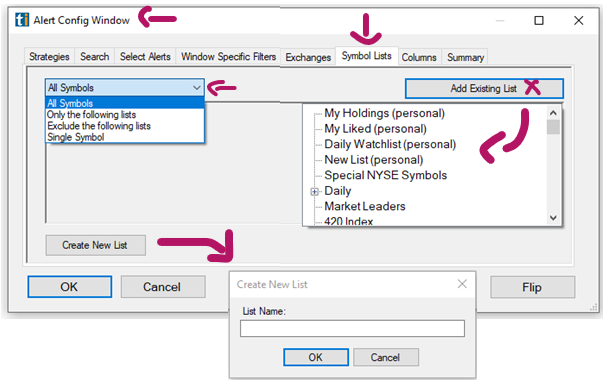
The newly created Symbol List will show up in the Drop-Down Menu of the Add Existing List Tab, located on the right side.
The Add Existing List dropdown not only displays your newly created Symbol Lists but a large variety of additional preconfigured Symbol Lists that we have created for our users. Of particular interest to many traders are symbol lists that include or exclude recent IPOs, ETFs, Warrants, or entire sectors.
Any already activated lists will be displayed in a different color.
Simply click on any Symbol List to add it to the section on the left-hand side.
Once you have selected all the symbol lists you would like to include or exclude, make a selection from the dropdown on the left-hand side.
By default, your scan is set to monitor All Symbols.
From the dropdown, you can select to show Only the following lists and check the symbol lists you would like to point your scan at below.
Alternatively, you can choose to Exclude the following lists and check the symbol lists you would like to exclude from your scan below.
You can also choose to only monitor a Single Symbol with your scan. To do so, select Single Symbol from the dropdown and enter the ticker in the field below.
To remove a Symbol list from the selection field, right-click on it and select Remove from this List.
The Config Window of your scan also gives you the option to Create a New List. The process is the same as described above.
Once you have made your selection, hit OK.
Then select OK one more time to save your changes and close the Config Window of your scan.
Add Symbols via the Send To Feature
To add more symbols to any of your existing symbol lists on the fly from any of your scans, just right-click into the scan, choose Send to and Symbol Lists. Thereafter, select a specific symbol list from the dropdown.
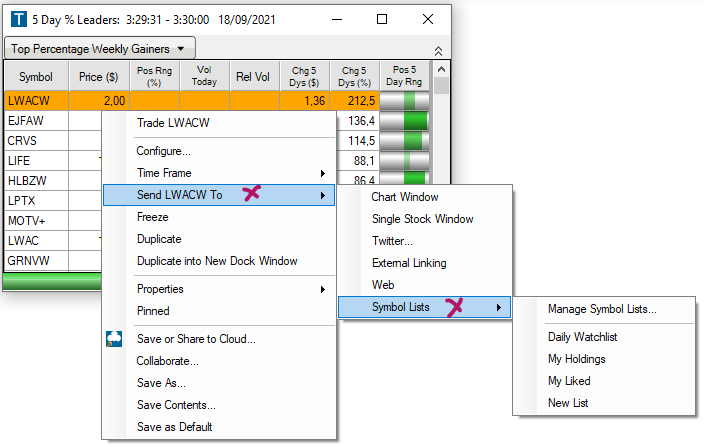
If you have recently sent a symbol to any of the lists, it will be bold. To remove this visual highlight, select Clear Recent List and click Yes.
To create an entirely new Symbol list, select the option Manage Symbol Lists from the dropdown. This will bring you to the main Symbol List Configuration Menu where you can create, edit, copy, rename and delete Symbol Lists.
In addition to accessing your Symbol Lists from within our software, you can also find them on your Account Management Page, on our Website. Here, you can also edit, delete or create entirely new symbol lists.
Formula Editor
The Formula Editor enables our users to create custom filters based on the data points that are available in our system.
Each created custom filter will be saved to your cloud and be specific to your account. Custom filters have their own icons, ranging from U0 - U99, and can be used in your scans just like the built-in filters.
The Formula Editor offers access to data points that aren't available as preset filters, but it isn’t a code compiler, meaning you are limited to the data points listed in the custom filter documentation here and here.
The true power of the formula editor lies in its capacity to mix and match different data points in an almost infinite number of ways.
Our preset filters, for example, work in an AND-fashion, meaning all filter criteria have to be satisfied for a stock to show up in your scan. By using the formula editor, you can combine filters in an OR-way. This is just one of the many advantages of the formula editor.
Please note that you can only create custom filters, alerts cannot be customized.
To access the Formula Editor, go to the Toolbar, open the Tools Tab, and select Formula Editor.
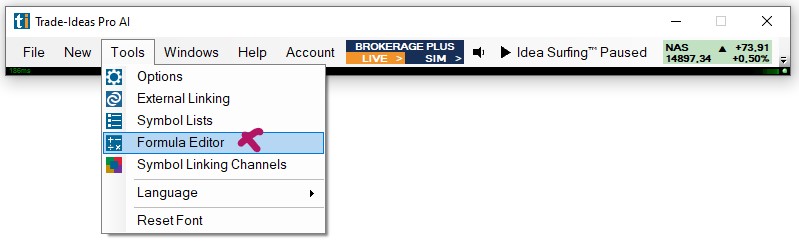
This will bring up the Formula Editor Window.
The Load dropdown contains all your already created custom filters.
Once a custom filter has been selected from the dropdown, the Source field below will display the underlying formula.
You can edit the custom formula in the Source field.
The code checker will automatically analyze your input and inform you of any errors in the Status Line below the Source field. In addition to that, it will inform you in which Trade Ideas windows your custom filter can be used.
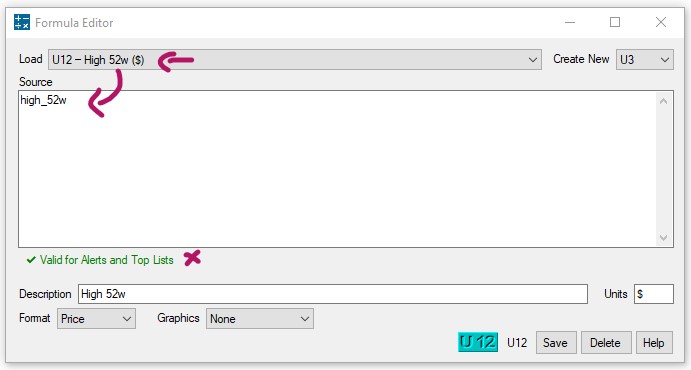
Some formulas are not available in Top Lists. Alerts, for example, have a “Quality” field that Top Lists don’t have. If your formula references the quality field, it will not be available in a Top List Window.
To create a new custom filter, select an available U-designation from the Create New dropdown and enter your formula in the Source field.
The U selection must be unique. If you create two formulas with the same icon, the second formula will overwrite the first one.
The standard C operators, Boolean expressions and if-statements, can be used to create your custom formulas. But, the Formula Editor isn’t a code compiler, meaning you are limited to the data points listed in the custom filter documentation.
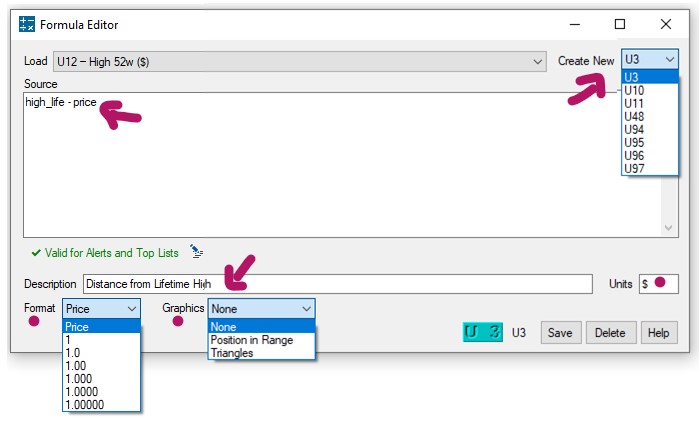
Give your custom filter a descriptive name in the Description field or edit an already given one.
Enter the filter output ( $, %, ratio, etc.) in the Unit field on the right-hand side of the Description field.
Select the filter format from the Format dropdown.
1 rounds to the nearest integer. 1.00 displays 2 digits after the decimal and so on. Price tells the software to automatically pick an appropriate format based on the stock’s price.
Selecting a Graphics display is optional. The default is set to None, but if you create a custom filter that can be graphically displayed, you have the option to select either Position in Range or Triangles/Cone as accompanying Graphics from the Graphics dropdown.
Typically you can see the numerical value of the formula as a tooltip when displaying the value graphically.
To get more details about any of the available data points enter them in the Source field, then press Help. This will load the Formula Editor Help Window.
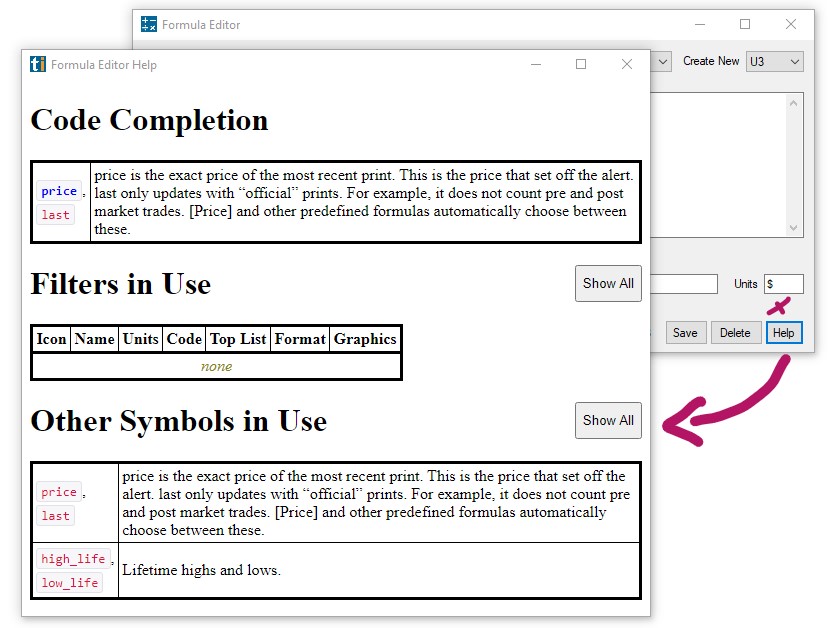
Confirm your custom filter edit or creation by pressing Save. Your newly created custom filter will now appear in the Load dropdown. It can be added to your scan via the Search Tab of your Config Window.
If you have edited the formula of an icon, the change will automatically be applied to all strategies that use the icon.
To remove an existing custom filter, select it from the dropdown, then press Delete.
To use your newly created custom filter in an Alert or Top List Window, right-click into it, and select Configure.
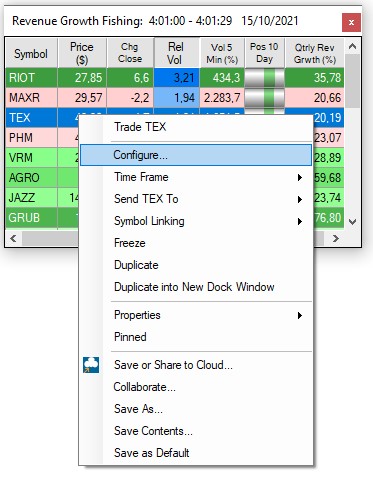
Now, open the Search Tab and enter the name of your custom filter into the Search field to find and select it from the list of available filters and alerts.
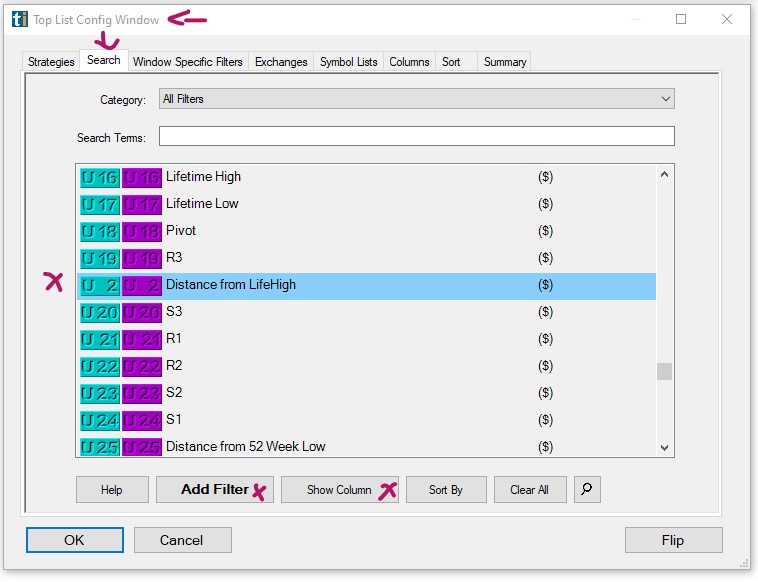
Another way to access, edit and create personal custom formulas is the Custom Formula section on your Accounts Management page on our website.
This Custom Formula section lists all your personal custom filters.
You can edit or delete any of your custom filters by pressing the edit or delete button to the right of a filter.
Below the list, you will have the option to create a new custom filter.
The editing and creation process is the same as described above.
The Help PDF explains the functionality of the Formula Editor and lists some of the available data points.
The section Filter Codes for Custom Formulas lists most of the available data points that you can include in custom filters.
Performance Monitor
The Performance Monitor will provide valuable insight into the performance and health of the app as well as the overall system. It acts as an early warning system and is a valuable troubleshooting tool, especially when it comes to system performance issues.
The Performance Monitor will change colors depending on how hard your system is working in order to keep up with the workload.
When everything is running as it should, the Preformance Monitor icon in the Status Bar will be green.
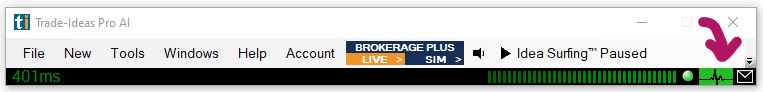
Yellow is marginal, and Red indicates a risk of decreased performance. In other words, too many active windows. The threshold for these settings will improve over time.
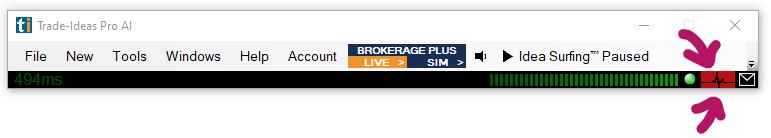
A double click on the icon will open the Performance Monitor window which will provide further details.
The Performance Monitor can also be accessed from the Tools Tab of the Toolbar.
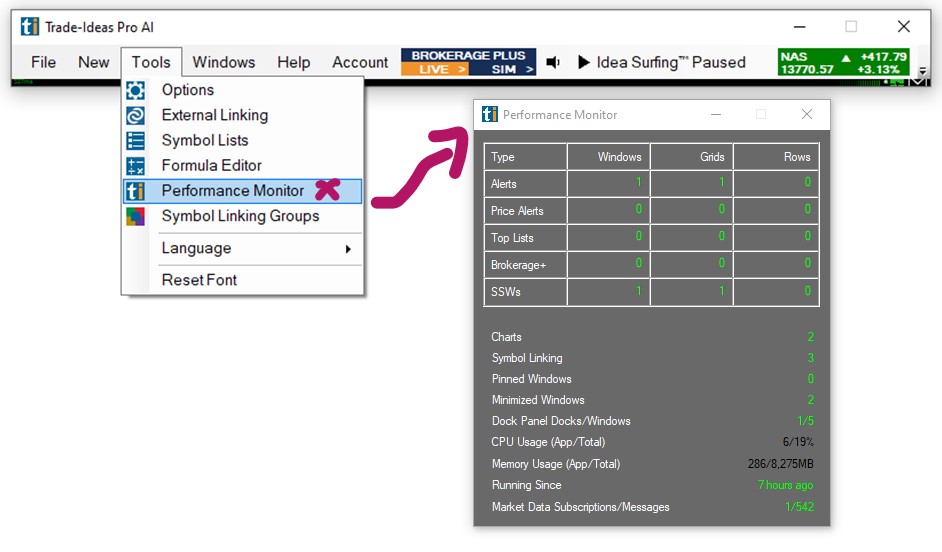
It provides an overview of the number and types of windows that are running as well as your overall system performance (e.g. CPU Usage and Memory Usage).
Any item that could be cause for concern will be displayed in red.
Symbol Linking Groups
Most Trade Idea Windows, including Alert, Top List, Multi-Strategy, and Compare Count Windows as well as the Holly AI Windows, RBI, GBI, and Price Alerts can be symbol-linked to a Chart or Single Stock Window.
This means that when changing your windows stock symbol, your symbol-linked Chart or Single Stock Window will automatically change as well, and display the specific stock’s data.
To establish a Linking Group for a number of windows at once, go to the Toolbar, open the Tools Tab, and select, Symbol Linking Groups.

The next window will display all the Trade Ideas windows currently in use.
By default, each free-floating window is assigned to the blue, Link to All, Linking Group.
By default, each docked window is assigned to the pink, Dock Window, Linking Group.
In Pink Mode only the menu items contained in the indiviual dock respond to symbol changes.

To establish a new Linking Group, select the windows that will be part of the new Linking Group by adding a checkmark.
You can select all windows at once by choosing, Select All, at the bottom.

You can clear your selection by selecting, Clear Selected, at the bottom.
Once you have selected the windows, open the Link Groups dropdown in the top left-hand corner. Select a color for your new Linking Group, then choose, Set All Selected, to assign the windows.

All the selected windows will now display the color of the Linking Group you have assigned them to.
To see all windows that are assigned to a specific Linking Group, choose the Group Color from the Link Groups dropdown, then select Filter By. To see all available windows, select, Clear Filter.

Once you have assigned the windows, select Close.
All windows will always display the Color Group they belong to in the top left-hand corner:

Any Single Stock Window or Chart that has been assigned to the same Color Group will update accordingly, whenever you change a stock symbol in one of the other Color Group's windows.
In addition to creating Linking Groups via the Tools Tab of the Toolbar, you can also assign windows to a specific Color Group individually.
To do so, right-click into your window, select Symbol Linking, and choose a color from the dropdown. The selected window will now display the Color Group in the top left-hand corner.

Next, right-click into your Single Stock Window and select Symbol Linking.
Add a Checkmark to the left-hand side of the Symbol Linking option, then select a Color Group from the Symbol Linking dropdown.

Your Single Stock Window will now be linked to all the windows that belong to the same Color Group and update accordingly whenever you change the stock symbol in one of these windows.
Follow the same process with your Chart, right-click into it, select Properties, and then Symbol Linking. Now, add a Checkmark to the left-hand side of the Symbol Linking option. Thereafter, choose a Color Group.
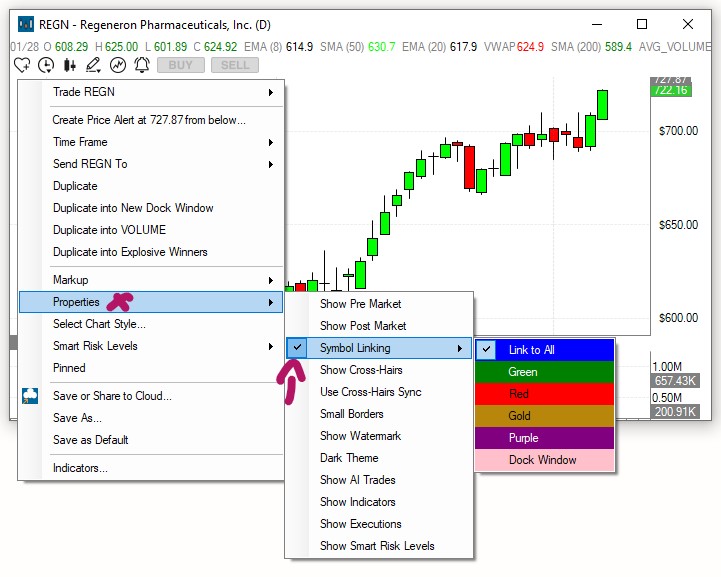
Please note, that even when a Single Stock Window and Chart have been assigned to a specific color group, they will always also be linked to the Blue Color Group since this is the default Link to All Group. This means in turn that any window that is assigned to the blue linking group will be linked to all open Single Stock Windows and Charts.
Reset Font
You can customize the look and feel of our program by selecting your preferred font size. From the Toolbar select Tools, Options, General. Here, you can choose from a variety of fonts, increase or decrease the font size or make it bold.
If you are unhappy with your font settings, just go to Tools Tab of the Toolbar and choose Reset Font from the dropdown to restore the default.
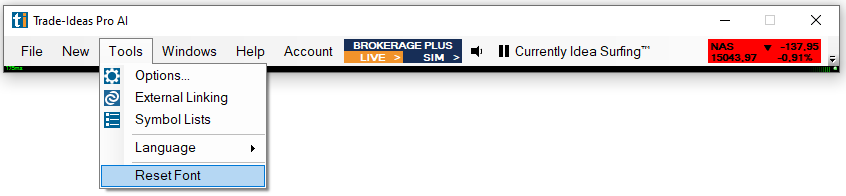
Windows Tab
For greatest flexibility and usability, all layout items are freely movable and resizable, enabling you to create your preferred layout using multiple screens.
You can control the behavior of the layout items via the Windows Tab of the Toolbar by selecting one of the following options:
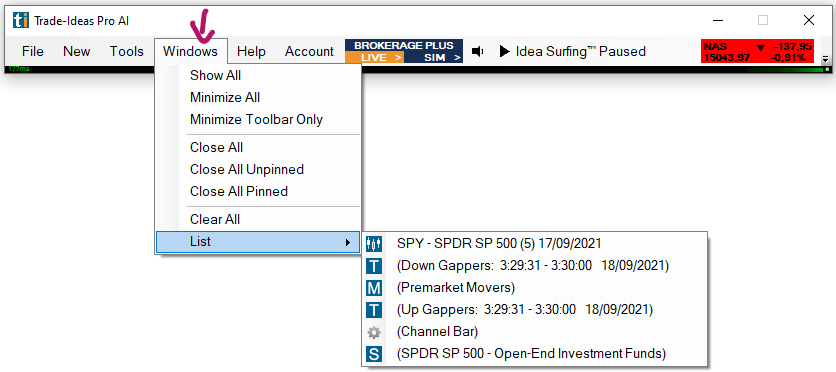
-
Show All: Will bring all Windows back up if they have been minimized
-
Minimize All: Will minimize all Windows
-
Minimize Toolbar Only: Will minimize the Toolbar but keep the Windows open
-
Close All: Will close all Windows but not the Toolbar
-
Close All Unpinned: Will close all Unpinned Windows
-
Close All Pinned: Will close all pinned Windows
-
Clear All: Will clear the results of all open Alert, Compare Count and RBI/GBI Windows.
-
List: Will show all your individual layout items for easy retrieval
The Pinned Function:
Help Tab
The Help Tab provides access to our User Guide, our Alerts & Filters Definition page, our Channel Bar Descriptions page and various other information pages.
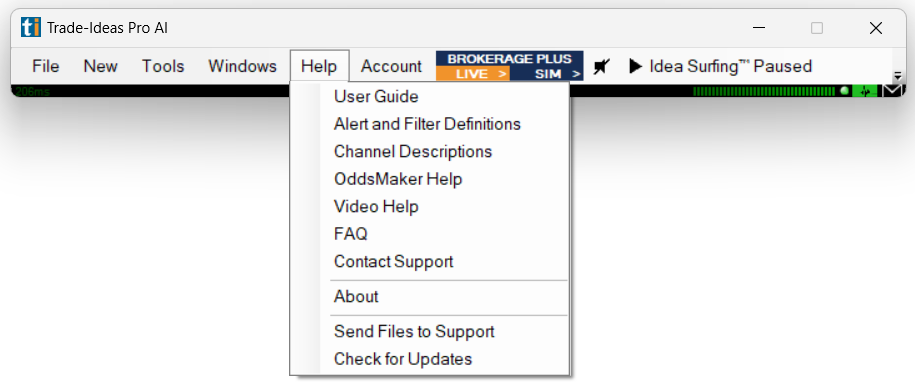
About
The About Section will provide info about which version of our software you are running.
Send Files to Support
For easier troubleshooting you might be asked to send your files to support. To do so, simply select Send Files to Support, then select Yes to confirm.
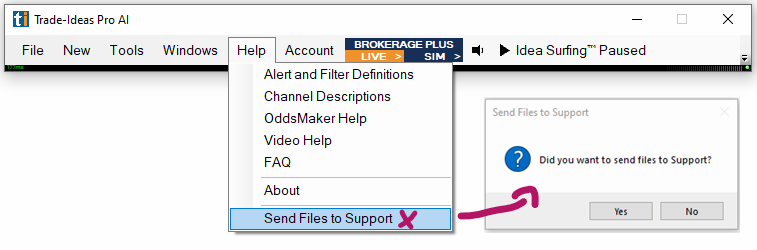
Account Tab
The Account Tab displays information about your connection status as well as your account.
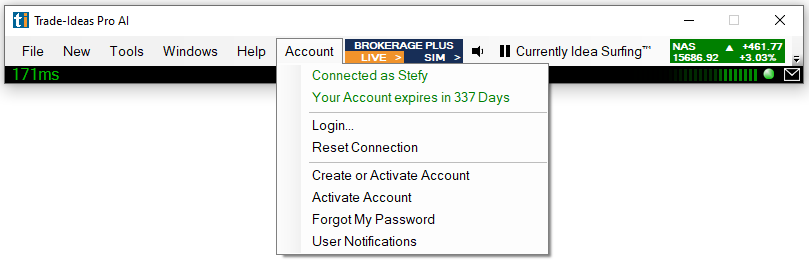
Connected as
Green writing indicates that you’ve successfully logged in with your exact username and password and are connected. Your exact username and the expiration date of your subscription will be stated in green.
You can install the program on as many devices as you like, but you can only run one instance at a time. If you’re logged in on another device, the Accounts Tab will display Another user connected as username XYZ. In this case, select Reset Connection from the dropdown. This action will log you out of any other instances and connect the current device.
Login
To log in, select Login from the dropdown, then enter your exact username and password in the popup login form. Please note that our system is case-sensitive. You will only be able to successfully log in when using your username and password in the exact case you used when creating your account.
Some devices capitalize the first letter automatically, which will lead to a login error indicated by the red Status bar. If your Account Tab contains red writing, which indicates an incorrect username or password, uncheck the Save Username and Password box and type your login credentials by hand since your browser might have saved an incorrectly entered username or password for the auto-login.
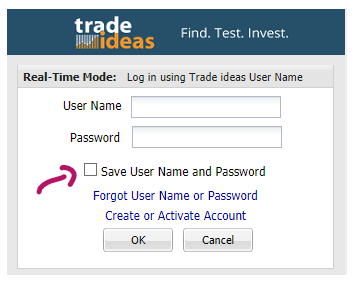
Reset Connection
You can install the program on as many devices as you like, but you can only run one instance at a time.
If you’re logged in on another device, the Accounts Tab will display Another user connected as username XYZ. In this case, select Reset Connection from the dropdown. This action will log you out of any other instances and connect the current device.
A connection reset, which results in a switch of the data server is also a good first step to resolve chart lag or windows not loading.
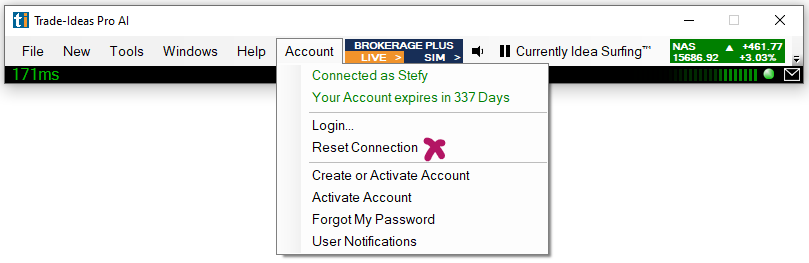
Create or Activate Account
To create a new account or activate a deactivated account, select the Create or Activate Account option. This will lead you to the Account Management page on our website.
Forgot my Password
To reset your password select Forgot My Password or follow this link. Alternatively, contact our friendly support team at info@trade-ideas.com to request a password reset.
User Notifications
Selecting User Notifications from the Account Tab dropdown or clicking the Envelope icon located to the right-hand side of the Connection Status Bar will open a window displaying Trade Ideas Notifications regarding Status Changes or System Events.
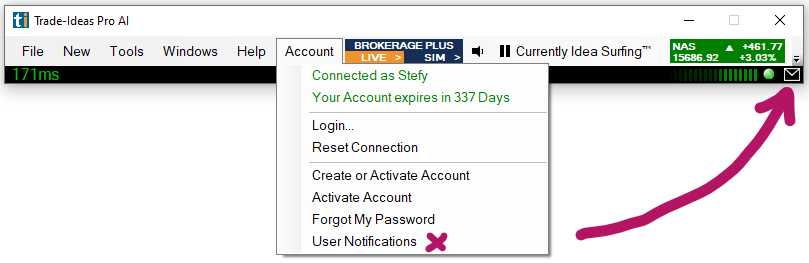
Brokerage Plus Toolbar
The Brokerage Plus Module is the control center for all your orders and positions. It connects to participating brokers, enabling you to execute trades directly within Trade Ideas via one-click order entry from charts and scanners. In addition to that, it enables you to automate your own strategies. It also provides access to a real-time simulator, in which you can test your strategies or learn trading before going live.
To load the Brokerage Plus Module click on the Brokerage Plus Live or Brokerage Plus Sim button located in the Toolbar. If you select Brokerage Plus Sim, a connection to our in-house Trade Ideas Simulator will automatically be established. To connect to an account at a participating brokerage further steps have to be taken.
For detailed info jump to the Brokerage Plus section.
Sound Toggle
The sound icon located in the Toolbar enables you to temporarily disable all program sounds. This is particularly useful if your scans are set up to use Sound Notifications and you would like to just temporarily turn off all sounds.
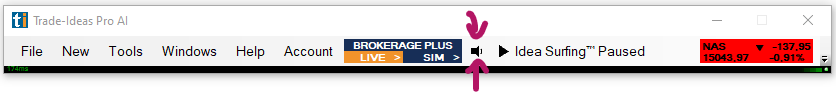
Idea Surfing Toggle
Idea surfing was created as a passive way to look at stocks. When active it will automatically cycle through the top 3 symbols of all open Top Lists as well as the Holly Strategy Trades Window and the Price Alerts Window in a 7-second rhythm and display them on your charts. It pauses, whenever you click on a symbol in any scan or place your mouse cursor into the chart. Idea Surfing is useful if you are occupied with something else but still want to watch the market from the sidelines.
It can be enabled in the Toolbar. To fully disable this feature, go to the Tools Tab of the Toolbar, select Options, then General, and uncheck Enable Idea Surfing.
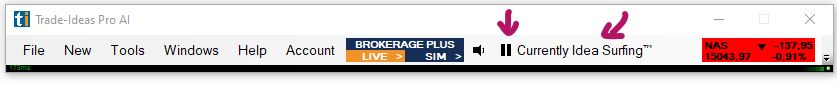
Connection Status Bar
The Status Bar provides details about your connection status and the data transfer speed (ping speed measured in milliseconds).
A green Status Bar indicates that you’ve successfully logged in and are connected. Your exact username and the expiration date of your subscription will be stated in green.
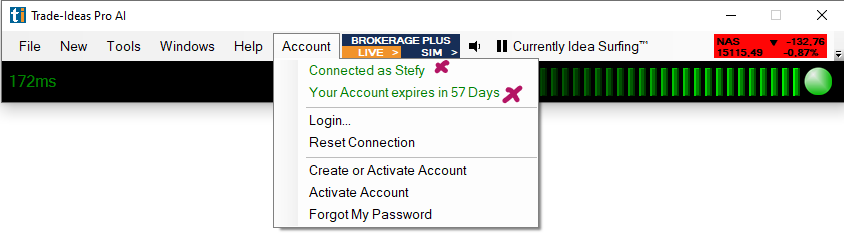
A yellow Status Bar indicates a network issue.
In case you are on a controlled network (Firewall, Hotspot, Antivirus software, hotel), go to the Toolbar, open the Tools Tab, select Options, then Connection, and change the connection type to New HTTPS mode.
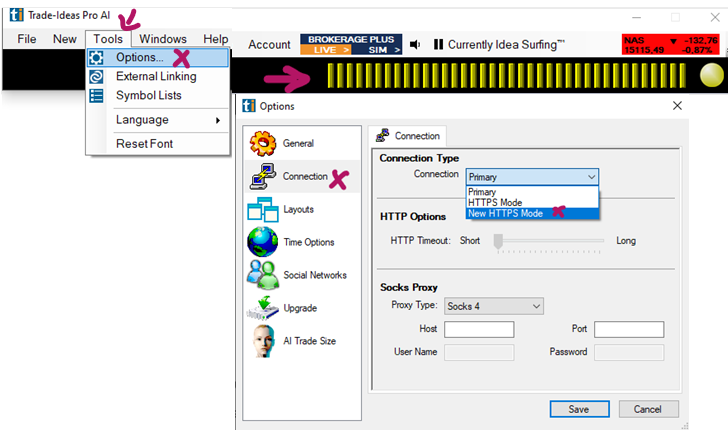
A red Status Bar indicates a login issue (e.g. wrong username/password, being logged into the software on another device).
Our login form is case-sensitive. Username and password need to be entered in their exact case. Some devices capitalize the first letter automatically, which will lead to a login error indicated by the red Status bar.
You can install the program on as many devices as you like, but you can only run one instance at a time. If you’re logged in on another device, the Accounts Tab will display Another user connected as username XYZ. In this case, select Reset Connection from the dropdown. This action will log you out of any other instances and connect the current device.
To reset your password, follow this link or go to the Toolbar, open the Accounts Tab, and select Forgot My Password. Alternatively, contact our friendly support team at info@trade-ideas.com to request a password reset.
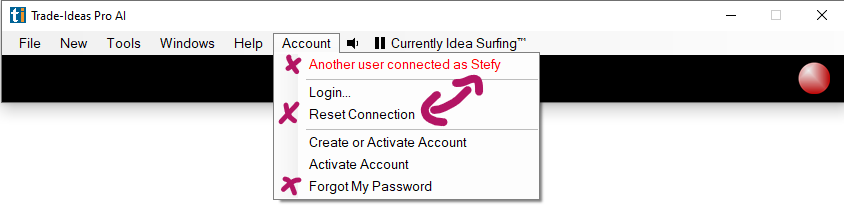
If your Status Bar is red and indicates an incorrect username or password, uncheck the Save Username and Password box and type your login credentials by hand since your browser might have saved an incorrectly entered username or password for the auto-login.
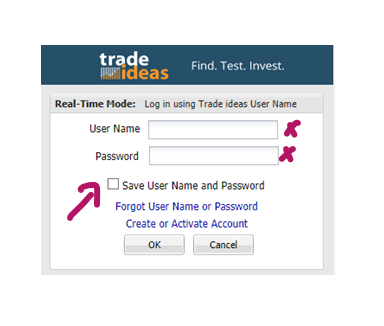
Market Indices
Above the Status Bar, you will see a snapshot of the indices SPX, DJI, and NAS which helps to determine the overall market sentiment.
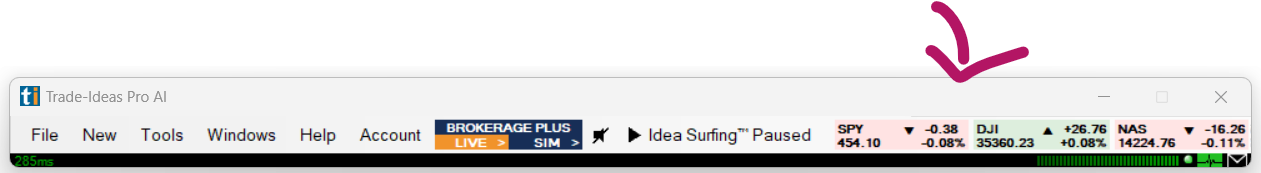
Alert Window
Alert Windows are one of the main components of the Trade Ideas program. They monitor and stream events in real-time based on customizable parameters. New events appear as line items in the alert window. You can add graphically rich columns and sound alerts to enhance and structure the data. Each Alert window is marked with an “A” on the top left-hand side of the window. There can be any number of Alert Windows.
All Trade Ideas Windows can be configured via the right-click Menu. If you right-click into the window, you will see a menu with multiple options pop up.
Have a look at the following tutorials to learn more about each menu function.
Trade XYZ
You can trade stocks right from your scans and charts via our One-Click Order Feature. Simply right-click into the scan or chart and select Trade to bring up a dropdown menu with preconfigured order templates.
How to create a custom Order Entry Template:
Config Window
The Configuration Window enables you to adjust the settings and control the data that populates inside your scanner.
To open the Config Window, right-click into the scan and select Configure. The main configuration window contains several tabs. These allow you to control the different parameters of the scanner.
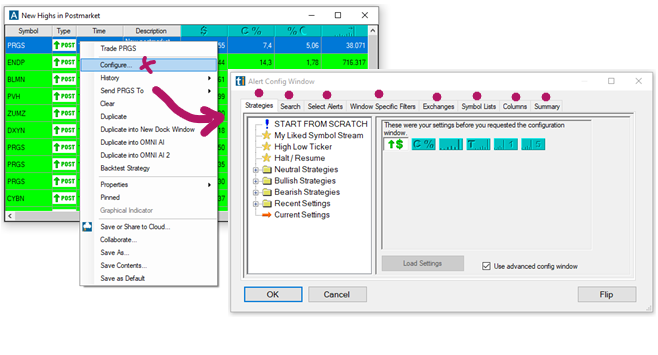
-
Strategies Tab: Choose pre-configured strategies or create your own from scratch.
-
Search Tab: Find and add the over 500 available alerts and filters.
-
Select Alerts Tab: Choose the alerts, you would like to use for your strategy.
-
Window Specific Filters Tab: Specify which filters you would like to use along with your alerts and define their values.
-
Exchanges Tab: Select the stock exchanges your scanner will monitor.
-
Symbol List Tab: Create specific lists of stocks to watch or ignore.
-
Columns Tab: Select which columns will be displayed in the scanner window.
-
Summary Tab: Overview of your chosen settings.
For more in-depth information about each tab, continue below.
Strategies Tab
The Strategies Tab inside the Alert Config Window provides access to many pre-configured strategies as well as your own recent strategies.
Right-click into the Alert Window, select Configure, and then Strategies Tab.
The field on the left-hand side will list all the available bullish, bearish, and neutral strategies. Click on the Plus Sign to open a strategies folder.
Once you have selected a strategy, the right-hand panel will show a brief description as well as the alerts and filters in use.
To load the chosen strategy, click on the Load Settings button below or double-click on the strategy title in the field on the left-hand side.
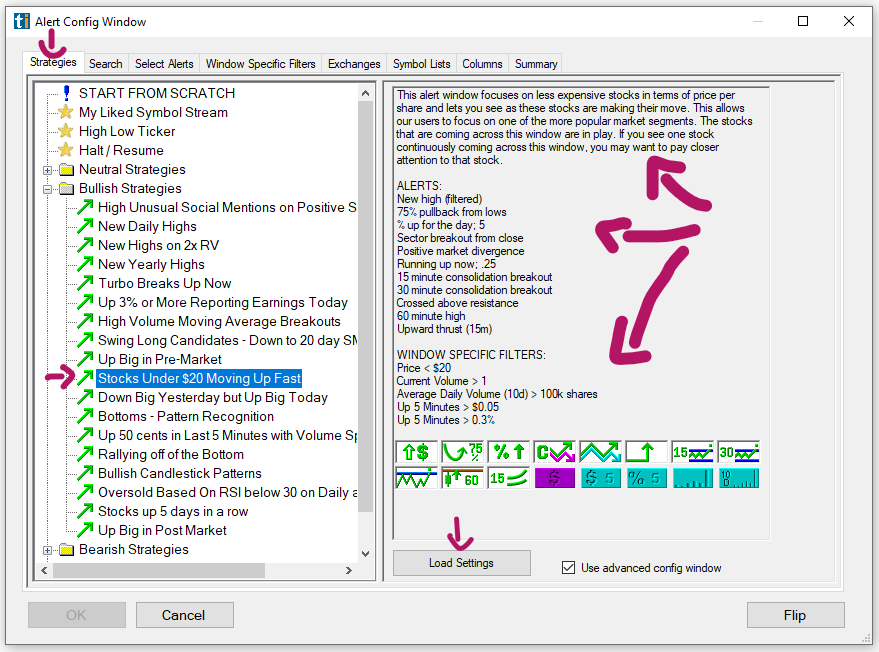
To quickly modify the loaded strategy, click on any of its icons. Filters icons always have teal and purple backgrounds, whereas Alert icons display an image and mostly have white backgrounds.
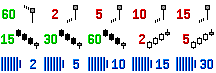
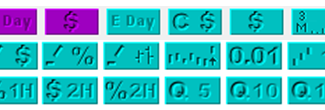
A click on any Alert icon will open up the Select Alerts Tab, where you can check or un-check the alerts in use. A click on any Filter icon will open up the Windows Specific Filters Tab. where you can modify each filter.
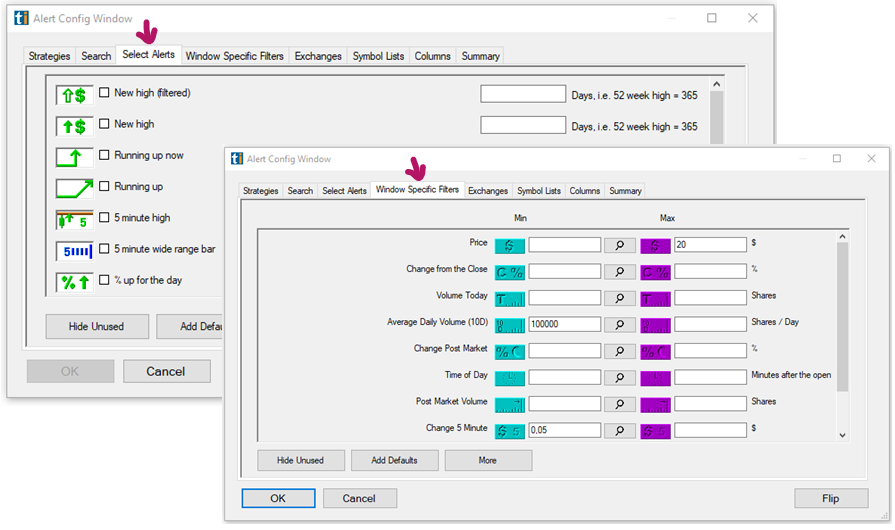
A right-click on any of the icons, will open a popup menu.
Help (Icon - Right-Click)
The Help option will bring you to our main Alerts & Filter Page, which provides detailed information about each alert and filter as well as their settings.
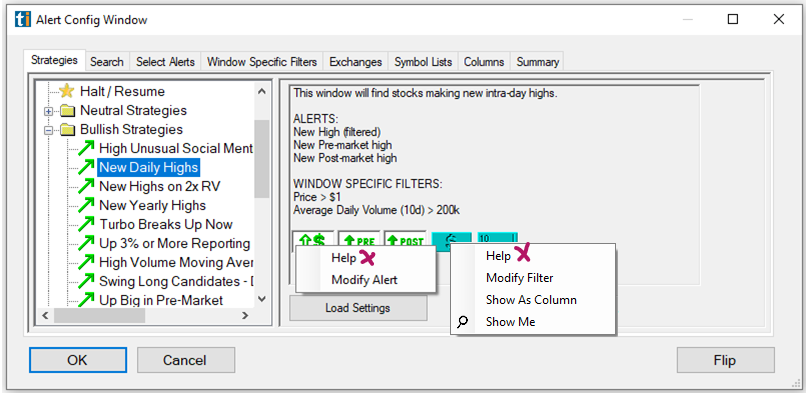
Modify (Icon - Right-Click)
The Modify option will lead you to the Select Alerts Tab in case of an Alert icon, or the Windows Specific Filters Tab, in case of a Filter icon, where you can adjust the settings.
Show as Column (Icon - Right-Click)
The Show as Column option will lead you to the Columns Tab, where you can choose which data columns you would like to visually display in your Alert Window.
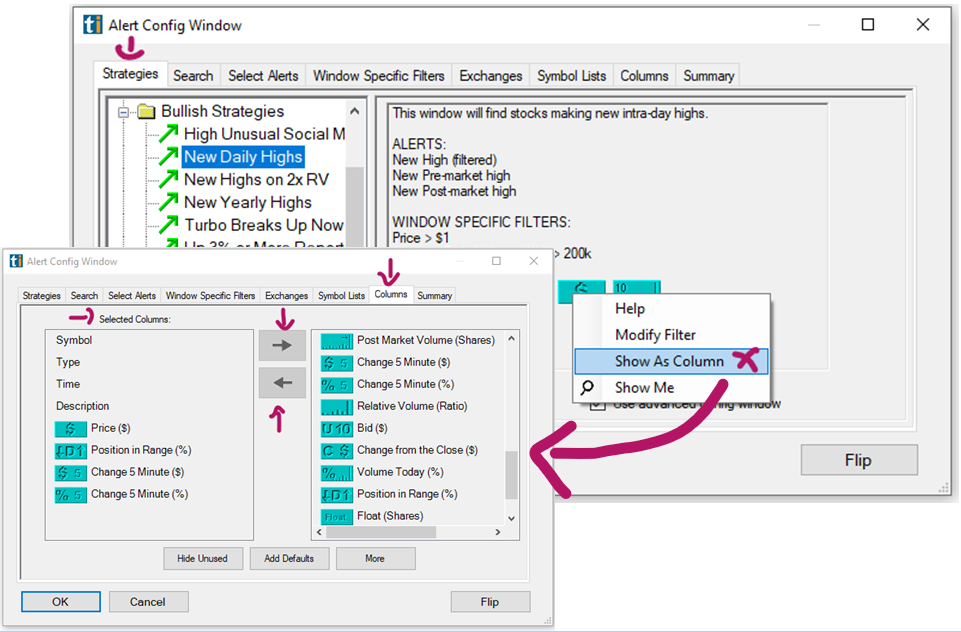
Show Me (Icon - Right-Click)
The Show Me option is a great tool when you are uncertain about the exact filter settings, or would like to see the effects filter changes will have on the number of stocks available to scan.
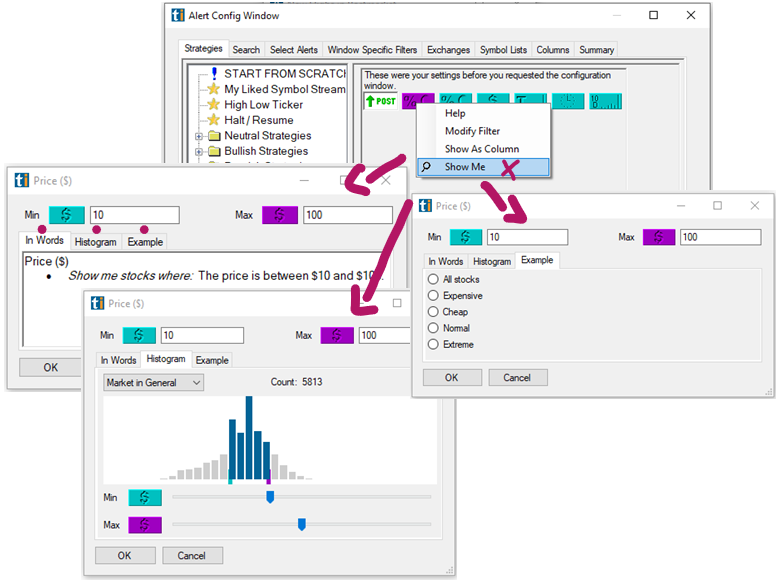
Flip
The Flip option at the bottom right-hand side enables you to switch the scanner settings from bullish to bearish and vice versa. When selected, it will open the Summary Tab, which gives you a breakdown of the flipped strategy.
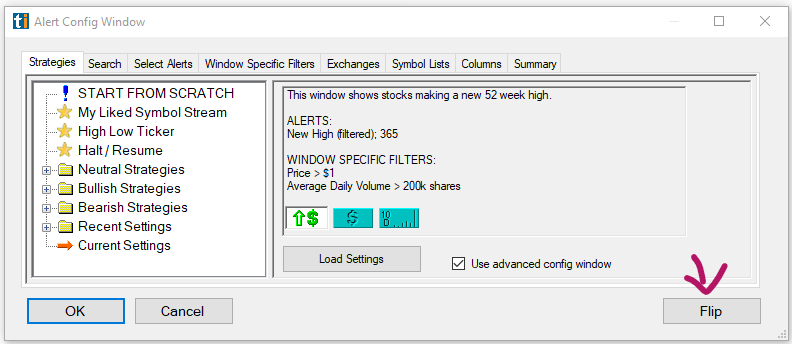
Start from Scratch
Select Start from Scratch to create an entirely new scanner and activate this option by double-clicking or pressing the Load Settings Button below.
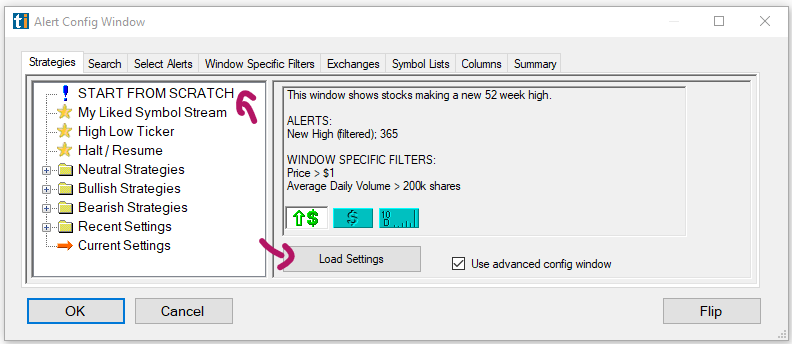
Thereafter, you can choose any of the available alerts and filters in the Search Tab to create your own scan. You can define the filter values in the Windows Specific Filters Tab, choose the exchanges to be scanned in the Exchanges Tab, include or exclude specific stocks in the Symbol Lists Tab and choose, which columns to visually display in your scan from the Columns Tab.
My Liked Symbol Stream
The Strategies Tab also lets you modify the alerts and filters of the My Liked Symbol Stream. This scanner displays data for all the stocks that have been manually selected via the heart icon on the chart. You will find it in the Stocks I Like Channel of the Channel Bar.
Once you have selected and/or configured your strategy, hit the OK button. Now, the data populated will reflect the strategy that you have just configured and loaded.
Recent Settings
To remove the strategies that are listed under Recent Settings, head to your Accounts Management Page on our website and log in with your username and password.
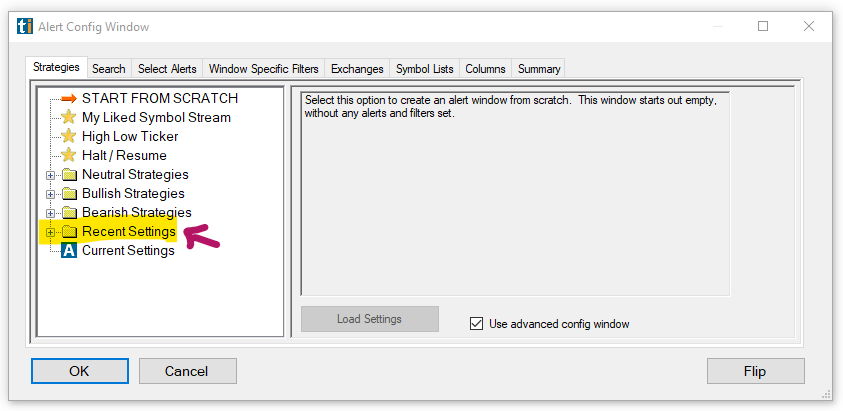
Here, select Recent Alert Settings on the right-hand side:
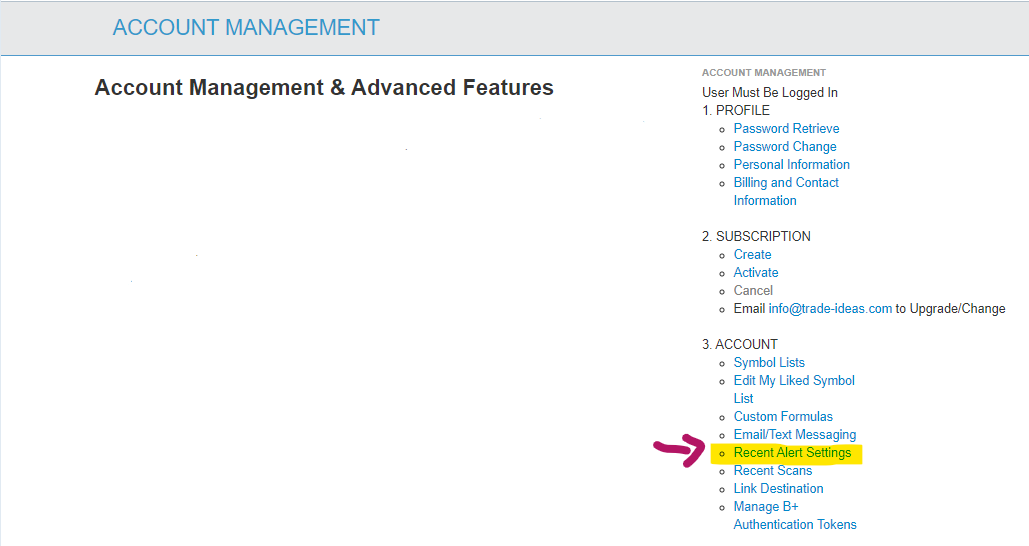
The following page will list all the strategies that are listed under Recent Settings in the Alert Configuration Window and enables you to view, edit or delete them:
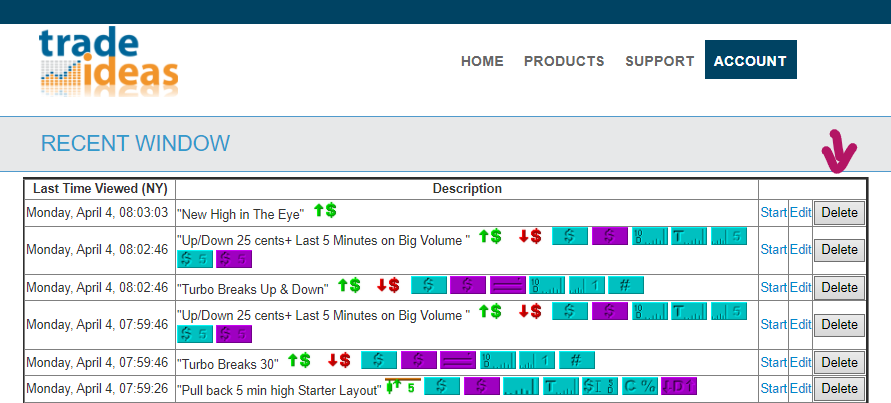
Search Tab
The Search Tab, enables you, to find all of the available alerts and filters, you can use to customize your scans. right-click into the window, select Configure and open the Search Tab.
Scroll through the entire list, or enter a keyword into the search field. You can also narrow down the options, by making a selection from the category dropdown. Filters icons always have teal or purple backgrounds, whereas Alert icons display an image, and most of the time have white backgrounds.
Once you have found the alerts or filters, that you would like to use, highlight them with a mouse click.
A right-click on a highlighted alert or filter will bring up a popup menu with various options. The same options are accessible by pressing the buttons below the list.
A click on, Add Alert will open up the Select Alerts Tab where you can check or uncheck which alerts to include in your scan.
A click on, Add Filter will open up the Windows Specific Filters Tab where you can modify each filter.
The Clear All option will unselect all highlighted alerts and filters.
You can choose to visually display a filter as a column in your window. Highlight the filter, then select the Show Column option at the bottom of the list. This will bring you to the Columns Tab, where the chosen filter has automatically been added to the field on the left-hand side. This field displays the already chosen columns. The right-hand side, on the other hand, contains all the available filters, that can be selected for display in your scan.
To find out more about a specific alert or filter and its settings, highlight it, then press the Help button. This will bring you to the Alert & Filter Definition page on our website. It provides valuable insight and will assist you in determining the correct alert or filter usage and settings.
The Show Me option is a great tool when you are uncertain about the exact filter settings or would like to see the effects filter changes will have on the number of stocks available to scan. A further tutorial will discuss this feature in more detail.
Click OK when you are done, or jump to one of the other tabs to adjust your scan further.
Select Alerts Tab
The Select Alerts Tab enables you to select the alert types for your scan. Every Alert Window needs at least one alert, so this tab is important.
Right-click into the Alert Window, select Configure, and open the Select Alerts Tab.
Here, check the alerts that you would like to use and, if required, set their parameters.
You need to have at least one alert, but you can use multiple alerts in a single Alert Window. The individual Alerts don’t interact with each other, they work in an OR fashion, meaning each alert triggers when its specific event happens and is fully independent of the other alerts. Filters, on the other hand, work in an AND fashion. A stock must satisfy all of the filter conditions and at least one of the alerts to show up in your Alert Window.
If you do not select an alert from the Select Alerts Tab, the Heartbeat alert will automatically be selected. It is a default placeholder that pings the server every couple of minutes to look for symbols satisfying the filters without the need for a specific event.
Some of the alerts have a quality field, the value can be based on days, dollars, volume, shares, or percent. If you leave the quality field blank, you will see more alerts than if you enter a value since this will tighten the scope.
To only see the alerts that are part of your strategy, press the Hide Unused button. Choose Add Defaults to see the list of alerts that are generally used. You can add more alerts by pressing the More Button and then using the Search function. Highlight an alert you would like to add, then press the Add Alert button at the bottom. The chosen alert will automatically be added to the Select Alerts Tab. You, however, still have to check the box if you would like to include it in your scan.
Click OK when you are done, or jump to one of the other tabs to adjust your scan further.
It is recommended that you pair it with filters from the Windows Specific Filters Tab, in order to narrow the scope and receive high-quality alerts.
Window Specific Filters Tab
The Window Specific Filters Tab enables you to increase the quality of your scan’s signals by combining your alerts with filters. Right-click into the Alert Window, select Configure and open the Window Specific Filters Tab.
You can define a minimum and a maximum value for each filter. The minimum filter icons are teal-colored, and the maximum filter icons are purple-colored. The magnifying glass icon between them hosts the Show Me Feature. A click on it will open a window where you can test different filter values. The In Words Tab will have a written description of what the filter will display. Depending on the filter you will also see the effects of different filter values as a Histogram, on a Chart, in an Up vs Down comparison, on a Calendar, and will be provided with suggestions in an Example Tab. Just use the sliders in each Tab to adjust your minimum and maximum values and see how many stocks fit the chosen criteria.
To only see the filters that are part of your strategy, press the Hide Unused button. Choose Add Defaults to see the list of filters that are generally used. You can add more filters by pressing the More Button and then using the Search function. Highlight a filter you would like to add, then press the Add Filter Button at the bottom. The chosen filter will automatically be added to the Windows Specific Filters Tab where you can enter minimum and maximum values or leave them blank. If you leave filter values blank but add them to the Columns Tab by choosing Show Column, you will be able to see the filter value at the time of an alert in your window without the filter influencing the results of your scan.
Click OK when you are done, or jump to one of the other tabs to adjust your scan further.
Exchanges Tab
The Exchanges Tab enables you to select the stock exchanges that your Alert window will scan. Simply right-click into the Alert Window, select Configure, and open the Exchanges Tab. Here, you will find a list of all the markets we cover. By default the main American exchanges NYSE, AMEX and NASDAQ are selected, but you can also scan OTC, Pink Sheets, BATS, The Small Exchange, and even Canadian exchanges. Please note, due to the license agreement the price and volume data for Canadian stocks will not be shown and there won’t be Canadian chart data.
If one or more of these options are grayed out, it may be necessary to complete the exchange agreement for the respective exchanges. In this case, log into your Account Management Page on our website. After login, your entitlement status will be visible. Click the appropriate link and complete the online agreement to gain access to the data.
Simply select the exchanges that you would like to monitor from the list by checking the boxes. Then hit OK.
Symbol Lists Tab
Include or exclude Symbol Lists
You can include or exclude stock symbols from your scan. To do so, right-click on your scan and select Configure. Next, open the Symbol Lists Tab.
Your already existing Symbol Lists will show up in the drop-down menu of the Add Existing List Tab, located on the right-hand side.
Any already activated list, will be displayed in a different color.
Simply click on a Symbol list from the dropdown, to add it to the section on the left-hand side.
The Add Existing List Tab, does not only contain your own Symbol Lists, but also offers a large variety of preconfigured Symbol lists to choose from. Of particular interest to many traders are symbol lists that include or exclude recent IPOs, ETFs, Warrants, or entire sectors.
Once you have selected all the symbol lists, you would like to include or exclude, make your selection from the dropdown on the left-hand side.
By default, your scan is set to monitor All Symbols.
From the dropdown, you can select to show Only the following lists and check the Symbol Lists you would like to point your scan at below.
Alternatively, you can choose to Exclude the following lists and check the Symbol Lists you would like to exclude from your scan below.
You can also choose to only monitor a Single Symbol with your scan. To do so, select Single Symbol from the dropdown and enter the ticker in the field below.
To remove a Symbol list from the selection field, right-click on it and select Remove from this List.
Once you have made your selection, hit OK.
Then select OK one more time to save your changes and close the Config Window of your scan.
Create a new Symbol List
The Symbol List Tab in the Config Window of your scan also gives you the option to Create a New List.
To create a new Symbol List, select Create New List on the bottom right-left side.
Give your new list a name, then click OK.
Now, the Edit Symbol List window will open.
There is no limit to the number of symbols you can add to a symbol list. The program will automatically convert all added symbols to the upper case, remove duplicates and sort the list alphabetically.
Typing
You can enter stocks manually by typing.
Copy & Paste from document
You can copy & paste symbols from any document. The symbols should be added one line per symbol, in upper or lower case.
Copy & Paste from Scan
You can also copy & paste selected symbols or entire symbol columns from your scans. To do this, first go to the Toolbar, select Tools, Options, and then General. Here, uncheck Highlight grid row upon selection.
By default, the entire row is highlighted when you select a column in the scan. Unchecking this option will enable you to highlight individual columns.
Now, go to your scan and highlight the symbols you would like to add to your Symbol List.
Thereafter, copy the data by using the Windows copy command, pressing the Control and C keys on your keyboard.
Now, go back to your newly created Symbol List and paste the symbols into it using the Windows paste command, pressing the Control and V keys on your keyboard.
Upload from File
In addition to manually adding stock symbols, you also have the option to upload a text file from your local PC by choosing Load from File. Please note, that this will overwrite any already added symbols.
If you would like to upload additional symbols to an already existing Symbol List, choose the option Insert From File instead.
Download Symbol List to PC
To save a copy of your Symbol list to your local PC, select the Save to File option.
Once you have added your symbols, hit OK.
Your newly created Symbol List will now appear in the Add Existing List of the Symbol List Tab within the Config Window of your scan, where you can choose to include or exclude its symbols.
Add more Symbols via Send to feature
To add more symbols to any of your existing Symbol Lists, on the fly, from any of your scans or charts, just right-click, then choose the stock ticker you would like to add, select Send to and then Symbol Lists from the dropdown.
Thereafter, choose a specific Symbol List to add the stock to from the following dropdown menu.
If you have recently sent a symbol to any of the lists, it will be bold. To remove this visual highlight, select Clear Recent List and click Yes.
To start an entirely new Symbol list or edit your Symbol lists, select the option, Manage Symbol Lists. This will bring you to the main Symbol List Configuration Menu, where you can create, edit, copy, rename, and delete your symbol lists. You can also access the main Symbol List Configuration Menu from the Toolbar. Just go to the Tools Tab and select Symbol Lists.
In addition to accessing your Symbol Lists from within our software, you can also find them on your Account Management Page, on our Website. Here, you can also edit, delete or create entirely new symbol lists.
Columns Tab
The columns displayed in your window can be reorganized via left-click drag and drop. The individual columns can also be extended or compressed by using your mouse. To add more viewable columns to your Window, right-click, select Configure and open the Columns Tab.
The Columns Tab enables you to define, which of the filter columns you would like to visually display in your Alert Window. Please note, the Windows Specific Filters Tab defines which filters you apply to your scan, whereas the Columns Tab simply defines which of these filters will be displayed as columns in your window.
The field on the left-hand side lists the already displayed columns. The right-hand side contains all the available filters that can be selected for display in your scan.
Select additional columns from the field on the right-hand side by highlighting them with a mouse click. Then, click the arrow pointing to the left to move them to the Selected Columns field.
To remove any of the already selected columns, highlight the column, then click the arrow pointing to the right.
To only see the filters that are part of your strategy, press the Hide Unused button. Choose Add Defaults to see the list of filters that are generally used. You can add more filters by pressing the More Button and then using the Search function.
Click OK when you are done, or jump to one of the other tabs to adjust your scan further.
Symbol Plus Column
The Symbol Plus Feature enables our users to condense some of the stock's key data into one single column.
It is available in Alert, Top List and Multi-Strategy Windows, as well as in the Premium AI Strategy Trades Window.

To enable Symbol Plus, right-click into the header of the symbol column of your scan.
A dropdown with the following options will appear:
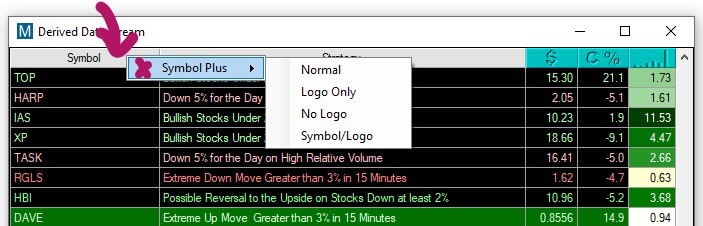
The option Normal will display the following info in the symbol column:

-
The company's symbol
-
The stock's current price
-
The Change from the Close in $
-
The Change from the Close in %
-
The company's logo
The option Logo Only will display the following way:

The option No Logo will display the following info in the symbol column:

-
The company's symbol
-
The stock's current price
-
The Change from the Close in $
-
The Change from the Close in %
The option Symbol/Logo will display the following info in the symbol column:

The option Off will show the traditional symbol column.
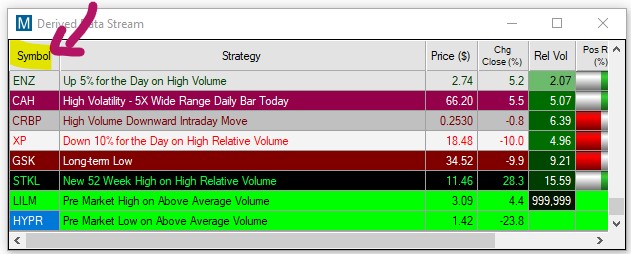
Summary Tab
The Summary Tab gives you an overview of your configured strategy, and the opportunity to change its name. To access it, right-click into the Alert Window, select Configure, and then open the Summary Tab. Enter or change the name of your strategy in the Window Name field. Below, you will find a summary of your current strategy. All the alerts and filters in use are displayed, together with a short description. To edit any of them, either right-click, to bring up a popup menu with options, or click on them, to go directly to the Select Alerts or Windows Specific Filters Tab. Once you've reviewed your settings, hit OK to open and run the newly configured Alert Window.
History
The History Feature enables you to analyze the alerts of your Alert Windows over the past 60 odd days.
By default, alerts will be streaming in real-time, however, you can uncheck the real-time mode, if you wish to look further back.
You can select to view the alerts of the Last Trading Day or the Previous Trading Day.
Alternatively, you can select All to see all the alerts of the past 60 odd trading days.
The window will load a maximum of 1000 alerts at once, to see older alerts, select More from the dropdown. You can keep selecting More until the 60-day trading limit is reached.
You can also request historical alerts for a specific Timeframe. Start describes the most recent alerts that you want to see. By default, these appear at the top of the alert window. You can choose Now as the Start Date, or you can choose a specific Date and Time.
Below you can choose the oldest alert that you would like to see. You can make a selection from the dropdown, which starts this morning and ends 64 days ago. Alternatively, you can choose a specific date and time.
Press the OK button and you will see the Window will fill with historical alerts. The caption of the Alert Window will be updated to show that historical data is currently displayed and that more historical data is available.
You can request additional portions of historical data via right-click, History, and More.
If you click on an alert to display it in a linked chart, you will see a blue arrow pointing at the bar where the alert occurred.
You can sort the output by specific columns. If I would like to, for example, see the highest-priced stocks at the top, double click on the price column.
This will bring up a menu with group and sort options. If a symbol shows up multiple times in your scan, you can leave it as such by selecting, All Alerts. You can, however, also choose to limit the output to the very first alert for the symbol, by choosing Keep Oldest, or the very last alert by choosing, Keep Newest.
Additionally, you can select which filter to sort by and the sort direction, either ascending or descending.
To save all the displayed data of the Alert Window as a CSV file on your PC, right-click and select Save Contents.
To transfer the column entries into a spreadsheet, highlight the rows either by clicking and holding down your left mouse key while moving over the rows or by pressing the Control and A key on your keyboard. To copy your selection, press the Control and C key on your PC’s keyboard. Finally, press the Control and V key to paste the selected rows into your spreadsheet.
To highlight entire rows with one mouse-click, Go to the Toolbar, select Options, General, and then, Highlight grid row upon selection.
To be able to highlight single columns, leave this option unchecked.
Send XYZ to...
The Send To Feature enables you to look up more info for a stock or share it with others. This feature is available in most Trade Ideas Windows, namely Charts, Top Lists, Alert, and Multi-Strategy Windows as well as Price Alerts and AI Strategy Trades Windows. Simply highlight a symbol, then right-click and select, Send XYZ to... where XYZ stands for the chosen stock symbol.
You can choose to send the chosen symbol to a new Chart Window, or a new Single Stock Window.
In addition to that our Send To Feature lets you share the stock with your followers on Twitter. Enter your message, and if you would like to share the Alert as well as the Strategy, check the box, Include Strategy Config in Message. Thereafter click, Tweet Now. If you haven’t connected to Twitter yet, the Twitter Authorization Window will open. Enter your Twitter username and password, then click Authorize app. After logging in, copy the received PIN into the box on the bottom left-hand side. Then click, Confirm.
You can also send a symbol to an already externally linked target platform. If you have not established External Linking yet, the External Linking Window will open and enable you to Add a Link. With external linking enabled, any symbol you click on within Trade Ideas will automatically load in an external platform like your charting or brokerage app. This is a good way to connect to a lot of different applications. A further tutorial will discuss External Linking in more detail.
Another option is to send the stock symbol to the Web. By selecting send to Web, you can find info about the particular stock on Yahoo, Finviz, StockCharts, BigCharts, as well as other web-based platforms, and conduct further research. If you check the option, Use Symbol Linking, and leave the particular web-based platform open, it will automatically load every symbol you select in your scan on the web-based platform as well. This way, you will get an instant internet look-up for every symbol that you’re interested in. In addition to the sites in the selection menu, you can select Custom to add a different web-based platform. If this platform requires a login, log into the web-based platform first. Then, have a look at the URL when you are logged in to your web destination. Copy this URL, and split it where the symbol is mentioned. Enter the part of the URL before the symbol, into the first section, and the part after the symbol in the next section.
Lastly, you can send the stock symbol to one of your existing Symbol Lists. Or even create a New List to add the symbol to. A further tutorial will discuss how to create, edit and use Symbol Lists in more detail.
Send XYZ to Symbol List
The Send To Feature allows you to add stock symbols to a so-called Symbol List or Watchlist. A Symbol List is useful if you would like to include or exclude certain stocks from your scans.
To add more symbols to any of your existing Symbol Lists, on the fly, from any of your scans or charts, just right-click, then choose the stock ticker you would like to add, select Send to, and then Symbol Lists from the dropdown.
Thereafter, choose a specific Symbol List to add the stock to from the following dropdown menu.
If you have recently sent a symbol to any of the lists, it will be bold. To remove this visual highlight, select Clear Recent List and click Yes.
To start an entirely new Symbol list or edit your Symbol lists, select the option, Manage Symbol Lists. This will bring you to the main Symbol List Configuration Menu, where you can create, edit, copy, rename, and delete your symbol lists. You can also access the main Symbol List Configuration Menu from the Toolbar. Just go to the Tools Tab and select Symbol Lists.
Create a new Symbol List
The field on the top left-hand side of the new window displays all the already existing Symbol Lists and the number of symbols they contain.
To create a new Symbol List, select Create New List on the bottom right-hand side.
Give your new list a name, then click OK.
Your newly created list will now appear in the Symbol List field.
Add single symbols to one or multiple Symbol List
To quickly add or delete a single symbol, highlight the Symbol List, then enter the ticker in the Symbol Field in upper or lower case and click Add or Delete. The symbol will now be added to or removed from all the currently highlighted lists. The program will automatically remove duplicate symbols during addition and ignore any removal request if the symbol does not exist in the symbol list.
To select more than one list at once, press the control key on your keyboard while selecting the lists with your mouse.
Add multiple symbols to a Symbol List
To add multiple symbols to your newly created Symbol List, double-click on your list to open it.
This will take you to another window where you can enter the stock symbols. There is no limit to the number of symbols you can add to a symbol list. The program automatically will convert the symbols to the upper case, remove duplicates and sort the list alphabetically.
Typing
You can enter stocks manually by typing.
Copy & Paste from document
You can copy & paste symbols from any document. The symbols should be added one line per symbol, in upper or lower case.
Copy & Paste from Scan
You can also copy & paste selected symbols or entire symbol columns from your scans. To do this, first go to the Toolbar, select Tools, Options, and then General. Here, uncheck Highlight grid row upon selection.
By default, the entire row is highlighted when you select a column in the scan. Unchecking this option will enable you to highlight individual columns.
Now, go to your scan and highlight the symbols you would like to add to your Symbol List.
Thereafter, copy the data by using the Windows copy command, pressing the Control and C keys on your keyboard.
Now, go back to your newly created Symbol List and paste the symbols into it using the Windows paste command, pressing the Control and V keys on your keyboard.
Upload from File
In addition to manually adding stock symbols, you also have the option to upload a text file from your local PC by choosing Load from File. Please note, that this will overwrite any already added symbols.
If you would like to upload additional symbols to an already existing Symbol List, choose the option Insert From File instead.
Download Symbol List to PC
To save a copy of your Symbol list to your local PC, select the Save to File option.
Once you have added your symbols, hit OK.
Edit, Copy, Rename, or Delete a Symbol List
To edit a Symbol List, select the Edit List button, which will bring you back to the symbol entry window.
To copy a Symbol List, select the Copy List button. Type the name of the new symbol list and press the OK to copy the list and populate it with the symbols from the currently selected lists.
To rename the list, highlight it and select the Rename List button.
To delete a list, highlight it and select the Delete List button.
The Refresh from Server button is used to clear the cache and reload it with the symbol lists from the server. This operation is automatically performed upon application startup. Select this option to ensure syncing, whenever you have made changes to your symbol lists.
In addition to accessing your Symbol Lists from within our software, you can also find them on your Account Management Page, on our Website. Here, you can also edit, delete or create entirely new symbol lists.
Symbol Linking
Most Trade Idea Windows, including Alert, Top List, Multi-Strategy, and Compare Count Windows as well as the Holly AI Windows, RBI, GBI, and Price Alerts can be symbol-linked to a Chart or Single Stock Window.
This means that when changing your windows stock symbol, your symbol-linked Chart or Single Stock Window will automatically change as well, and display the specific stock’s data.
By default, all symbol-linked free-floating Windows belong to the blue, Link to All, Color Group.
By default, all docked Windows are assigned to the pink, Dock Window, Linking Group. In "Pink Mode" only the menu items contained in the indiviual dock respond to symbol changes.
The assigned color group will always be displayed in the top left-hand corner of each window.

You can create up to 4 additional Linking Groups and by doing so, link selected windows to a specific Chart or Single Stock Window, which is very useful when monitoring various scans.
There are two ways to create a Linking Group:
- Option 1: Assign windows individually
You can assign windows to a specific color group individually.
To do so, right-click into your window, select Symbol Linking, and choose a color from the dropdown. The selected window will now display the Color Group in the top left-hand corner.

To enable Symbol Linking for a Single Stock Window, right-click into it, and select Symbol Linking.
Then, add a Checkmark to the left-hand side of the Symbol Linking option.
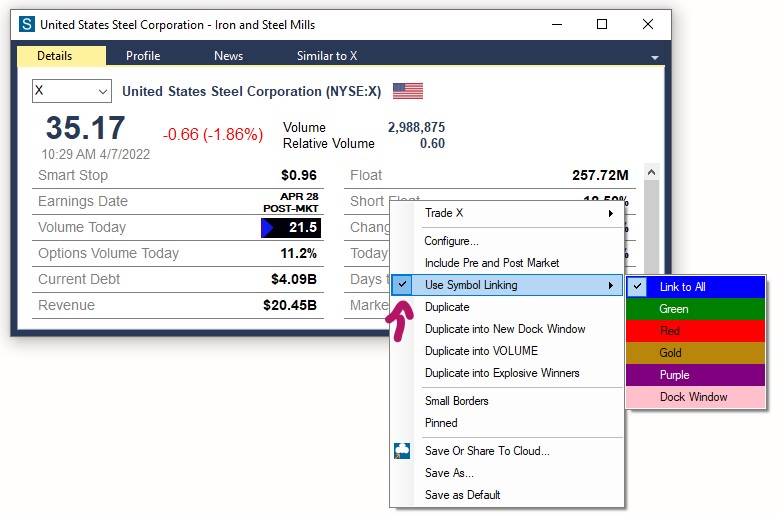
To enable Symbol Linking for a Chart, right-click into it, select Properties, and then Symbol Linking. Now, add a Checkmark to the left-hand side of the Symbol Linking option.

- Option 2: Assign multiple windows at once
To establish a Linking Group for a number of windows at once, go to the Toolbar, open the Tools Tab, and select, Symbol Linking Groups.

The next window will display all the Trade Ideas windows currently in use.
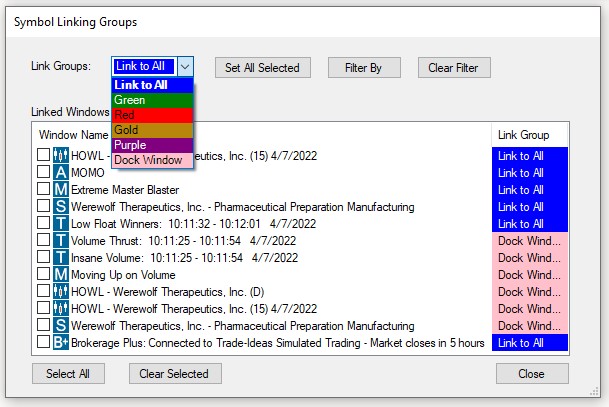
By default, each free-floating window is assigned to the blue, Link to All, Linking Group.
By default, each docked window is assigned to the pink, Dock Window, Linking Group. In "Pink Mode" only the menu items contained in the indiviual dock respond to symbol changes.
To establish a new Linking Group, select the windows that will be part of the new Linking Group by adding a checkmark.
You can select all windows at once by choosing, Select All, at the bottom.
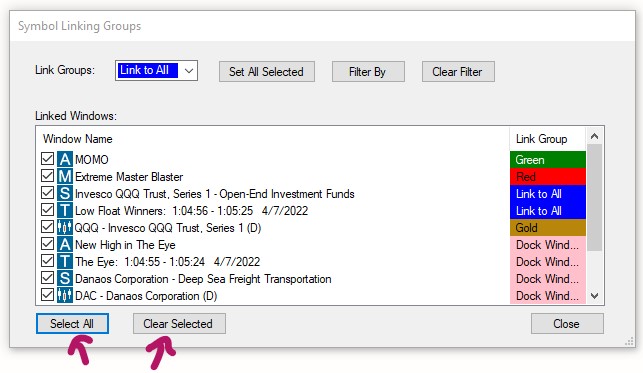
You can clear your selection by selecting, Clear Selected, at the bottom.
Once you have selected the windows, open the Link Groups dropdown in the top left-hand corner. Select a color for your new Linking Group, then choose, Set All Selected, to assign the windows.

All the selected windows will now display the color of the Linking Group you have assigned them to.
To see all windows that are assigned to a specific Linking Group, choose the Group Color from the Link Groups dropdown, then select, Filter By. To see all available windows, select, Clear Filter.
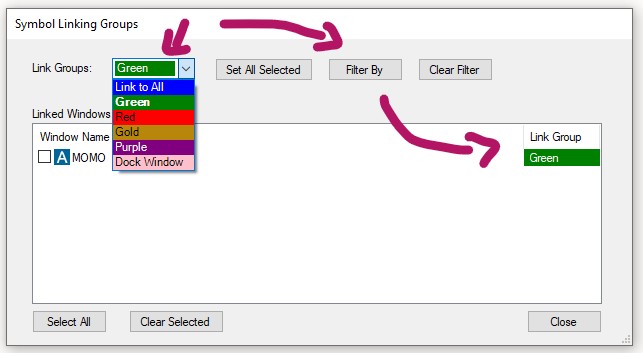
Once you have assigned the windows, select Close.
All the windows that you assigned to a Linking Group will now display the Group Color in the top left-hand corner.
Any Single Stock Window or Chart that has been assigned to the same Color Group will update accordingly, whenever you change a stock symbol in one of the other Linking Group windows.
Please note, that even when a Single Stock Window and Chart have been assigned to a specific color group, they will always also be linked to the Blue Color Group since this is the default Link to All Group. This means in turn that any window that is assigned to the blue linking group will be linked to all open SingleStock Windows and Charts.
Missing Symbol Check
The Missing Symbol Check function makes it very easy for you to determine why a specific stock symbol didn't appear on your scan.
It automates all the manual steps you would otherwise have to go through to see why a symbol didn't appear in your strategy along with red/green color coding pointing to exactly why a stock didn't show up.
To access this function, right-click into your Alert Window and select Missing Symbol Check
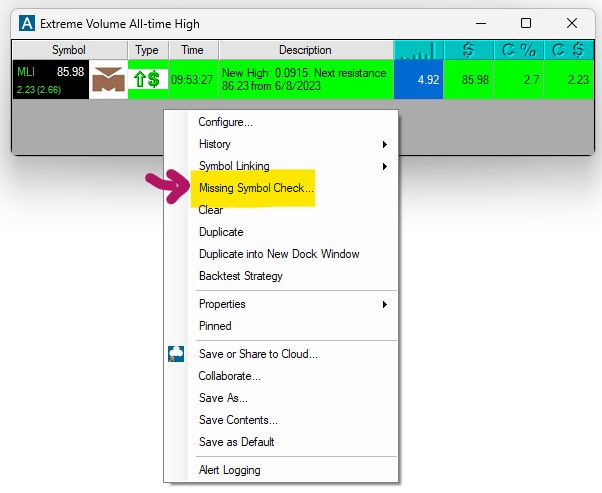
The Missing Symbol Check Window will open
You can check a specific symbol, by entering it in the Symbol Field.
Enter a time period for your check.
Start is the Date and Time closest to the current time, End is the Date and Time farthest in the past.
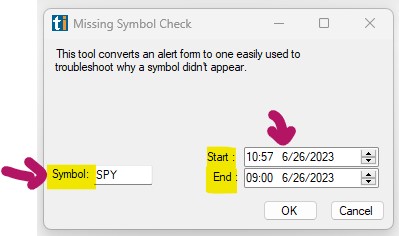
Once you entered a specific symbol, for example SPY, as well as a Time, for example 10:57 am for the Start, and 9 am for the End, click OK.
The individual Alert Window of your chosen strategy will now load:
The Alert Window will only point at the specific ticker you entered, for example the SPY, and highlight which of the scan's filter criteria the symbol meets and which ones it doesn't meet.
-
The filter criteria that aren't met by the entered symbol, are highlighted in red. These are the reason why the stock didn't appear on your scan.
-
The filter requirements that are fulfilled will be highlighted in green.
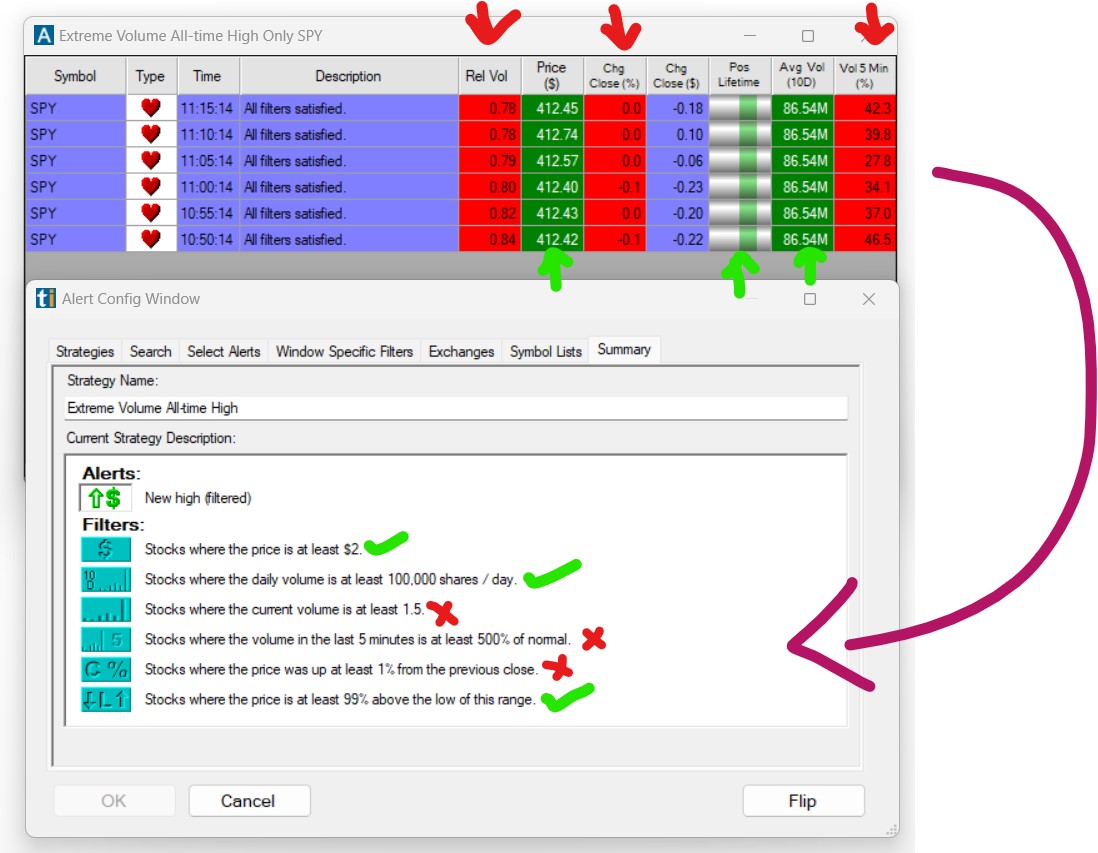
If the stock did not trigger one of the alerts selected in your Alert Window, you will see a Heartbeat Alert otherwise you will see the alert together with a time stamp.
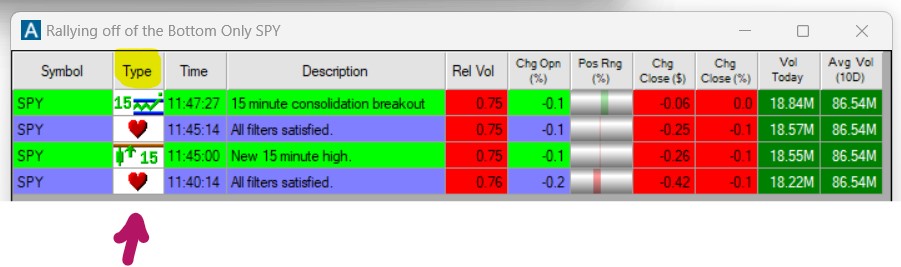
Clear
To remove all currently displayed alerts from the Alert Window, use the Clear function. Simply right-click into the Alert Window and select Clear. New Alerts will start populating in real-time as they trigger.
Duplicate
To copy your current Trade Ideas Window, use the Duplicate function. Simply right-click into your Alert Window and select Duplicate from the dropdown. You will get an exact copy of the current window, which you can modify while keeping the original window intact.
Duplicate into New Dock Window
To open a copy of a free-floating window in a new Dock, right-click into the free-floating window and select Duplicate into New Dock Window. An exact copy of your free-floating window will now be opened in a new Dock.
Duplicate into XYZ Dock
To load a copy of a free-floating window into an already open Dock, right-click into the free-floating window and select Duplicate into XYZ Dock, where XYZ stands for the Name of that particular Dock. An exact copy of your free-floating window will now be added to the chosen Dock.
Backtest Strategy
This is a quick overview of our proprietary event-based Backtesting Tool, the OddsMaker. Further tutorials will discuss its features in more detail. The Oddsmaker enables you to evaluate how well your strategies perform over recent history. You can determine the profit factor, the win rate, compare the average winner versus the average loser, and see the projected return of the strategy.
You can define your starting equity, your position size, and even add your broker's commission.
The backtest will show you the equity curve that your strategy produced and your daily profit and loss. In addition to that, you can see how many trades would have taken place each day, what the maximum drawdown was, and how much buying power was needed.
The color-coded calendar shows you the metrics per day, and a double-click reveals the individual trades. You can look at the different filters, see how they impact the results and adjust their values to optimize your scan.
In addition to that, the Oddsmaker enables you to refine and optimize your scans. The optimization tab allows you to drill down into the details of the strategy to see what makes it work. Each tab contains a reporting engine that can break down your strategy by different filters, allowing you to see which subsets of the trades work well and which don't. You can use the information here to add additional filters to your strategy to improve it.
Please note, the OddsMaker follows particular rules for entering into a trade. It starts with the earliest alerts and moves to the latest. Typically, there are 64 days worth of history in the database. The OddsMaker does not look at any data for the current trading day. It does not backtest in the premarket or postmarket session. Once it enters a position for a specific stock symbol, it will not look at that stock again for the rest of the trading day. However, each day starts fresh, and it will enter a new trade for the same stock symbol on the following days.
Our backtesting tool, as well as most other backtesters, is based on the open, high, low, and close data of 1-minute candles, not on tick-by-tick data. Because of this, you are likely to see discrepancies between testing results and actual trading. The back-tester is not designed for high-frequency trading or rapid scalping strategies. If your strategy is based on very fast price action, you might not see an accurate portrayal of real-world results. The OddsMaker will use historical data for the exit price and doesn't factor in the spread. In live trading, there is no guarantee that you will get this exact price.
Because of these differences to live trading, we recommend that you first successfully backtest and optimize a strategy, Then test it in paper trading mode, but under real market conditions, and only after that move to live trading.
To access the Oddsmaker, right-click into the Alert Window, and select, Backtest Strategy from the menu. This will open the Oddsmaker Configuration Menu. To learn more about backtesting, head to the Oddsmaker section.
Properties
Each Alert Window has a Properties Menu that enables you to modify the audible and visual appearance of the window itself as well as the data within it.

The different functions will be disussed item by item below.
Actions - Sound Alert
The Actions feature of our Alert window allows you to select various audio options. This way, you will be notified by a particular sound each time an alert triggers.
-
A Right-Click in the Alert Window will open the Options Menu. Here, select Properties and then Actions.
-
Check Play Sound in the new popup window. Then click Set Up Sound.
-
The next window will display built-in sound options. You can choose an asterisk, a beep, exclamation, a stop, or text to speech.
If you choose the Text-To-Speech Option, a female voice will call out each stock symbol that triggers.
Further below, you can choose a custom sound from your local computer. Please note that custom files need to be in WAV format, the system isn't able to use MP3.
-
Once you have selected a Sound Option, click Play to test the audio. Use the Balance and Volume sliders to adjust the sound to your liking.
-
Hit Okay when you are done.
Should you at any point decide, rather not to have sound alerts, you can always go back into the right-click Actions Menu and uncheck the sound option again.
Actions - Show Alert Window
To receive a visual notification when a new alert triggers in one of your scans, enable the Show Alert Window Feature.
Right-click into your Alert Window, select Properties, and then Actions. Here, check the option, Show Alert Window.
Once this option is enabled, the particular Alert Window will pop to the surface if it is hidden behind other windows.
Use this feature with caution, since it could put a strain on the UI resources when used in excess.
The best way to be notified of new alerts triggering and to be able to distinguish between the alerts from different scans is to set up a different Sound Alert for each Alert Window.
Show Strategy Menu
The Show Strategy Menu option allows you to add the list of preconfigured strategies that you can find in the Config Window as a dropdown menu to the top left-hand side of the scan window.
Text Headers
The Text Headers option allows you to adjust the way the column headers are displayed. By default, the column headers will show the filter names. To display filter icons instead, right-click select Properties and uncheck the Text Headers option. If you hover over the icons, the filter names will, however, always pop up.
View Mode
By default, the newest alert populates at the top of your Alert Window, but you have the option to sort the output in different ways. To access the Group & Sort Feature, right-click into the window, select Properties, and then View Mode. Alternatively, double-click on any Column Header of your Alert Window.
This will bring up a menu with Group & Sort options. When you double-click on a column header to access this feature, the particular column will automatically be selected as the Sort Item. You can, however, select any of the scan’s filters from the dropdown menu.
The column you choose to sort the scan by will depress.
If a symbol shows up multiple times in your scan, You can choose to limit the output to the very first alert for the symbol, by choosing Keep Oldest, or the very last alert by choosing, Keep Newest. Or, you can just leave it as such by selecting, All Alerts.
When choosing this option, all new alerts that populate will be highlighted in black.
Additionally, you can choose the Sort Direction, either ascending or descending.
To get back to the Alert Windows default behavior, just right-click select View Mode and Newest First. The window will then repopulate with the newest alerts on top.
Don't Repeat
The Don’t Repeat Feature is useful when your Alert Window displays many alerts for the same symbols in fast progression. This function helps to filter these repeated symbols.
Right-click, select Properties, and check Don't Repeat.
Now, you can select a time period, in which a symbol won’t be repeated, or choose not to repeat symbols at all.
Please note that the History Feature ignores this Don’t Repeat function. The History Feature, which you can access via right-click and then History, will, by default, always show all alerts for a symbol.
To filter the historical output in a similar manner, choose your historical Timeframe. Thereafter, double-click on any of the column headers, to bring up the Group and Sort Menu.
Here, select Keep Newest, to only see the last alert for a stock, or Keep Oldest, to only see the very first alert that triggered for a symbol, from the Symbol Options dropdown.
Select Colors
The Select Colors Feature enables you to define colors for the different alert types. Righ-click into the Alert Window, select Properties and then Select Colors. The alert types are grouped into three categories, namely bullish, bearish and neutral. You have the option to choose a background color as well as color for the type of each of these categories.
To change the currently displayed color, click on any of the bullish, bearish or neutral color buttons. The button on the left-hand side defines the text color, the button to the right, the background color.
The select recent settings field displays the previously selected color schemes. This way, you can easily reverse your changes in case you are unhappy with your choice.
Hit OK when you are done.
To assign a color to an individual filter column, right-click the text header of the particular column in your Top List and select Custom Colors for XYZ
This will bring up the Top List Color Chooser Menu.
The field on the top right-hand side shows the chosen filter column.
The left-hand side displays the current color scheme in use.
With each color representing a numeric value, the color gradually changes as the value ascends and descends.
At the center, you'll see 7 pre-configured color palettes, each with 5 numerical placeholders.
The preconfigured color palettes and numerical placeholders are optional, you can add as many numerical values and colors as you like.
Use the text field above the Add/Edit button to enter a new numeric value.
You can set each numeric value to have the same color by choosing the equal symbol or use the less than, equal, and/or greater than symbols to differentiate even further. Once you have made your selection, press the Add/Edit button.
To change the color scheme of an existing numeric value, highlight it. Once selected, an arrow will appear on the right-hand side.
Change the color by selecting the equal, less than, or greater than symbol, then select a color from the popup menu and hit OK. Then press Add/Edit.
To change the current color order, select the Flip Colors button.
To remove a numeric value and associated color scheme, highlight it and select the Delete button.
To remove the entire current scheme and start from scratch, select the Delete All button.
To undo changes and go back to a previous color scheme, select it from the Select recent or suggested settings field at the bottom left-hand side.
Hit OK when you are done.
Small Borders
From the right-click menu, you can select Small Borders. With this option enabled, you can make the window much more narrow than with regular borders, which is beneficial if screen space is limited. You could, for example, resize your window to only show the symbol column.
Speed
The Speed Feature allows you to control the speed of the alerts scrolling inside of the Alert window. By default, it is set to normal. To access the Speed Feature, right-click select Properties and then Speed. Here, you can choose between 6 speed options ranging from slowest.
Pinned
To keep a single Trade Ideas window on your screen permanently, even when switching layouts, or toggling through channels, right-click into the specific window, and select Pinned from the dropdown. The Pinned Feature, is available for all Trade Idea Windows, including Scans, Charts, Compare Count, and the Holly AI Windows.
Once a window is pinned, it does not follow the behavior of the other windows.
This is useful if you would like to include one or more windows of a channel in a custom layout, without saving the individual windows to the Cloud first.
It is important to note, that this window will stay open until you decide to unpin it. When accidentally saved within a layout, It might load multiple times, when closing and re-opening this layout. At worst, you will have multiple versions of the window all running on top of each other in the same position. This can put a strain on system resources and drastically impact software performance. The pinning option should therefore be used very carefully and consciously. A window should always be unpinned after the desired action is completed.
To do this, right-click into the window and remove the checkmark on Pinned.
To see all pinned and unpinned windows, or to close them, go to the Toolbar, select Windows, and choose, Close All Unpinned, or Close All Pinned.
Graphical Indicator
Graphical Indicators can be used to display the performance of stocks, in a quick-to grasp visual format. They can be used for all Position in Range Filters. These visually enhanced filter columns can be placed anywhere inside of a window.
When the indicator shows green, and when the green bar moves towards the right, it signals that the stock's current price is moving towards the high of the range.
If the indicator is red, it means, that the stock price is closer to the low of the range.
A lot of grey, on the other hand, signals that the stock is currently trading near the middle of its range.
To see the underlying percentage value, hover your mouse over the Graphical Indicator.
To switch between the graphical indicator and a numerical value, right-click into the specific Position in Range column, you would like to change. Then check or uncheck the option Graphical Indicator. This option is only available for the Position in Range filters, it will be greyed out for any other filter.
Save or Share to Cloud
Once you have created your own scan or have changed the settings of a preconfigured scan, make sure to save it to the cloud for future use.
1. Right-click into the window and select Save or Share to Cloud
2. Enter a new name into the Name field or keep the automatically added one.
3. Enter a description for your new scan or leave the Description field blank.
4. If you would like to automatically close any other open layout or channel in the future, whenever you load this new scan, select Clear Previous Layout. If you would like to load this scan on top of any already opened layout, leave this checkbox blank.
5. Select Save when you are done or select Save and Share to share the scan with others before saving it to the cloud.
6. There are various sharing options:
-
Scan the QR code
-
Select Copy All, to save the Cloud link to your clipboard and paste it into an email or messaging app.
-
Click the Twitter icon and include a text message if you like. If you haven't connected Trade Ideas to Twitter yet, a Twitter Authorization Form will open. Log in with your Twitter username and password. Then click, Authorize App. Thereafter, copy the displayed Pin Code into the field at the bottom left-hand side of the window and select Confirm.
7. Select OK when you are done.
Your new scan is now stored in your cloud, from where it can easily be retrieved. Just go to the Toolbar, open the File Tab and choose Load from Cloud. To find a saved scan, you can enter its name in the search field, or scroll through the list. Just highlight your scan, then choose Load.
Collaborate
QR Codes
The Collaborate Feature enables you to export your strategies to your phone. Just right-click into your Alert, Top List, or Multi-Strategy Window and select Collaborate. You can scan the displayed code with any QR reader app available on your phone. Thereafter, you can share it with others. If you choose to open the scanned URL on your phone, it will bring you to our website, where you can see the scan settings and real-time data output when logged in. If you follow the recommended link to our HTML5 page, you will be redirected to our latest Web Version. Once logged in, the particular scan will load immediately.
Social Media/Twitter
The Collaborate Feature also enables you to share your Alert, Top List, and Multi-Strategy on Twitter. Right-click into your Alert, Top List, or Multi-Strategy Window and select Collaborate. Here, enter a text message if you like. Thereafter, click the Twitter icon. If you haven't connected Trade Ideas to Twitter yet, a Twitter Authorization Form will open. Log in with your Twitter username and password. Then click, Authorize App. Thereafter, copy the displayed Pin Code into the field at the bottom left-hand side of the window and select Confirm. You will only need to do this once. Thereafter your Tweets will be sent immediately.
Copy & Paste
The Collaborate Feature enables you to share your scans via copy and paste. Simply right-click into your Alert, Top List, or Multi-Strategy Window and select Collaborate. Then, choose Copy All, to save the collaboration link to your clipboard and paste it into an email or messaging app.
Create a New Alert or Top List Window
The Collaborate Feature enables you to create an entirely new scan by loading a collaboration link into an existing Alert or Top List Window.
This is useful when you have received a collaboration link from a colleague or would like to use one of the collaboration links of a scan on our website. Simply right-click into your Alert or Top List Window and select Collaborate. Delete the existing URL in the field at the top, then paste your collaboration link into it. Thereafter, hit OK. This will erase the old setting and your Alert or Top List Window will now contain the new strategy. Make sure to save it to your cloud for future use. Just right-click and select Save or Share to Cloud.
Create a Multi-Strategy Window
The Collaborate Feature enables you to create Multi-Strategy Windows. A Multi-Strategy Window allows you to combine multiple independent Alert Windows into a single space-saving container window, each with its own unique alert and filter configurations.
To create a new Multi-Strategy Window, go to the Toolbar, open the New Tab, and select Multi-Strategy Window from the dropdown. This will open a blank window, into which you can now insert your individual Alert Windows.
To add new strategies to a Multi-Strategy Window, right-click into the Alert Window, you would like to add, and select Collaborate. Choose Copy All in the popup window. Next, right-click into the Multi-Strategy Window, select Strategies, New Strategy, and then Collaborate. Now, select Paste All. Your Alert Window will now be part of the Multi-Strategy Window. You can repeat this process to add further strategies.
Turn a Top List Window into an Alert Window
The Collaborate Feature enables you to turn a Top List Window into an Alert Window. This feature is particularly useful when you would like to backtest a strategy that includes the filters of a specific Top List Window. This way, you don’t need to add the filters one by one to an Alert Window, but can transfer the entire Top List to an Alert Window.
To turn a Top List into an Alert Window, right-click into the Top List Window and select Collaborate. Then choose Copy All. Thereafter, go to the Toolbar, open the New Tab, and select Alert Window. In the Alert Config Window, go to the top left-hand corner and double-click Start from Scratch, then hit OK. Ignore the error popup and select No. Thereafter, a new Alert Window with the Heartbeat as a placeholder will open up. Next, right-click into the Alert Window, select Collaborate and then Paste All. Thereafter, the Alert Window will contain all the filters of the Top List Window. Just right-click, select Configure and open the Summary Tab to see the new settings. Since the heartbeat is a default placeholder that just pings the server every couple of minutes to look for symbols satisfying the filters without the need for a specific event, you should go ahead and select an Alert, for example, a New High, for your new scan. To do so, right-click into the scan, select Configure, open the Search Tab and choose any Alert you would like.
Add Strategies to a Compare Count Window
The Collaborate Feature enables you to add two strategies to a Compare Count window. Typically, the Compare Count Window is used to visually compare a bullish against a bearish strategy. By default, it compares New Highs versus New Lows. It is a great visualization tool that can provide an indication of what the markets are up to. If you wish to compare one of your bullish and bearish strategies to one another, right-click into the Alert Window, you would like to add and select Collaborate. Choose Copy All in the popup window. Next, go to the Toolbar, open the New Tab, and select Compare Count Window. Now, select Collaborate in the Green Data field on the left-hand side to add a bullish strategy or in the Red Data field on the right-hand side to add a bearish strategy. Choose Paste All in the popup menu, then hit OK.
To add the second strategy, right-click into the Alert Window, that you would like to add and select Collaborate. Then select Copy All.
Now, right-click into the Compare Count Window and select Configure. Choose Collaborate in the Compare Count Config Window, then select, Paste All.
Your bullish and bearish Alert Windows will now be part of the Compare Count Window.
Save as
Apart from saving your windows to the cloud, you can also save them to your local PC in order to create a backup. This is especially useful if you have spent a lot of time and effort customizing your scans and layouts. Just right-click into your window and select Save As from the dropdown. This will bring up the standard Save file dialog. Enter a name for the file and choose a folder to save it to. By default, it will be saved in your local TradeIdeasPro folder. Lastly, press the Save button.
To load these .WTI files, open the File Tab of the Toolbar, and select Load Window.
Save Contents
To save all the displayed data of an Alert, Top List, or Multi-Strategy Window, as a CSV file on your PC, right-click and select Save Contents.
The standard Save file dialog will be displayed. Enter a name for the file, choose the file type and file folder, then press the Save button.
To manually transfer column entries into a spreadsheet, highlight the rows either by clicking and holding down your left mouse key while moving over the rows or by pressing the Control and A key on your keyboard. To copy your selection, press Control and C. Finally, press the Control and V key to paste the selected rows into your spreadsheet.
To highlight entire rows with one mouse-click, Go to the Toolbar, select Options, General, and then, Highlight grid row upon selection.
To be able to highlight single columns, leave this option unchecked.
Save as Default
You can save a window and its configuration as the default version of this window type by right-clicking and choosing Save As Default. Whenever you now open a new window of this type from the New Tab of your Toolbar, the window configuration that you saved as default, will load.
The Load Window option, which you can find in the File Tab of the Toolbar, provides access to all the default versions of your Trade Ideas windows. The default layouts of your Chart, Single Stock, Brokerage Plus, and AI Windows are saved in the TradeIdeasPro folder on your local computer.
Email and SMS Alerts
You can receive the alerts from your Alert Window as an email or SMS text notification. Top List Windows or other scan types do not support this functionality.
This service is, however, not intended as a replacement for our main product and is currently in beta.
The Email or SMS will contain at most 10 stock symbols, and you will typically not get more than 3 messages per hour. It works well for strategies with a very limited number of alerts.
To set up Email or SMS notifications head to the Email/Text Messaging section of your Account Management page.
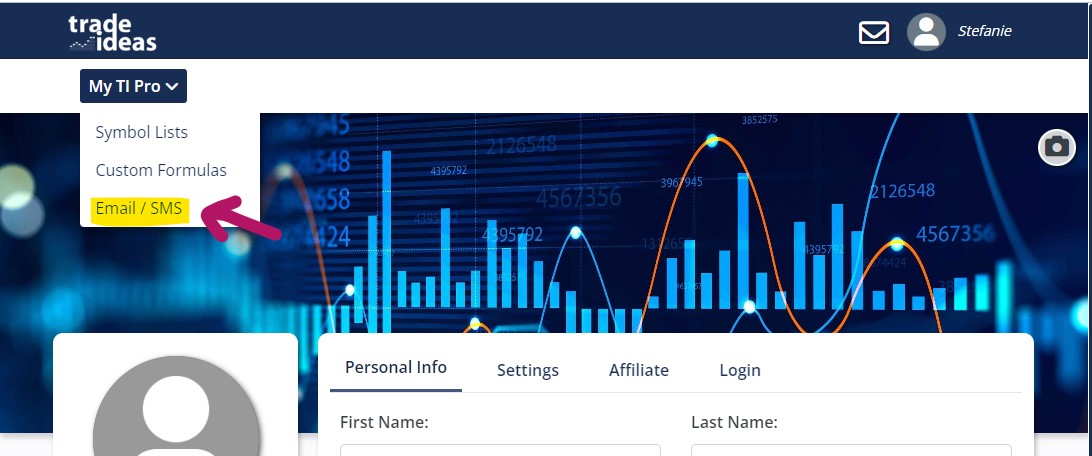
Configuration
Email Address
First, enter the email address you would like to receive notifications to in the email address field, then press Update:
To receive an SMS to your cell phone, an Email to SMS gateway is required. Contact your cell phone provider for more information.
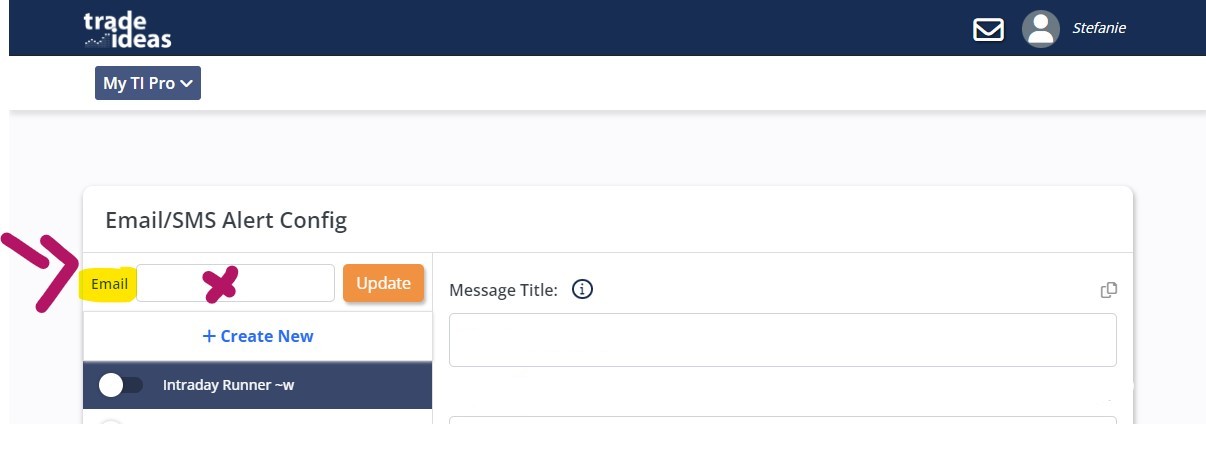
Add Strategies
You can configure multiple strategies. To add a new strategy, select Create New:
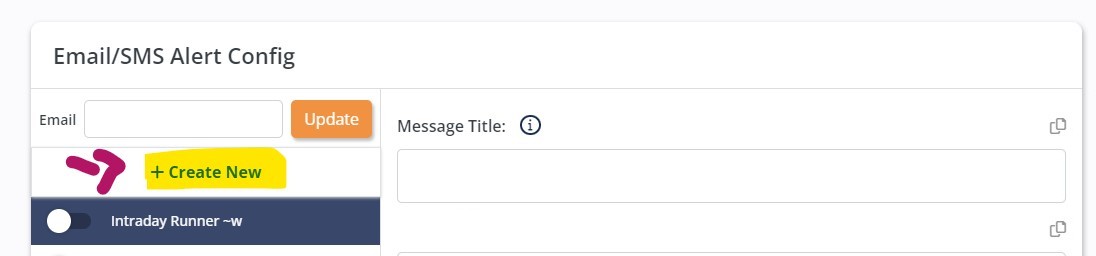
Message Title:
Next, enter the Title your email notifications will carry. This could, for example, be the name of your Alert Window.
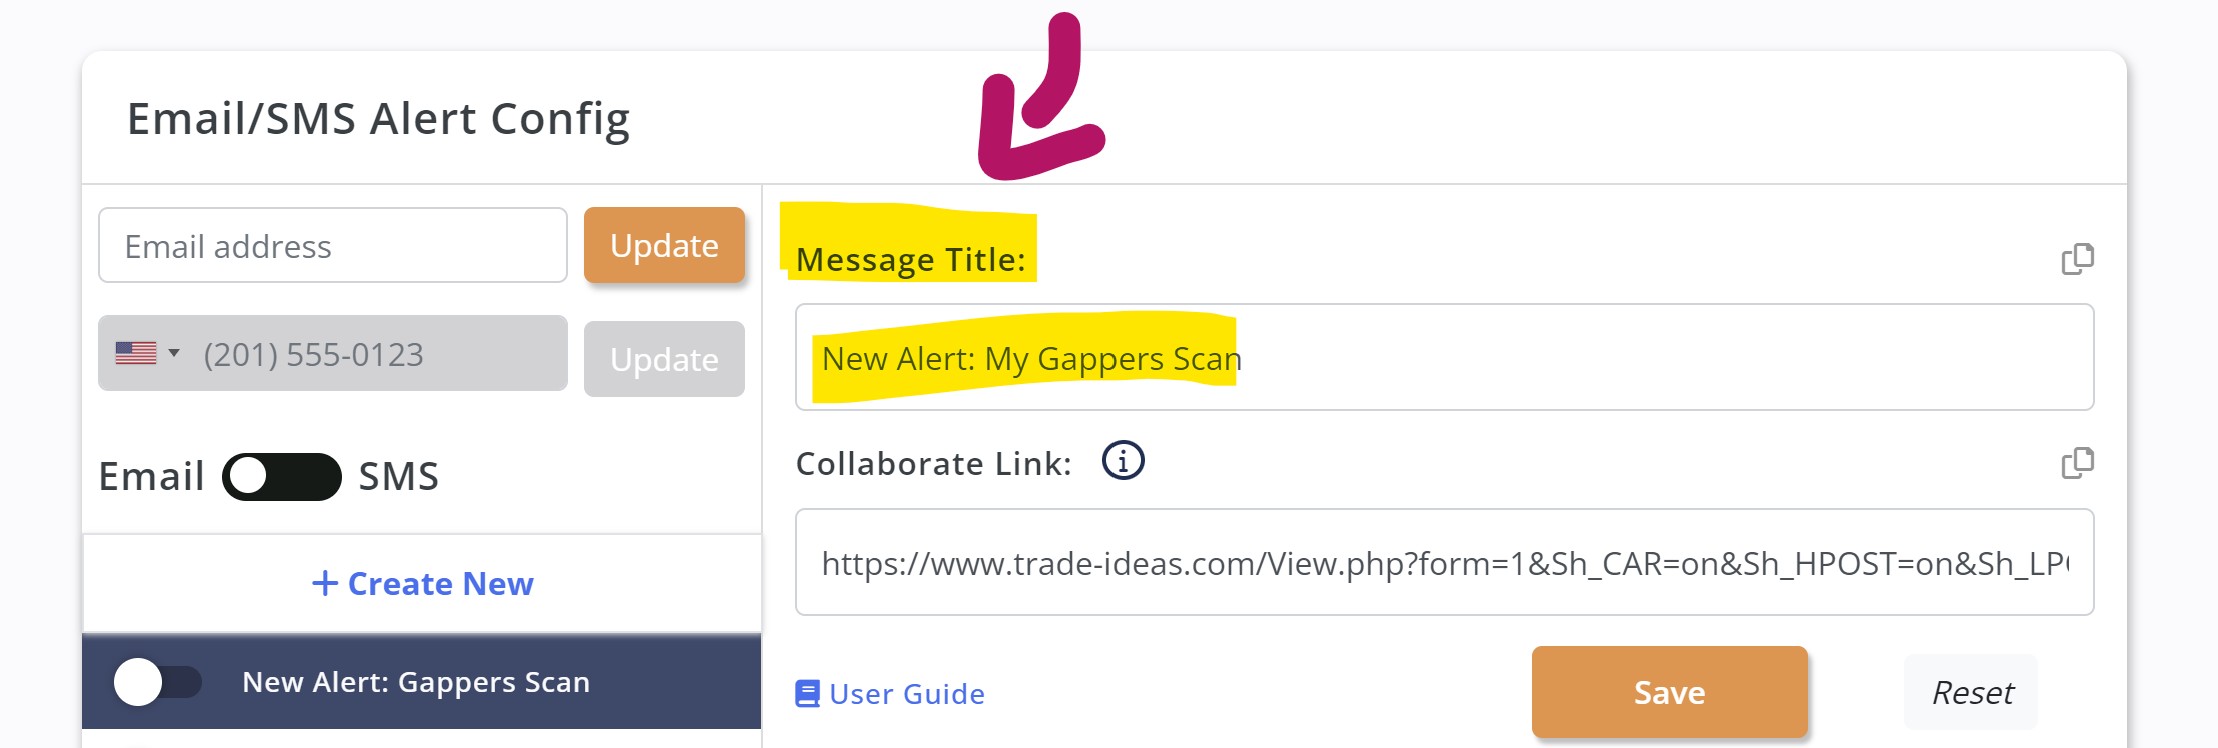
Collaborate Link
Finally, you will need to import you Alert Window with a Collaborate Link.
Important: Please ensure there are NO special characters in the scan name field of the Scan Summary Tab:
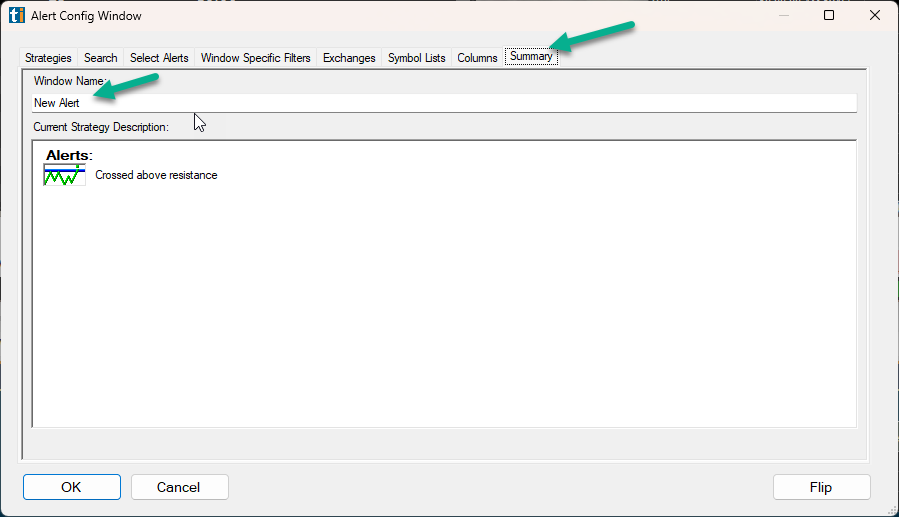
Next, right-click into your Alert Window scan, and select Collaborate. Choose Copy All, then paste this code into the Collaborate Link field.

Enable Strategy
To enable/disable Email/SMS notifications for your strategy, move the slider next to your strategy from left to right or vice versa.
When disabled, the slider button will be green, when disabled the slider button will be white/grey.
Each strategy is only allowed to send one email or SMS every 20 minutes. This will protect you in case you accidentally use a strategy which produces a lot of alerts.
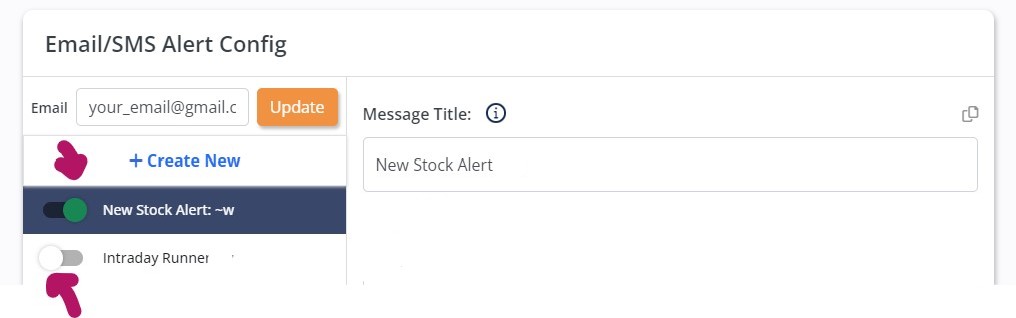
Settings
The name and setting of your Alert Window will automatically be displayed under Settings.
The settings column allows you to see a graphical summary of your strategy.
Move your cursor over an icon and hover to see the minimum/maximum settings of the corresponding alert or filter.
Click on an icon to be directed to our comprehensive Alerts & Filters Page.
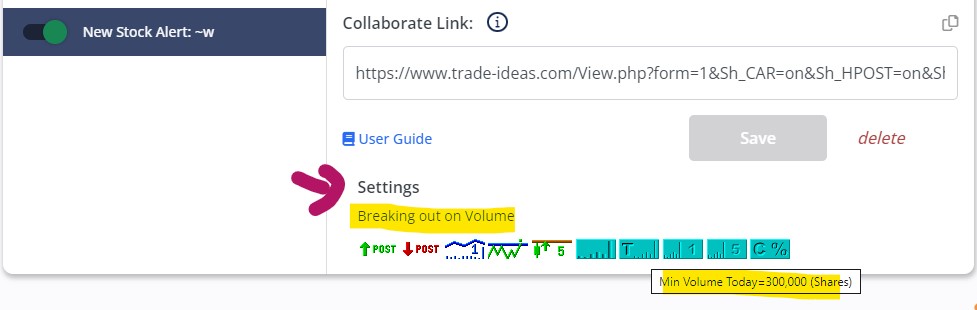
Alert Logging
When Alert Logging is enabled, the incoming alerts will automatically be added to a CSV file which is stored in the TradeIdeasPro folder on your PC:

Alert Logging needs to be enabled in two places:
In the The Toolbar:

And in the individual Alert/Top List Window:

Top List Window
A Top List Window displays a list of symbols that are meeting specified criteria.
Each Top List Window is marked with a “T” on the top left-hand corner.
Instead of showing a real-time stream of event-based alerts as displayed in an Alert Window, the Top List Window updates its list of filtered symbols every 30 seconds. It is akin to an automatically refreshing and updating spreadsheet and can be sorted in many different ways.
By default, each Top List window delivers the top 100 symbols based on your custom configuration. This record count can be extended to show a maximum of 1000 symbols at once.
There can be any number of Top List Windows, but bear in mind that each Top List Window requires system resources and bandwidth due to the update frequency.
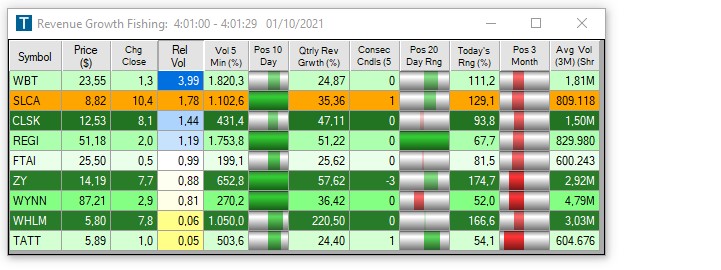
Difference between Top List and Alert Windows:
An important thing to note is that there is a distint difference between Top List and Alert Windows.
Alert Windows update in real-time and display the latest event at the top together with a time stamp. They contain alerts and filters.
Top List Windows, on the other hand, refresh every 30 seconds they do not check or need a specific event and only contain filters. Top Lists are more comparable to a spreadsheet, they simply display up-to-date data.
A Top List will show the top results based on your Server Sort Filter not based on time. It will rank the stocks according to the Sort Filter and only display the stocks with the highest/lowest value in terms of the Sort Filter.
Individual Alerts don’t interact with each other, they work in an OR fashion, meaning each alert triggers when its specific event happens and is fully independent of the other alerts. Filters, on the other hand, work in an AND fashion.
Filters icons always have teal and purple backgrounds, whereas Alert icons display an image and mostly have white backgrounds.
Trade XYZ
You can trade stocks right from your scans and charts via our One-Click Order Feature. Simply right-click into the scan or chart and select Trade to bring up a dropdown menu with preconfigured order templates.
How to create a custom Order Entry Template:
Real-Time Stock Race
The Real-Time Stock Race is a unique way of data visualization that distills the stock market action down to its essence and combats the information overload many traders face.
It enables you to see important metrics generally displayed in our spreadsheet-like Top List Windows in a straightforward and engaging way. Your top-ranking stocks will race against each other, helping you to see winners, the losers, and the ones in the middle field at a glance! You can use any Top List Window of your choice.
To access the Real-Time Stock Race Setup, right-click into your Top List Window and select Launch Real-Time Stock Race.
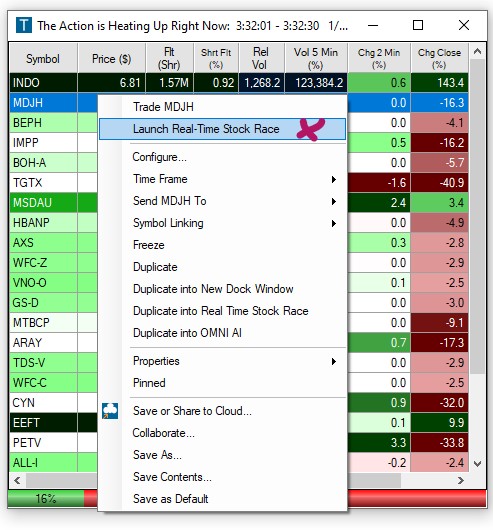
For step-by-step instructions head to the following Stock Race sections:
Show Treemap
In addition to the default grid view, and the Race View, Top List Windows can also return their data in a Tree Map.
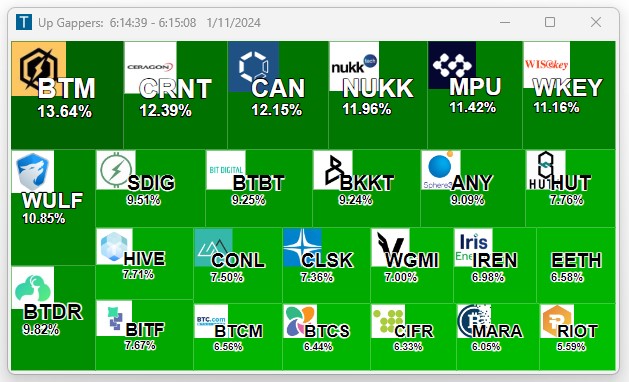
To display a Top List as a Tree Map, also referred to as Heat Map, right-click into the Top List Window and select Show Treemap
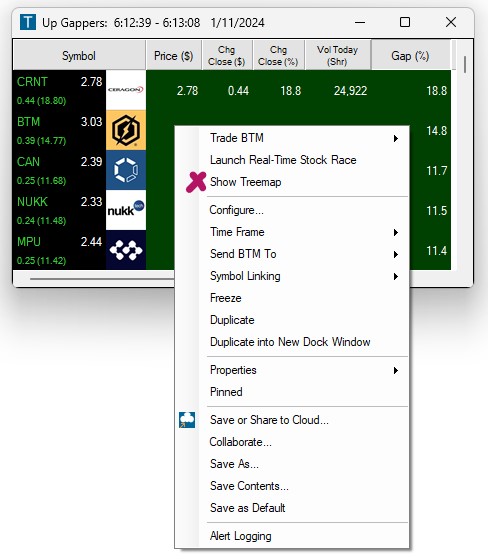
The Heat Map will rank the stocks based on the Sort Filter selected in the underlying Top List, for example Gap in % sorted by biggest on top.
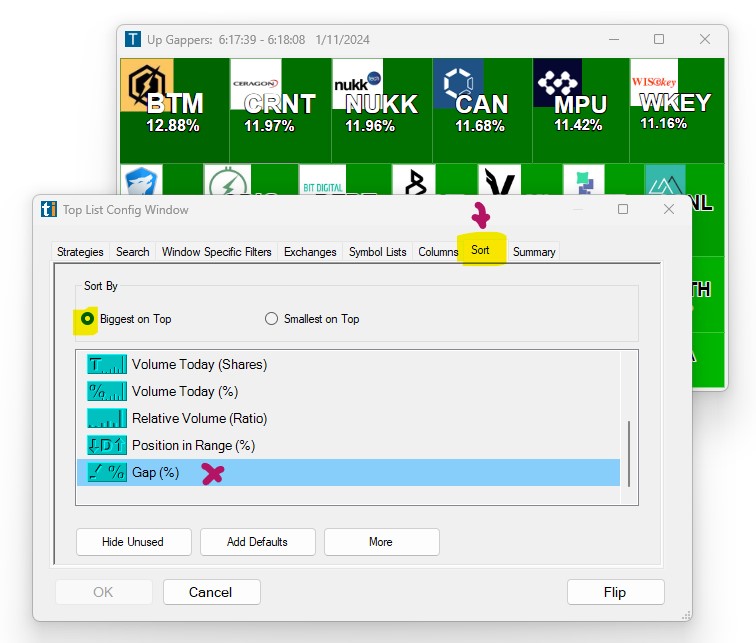
For more details about the Sort Tab, which is located in the Config Window of your Top List Window, head here.
Config Window
The Configuration Window enables you to adjust the settings and control the data that populates inside your scanner.
To open the Config Window, right-click into the scanner window.
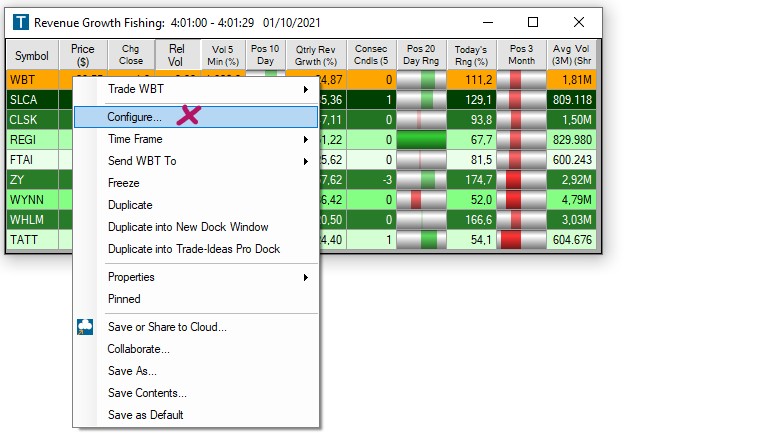
The main configuration window contains several tabs. These allow you to control the different parameters of the scanner.
-
Strategies Tab: Choose pre-configured strategies or create your own from scratch.
-
Search Tab: Find and add the over 200 available filters.
-
Window Specific Filters Tab: Specify which filters you would like to use along with your alerts and define their values.
-
Exchanges Tab: Select the stock exchanges your scanner will monitor.
-
Symbol List Tab: Create specific lists of stocks to watch or ignore.
-
Columns Tab: Select which columns will be displayed in the scanner window.
-
Sort Tab: Select the filter your Top List results will be ranked by.
-
Summary Tab: Overview of your chosen settings.
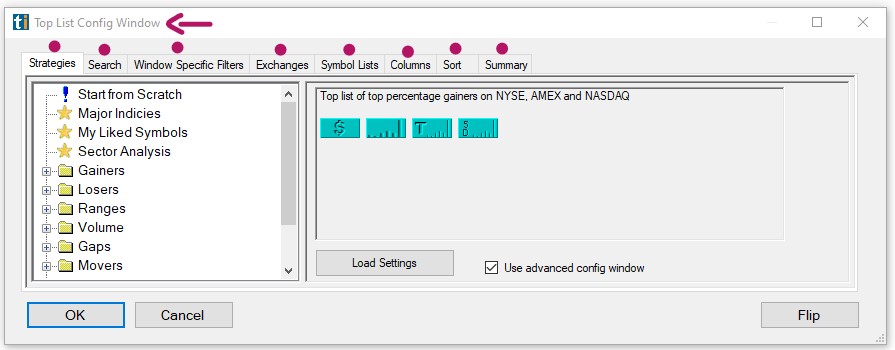
For more in-depth information about each tab, continue below.
Strategies Tab
The Strategies Tab inside the Top List Config Window provides access to many pre-configured strategies as well as your own recent strategies. Right-click into the Top List Window, select Configure, then open the Strategies Tab.
The field on the left-hand side will list all the preconfigured strategies relating to Gainers, Losers, Ranges, Volume, Gaps, Movers, and others. Click on the Plus Sign to open a strategies folder.
Once you have selected a strategy, the right-hand panel will show a brief description as well as the filters in use. A Top List Window only contains filters, whereas an Alert Window can be a combination of alerts and filters.
To load the chosen strategy, click on the Load Settings button below or double-click on the strategy title in the field on the left-hand side.
A click on any Filter icon will open up the Window Specific Filters Tab, where you can modify each filter by changing its minimum and maximum values.
A right-click on any of the icons, will open a popup menu. The Help option will bring you to our main Alerts & Filter Page, which provides detailed information about each filter as well as its settings.
The Modify option will lead you to the Window Specific Filters Tab, where you can adjust the settings.
The Show as Column option will lead you to the Columns Tab, where you can choose which data columns you would like to visually display in your Top List Window.
The Show Me option is a great tool when you are uncertain about the exact filter settings, or would like to see the effects filter changes will have on the number of stocks available to scan.
The Sort By option will lead you to the Sort Tab, where you can define the so-called Server Sort. The displayed data will be ranked according to the filter chosen in the Sort Tab.
The Flip option at the bottom right-hand side enables you to switch the Top List settings from bullish to bearish and vice versa. When selected, it will open the Summary Tab, which gives you a breakdown of the flipped strategy and allows you to change its name.
Select Start from Scratch to create an entirely new Top List Window. Activate this option by double-clicking or pressing the Load Settings Button below. Thereafter, you can choose any of the available filters in the Search Tab to create your own scan. You can define the filter values in the Windows Specific Filters Tab, choose the exchanges to be scanned in the Exchanges Tab, include or exclude specific stocks in the Symbol Lists Tab, choose which columns to visually display in your scan from the Columns Tab and which filter to sort by in the Sort Tab.
The Strategies Tab also lets you load your My Liked Symbols Top List. This Symbol List contains all the stocks that show a red heart icon on the chart. Simply double-click its title or highlight it, then press Load Settings. In the Symbol Lists Tab you can see that your Top List now points exclusively at your My Liked Symbol List.
The Strategies Tab also gives you access to your most recently used Top Lists. You will find them in the Recent Settings Folder.
Once you have selected and/or configured your strategy, hit the OK button. Now, the data populated will reflect the strategy that you have just configured and loaded.
Another way to access and select the strategies listed in the Strategies Tab of the Top List Config Window is to add them directly to your Top List Window. To do so, right-click into your Top List, select Properties, and then Show Strategy Menu. All the available strategies will now be listed in a dropdown right inside your Top List Window. The currently chosen strategy will be displayed at the top.
Search Tab
The Search Tab, enables you to find all of the available filters, you can use to customize your scans. Right-click into the window, select Configure and open the Search Tab.
Scroll through the entire list, or enter a keyword into the Search Field. You can also narrow down the options, by making a selection from the category dropdown. Once you have found the filters that you would like to use, highlight them with a mouse click.
A right-click on a highlighted alert or filter will bring up a popup menu with various options. The same options are accessible by pressing the buttons below the list.
A click on, Add Filter will open up the Windows Specific Filters Tab where you can modify each filter.
The Clear All option will unselect all highlighted filters.
You can choose to visually display a filter as a column in your window. Highlight the filter, then select the Show Column option at the bottom of the list. This will bring you to the Columns Tab, where the chosen filter has automatically been added to the field on the left-hand side. This field displays the already chosen columns. The right-hand side, on the other hand, contains all the available filters that can be selected for display in your scan.
In addition to that, you can define by which column the data output in your window will be sorted. Highlight the filter, you would like your scan to be sorted by, then click the Sort By button. This will bring you to the Sort Tab. The chosen filter has already been selected as the Sort Option. You can determine if you would like to Sort By Biggest on Top or Smallest on Top.
To find out more about a specific filter and its settings, highlight it, then press the Help button. This will bring you to the Alert & Filter Definition page on our website. It provides valuable insight and will assist you in determining the correct alert or filter usage and settings.
The Show Me option is a great tool when you are uncertain about the exact filter settings or would like to see the effects filter changes will have on the number of stocks available to scan. A further tutorial will discuss this feature in more detail.
Click OK when you are done, or jump to one of the other tabs to adjust your scan further.
Window Specific Filters Tab
The Window Specific Filters Tab enables you to select many different filters for your Top List Window. Unlike alerts, which work in an OR fashion, filters work in an AND fashion. A stock must satisfy all of the filter conditions to show up in your Top List Window.
Right-click into the Top List Window, select Configure, and open the Window Specific Filters Tab. You can define a minimum and a maximum value for each filter. The minimum filter icons are teal-colored, and the maximum filter icons are purple-colored. The magnifying glass icon between them hosts the Show Me Feature. A click on it will open a window, where you can test different filter values.
The In Words Tab, will have a written description of what the filter will display. Depending on the filter, you will also see the effects of different filter values, as a Histogram, on a Chart, in an Up vs Down comparison, on a Calendar, and will be provided with suggestions in an Example Tab.
Just use the sliders in each tab, to adjust your minimum and maximum values, and see how many stocks fit the chosen criteria.
To only see the filters that are part of your strategy, press the Hide Unused button.
Choose Add Defaults to see the list of filters that are generally used.
You can add more filters, by pressing the More Button and then using the Search function.
Highlight a filter, you would like to add, then press the Add Filter Button, at the bottom. The chosen filter will automatically be added to the Windows Specific Filters Tab, where you can enter minimum and maximum values, or leave them blank. A stock must satisfy all of the filter conditions to show up in your Top List Window. To create a watchlist or to see a filter value of a stock without limiting the scope of your scan, leave its value fields blank, and choose Show Column, to add them to the Columns Tab.
Click OK when you are done, or jump to one of the other tabs to adjust your scan further.
Exchanges Tab
The Exchanges Tab enables you to select the stock exchanges that your Top List Window will scan. Simply right-click into the Top List Window, select Configure, and open the Exchanges Tab. Here, you will find a list of all the markets we cover. By default, the main American exchanges NYSE, AMEX, and NASDAQ are selected, but you can also scan OTC, Pink Sheets, BATS, The Small Exchange, and even Canadian exchanges. Please note, due to the license agreement, the price and volume data for Canadian stocks will not be shown, and there won’t be Canadian chart data. Simply select the exchanges that you would like to monitor from the list by checking the boxes. Then hit OK.
If one or more of these options are grayed out, it may be necessary to complete the exchange agreement for the respective exchanges. In this case, log into your Account Management Page on our website. After login, your entitlement status will be visible. Click the appropriate link and complete the online agreement to gain access to the data.
Symbol Lists Tab
You can include or exclude stock symbols from your scan. To do so, right-click on your scan and select Configure. Next, open the Symbol Lists Tab.
Your already existing Symbol Lists will show up in the drop-down menu of the Add Existing List Tab, located on the right-hand side.
Any already activated list will be displayed in a different color.
Simply click on a Symbol list from the dropdown, to add it to the section on the left-hand side.
The Add Existing List Tab does not only contain your own Symbol Lists but also offers a large variety of preconfigured Symbol lists to choose from. Of particular interest to many traders are symbol lists that include or exclude recent IPOs, ETFs, Warrants, or entire sectors.
Once you have selected all the symbol lists, you would like to include or exclude, make your selection from the dropdown on the left-hand side.
By default, your scan is set to monitor All Symbols.
From the dropdown, you can select to show Only the following lists and check the Symbol Lists you would like to point your scan at below.
Alternatively, you can choose to Exclude the following lists and check the Symbol Lists you would like to exclude from your scan below.
You can also choose to only monitor a Single Symbol with your scan. To do so, select Single Symbol from the dropdown and enter the ticker in the field below.
To remove a Symbol list from the selection field, right-click on it and select Remove from this List.
Once you have made your selection, hit OK.
Then select OK one more time to save your changes and close the Config Window of your scan.
Create a new Symbol List
The Symbol List Tab in the Config Window of your scan also gives you the option to Create a New List.
To create a new Symbol List, select Create New List on the bottom right-left side.
Give your new list a name, then click OK.
Now, the Edit Symbol List window will open.
There is no limit to the number of symbols you can add to a symbol list. The program will automatically convert all added symbols to the upper case, remove duplicates and sort the list alphabetically.
Typing
You can enter stocks manually by typing.
Copy & Paste from document
You can copy & paste symbols from any document. The symbols should be added one line per symbol, in upper or lower case.
Copy & Paste from Scan
You can also copy & paste selected symbols or entire symbol columns from your scans. To do this, first go to the Toolbar, select Tools, Options, and then General. Here, uncheck Highlight grid row upon selection.
By default, the entire row is highlighted when you select a column in the scan. Unchecking this option will enable you to highlight individual columns.
Now, go to your scan and highlight the symbols you would like to add to your Symbol List.
Thereafter, copy the data by using the Windows copy command, pressing the Control and C keys on your keyboard.
Now, go back to your newly created Symbol List and paste the symbols into it using the Windows paste command, pressing the Control and V keys on your keyboard.
Upload from File
In addition to manually adding stock symbols, you also have the option to upload a text file from your local PC by choosing Load from File. Please note, that this will overwrite any already added symbols.
If you would like to upload additional symbols to an already existing Symbol List, choose the option Insert From File instead.
Download Symbol List to PC
To save a copy of your Symbol list to your local PC, select the Save to File option.
Once you have added your symbols, hit OK.
Your newly created Symbol List will now appear in the Add Existing List of the Symbol List Tab within the Config Window of your scan, where you can choose to include or exclude its symbols.
Add more symbols via Send to XYZ feature
To add more symbols to any of your existing Symbol Lists, on the fly, from any of your scans or charts, just right-click, then choose the stock ticker you would like to add, select Send to, and then Symbol Lists from the dropdown.
Thereafter, choose a specific Symbol List to add the stock to from the following dropdown menu.
If you have recently sent a symbol to any of the lists, it will be bold. To remove this visual highlight, select Clear Recent List and click Yes.
To start an entirely new Symbol list or edit your Symbol lists, select the option, Manage Symbol Lists. This will bring you to the main Symbol List Configuration Menu, where you can create, edit, copy, rename, and delete your symbol lists. You can also access the main Symbol List Configuration Menu from the Toolbar. Just go to the Tools Tab and select Symbol Lists.
In addition to accessing your Symbol Lists from within our software, you can also find them on your Account Management Page, on our Website. Here, you can also edit, delete or create entirely new symbol lists.
Columns Tab
The columns displayed in your window can be reorganized via left-click drag and drop. The individual columns can also be extended or compressed by using your mouse. To add more viewable columns to your Window, right-click, select Configure and open the Columns Tab.
The Columns Tab enables you to define, which of the filter columns you would like to visually display in your Top List Window. Please note, the Windows Specific Filters Tab defines which filters you apply to your scan, whereas the Columns Tab simply defines which of these filters will be displayed as columns in your window.
The field on the left-hand side lists the already displayed columns. The right-hand side contains all the available filters that can be selected for display in your scan.
Select additional columns from the field on the right-hand side by highlighting them with a mouse click. Then, click the arrow pointing to the left to move them to the Selected Columns field.
To remove any of the already selected columns, highlight the column, then click the arrow pointing to the right.
To only see the filters that are part of your strategy, press the Hide Unused button. Choose Add Defaults to see the list of filters that are generally used. You can add more filters by pressing the More Button and then using the Search function. Highlight a filter you would like to add, then press the Show Column button at the bottom. The chosen filter will automatically be added to the Selected Columns list.
Click OK when you are done, or jump to one of the other tabs to adjust your scan further.
Symbol Plus Column
The Symbol Plus Feature enables our users to condense some of the stock's key data into one single column.
It is available in Alert, Top List and Multi-Strategy Windows, as well as in the Premium AI Strategy Trades Window.

To enable Symbol Plus, right-click into the header of the symbol column of your scan.
A dropdown with the following options will appear:

The option Normal will display the following info in the symbol column:
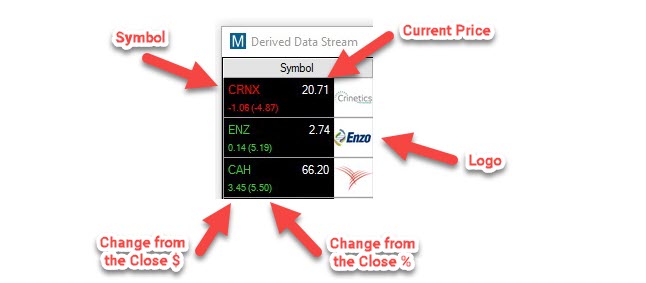
-
The company's symbol
-
The stock's current price
-
The Change from the Close in $
-
The Change from the Close in %
-
The company's logo
The option Logo Only will display the following way:
The option No Logo will display the following info in the symbol column:
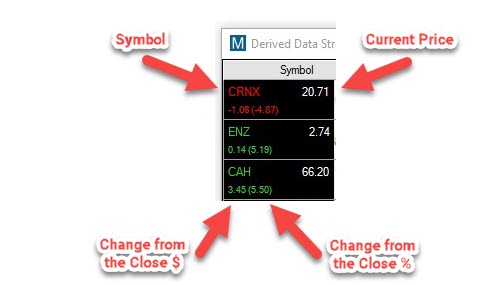
-
The company's symbol
-
The stock's current price
-
The Change from the Close in $
-
The Change from the Close in %
The option Symbol/Logo will display the following info in the symbol column:
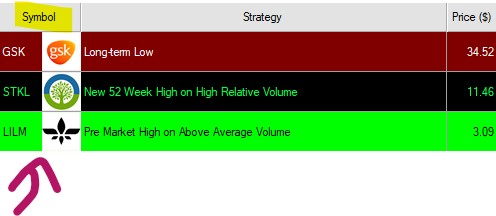
The option Off will show the traditional symbol column.

Sort Tab
The Sort Tab of the Top List Config Window, dictates the so-called Server Sort.
Right-click into the window, select Configure and open the Sort Tab.
Choose a filter, then select the Sort direction, either Biggest on Top or Smallest on Top.
To only see the filters that are part of your strategy, press the Hide Unused button. Choose Add Defaults to see the list of filters that are generally used. You can add more filters by pressing the More Button and then using the Search function. Highlight a filter you would like to add, then press the Sort By button at the bottom. The chosen filter will automatically be added to the Sort Tab. Highlight it, to use it as the Server Sort Filter.
Click OK when you are done.
Your Top List will now automatically show the top results based on your Server Sort Filter. By default, a Top List will return the 100 top results. You can increase the Record Count to show up to 1000 results at once. To do so, right-click into the Top List Window, select Time Frame and then Set Record Count.
The Server Sort Filter can also be chosen or changed directly in the Top List Window. Simply right-click on the filter header you would like to sort by and select Server Sort on filter XYZ. This will open the Sort Tab of the Top List Config Window where you can confirm your choice and set the Sort Direction.
Once you have defined your Server Sort Filter, you have the option to use an additional Sort Filter to order the top results that the server found. To do so, right-click on the filter header you would like to add as the secondary Sort Filter and select Sort by filter XYZ Ascending or Sort by filter XYZ Descending. The Server Sort Filter has already been applied, so the secondary filter will only re-order those results. To switch back to Server Sort, right-click on any column header and select Use Server Sort.
Another option, to apply the secondary filter, is to simply double-click on the filter header, which you would like to sort your top results by. The column, the Top List is sorted according to, will depress.
Summary Tab
The Summary Tab gives you an overview of your configured strategy, and the opportunity to change its name. To access it, right-click into the Top List Window, select Configure, and then open the Summary Tab. Enter or change the name of your strategy in the Window Name field. Below, you will find a summary of your current strategy. All the filters in use are displayed, together with a short description. To edit any of them, either right-click, to bring up a popup menu with options, or click on them, to go directly to the Windows Specific Filters Tab. Once you've reviewed your settings, hit OK to open and run the newly configured Top List Window.
Time Frame
The Time Frame function enables you to define when your Top List Window will be active. You can choose between Live During Market Hours, which means from 9.30 am to 4.30 pm Eastern Time, or Live Always, which then includes Pre- and Post-Market.
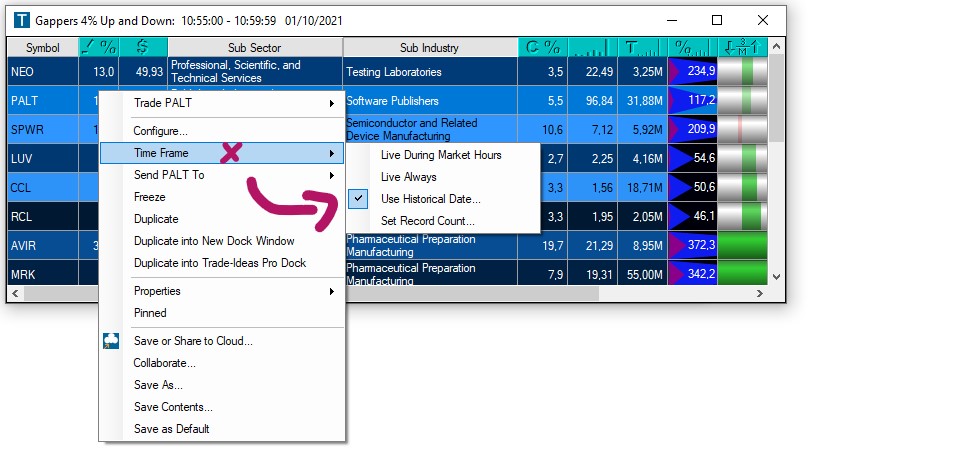
In addition to that, you can go back in time around 60 days by selecting Use Historical Date and then choosing a Date and Time. Press the OK button and you will see the Window will fill with historical data. The caption of the Top List Window will be updated to show the historical date and time period on display. The Top List Window will show a 5-minute time frame.
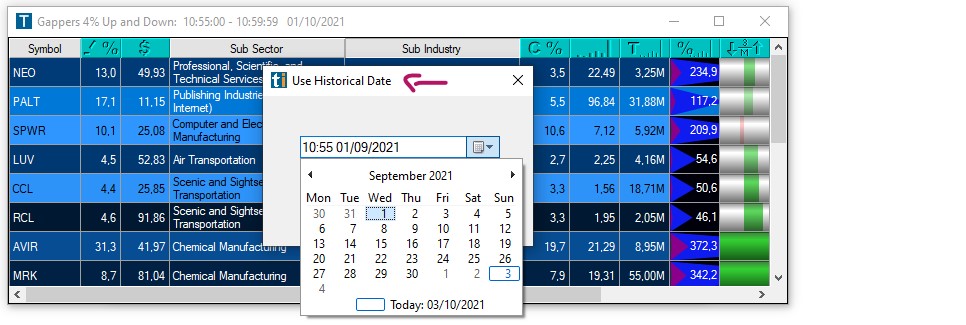
By default, a Top List will return the 100 top results. You can increase the Record Count to show up to 1000 results at once. To do so, right-click into the Top List Window, select Time Frame, and then Set Record Count.
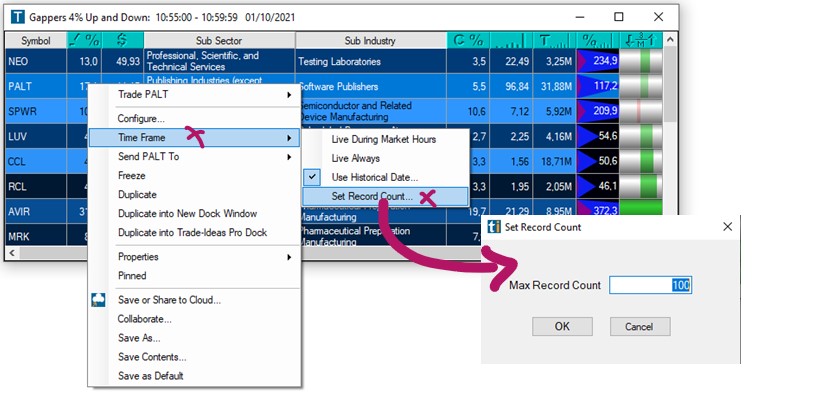
Send XYZ to…
The Send To Feature enables you to look up more info for a stock or share it with others. This feature is available in most Trade Ideas Windows, namely Charts, Top Lists, Alert, and Multi-Strategy Windows as well as Price Alerts and AI Strategy Trades Windows.
Simply highlight a symbol, then right-click and select, Send XYZ to... where XYZ stands for the chosen stock symbol.
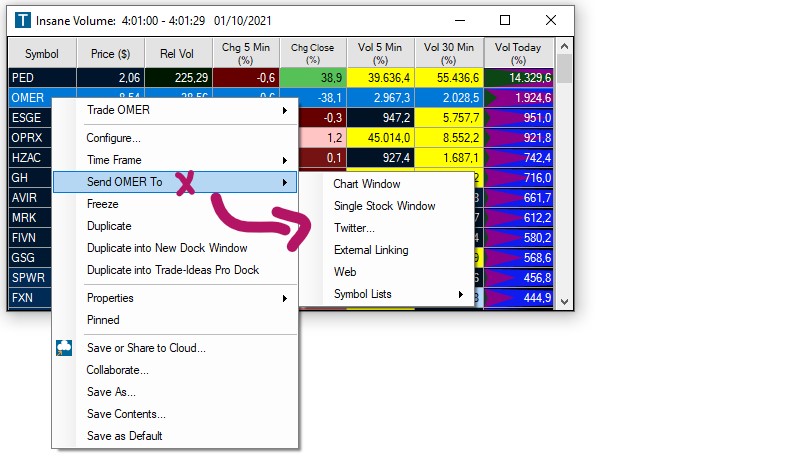
You can choose to send the chosen symbol to a new Chart Window, or a new Single Stock Window.
In addition to that our Send To Feature lets you share the stock with your followers on Twitter. Enter your message, and if you would like to share the Alert as well as the Strategy, check the box, Include Strategy Config in Message. Thereafter click, Tweet Now.
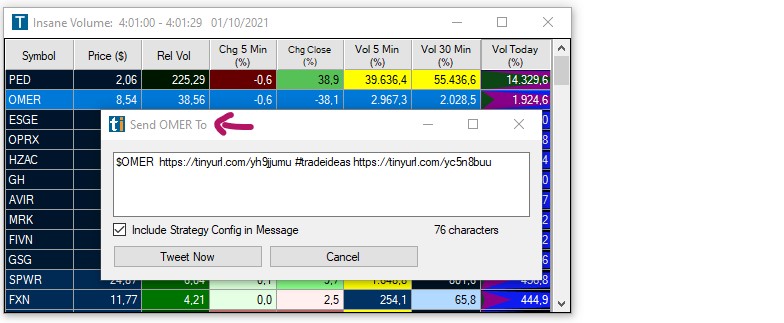
If you haven’t connected to Twitter yet, the Twitter Authorization Window will open. Enter your Twitter username and password, then click Authorize app. After logging in, copy the received PIN into the box on the bottom left-hand side. Then click, Confirm.
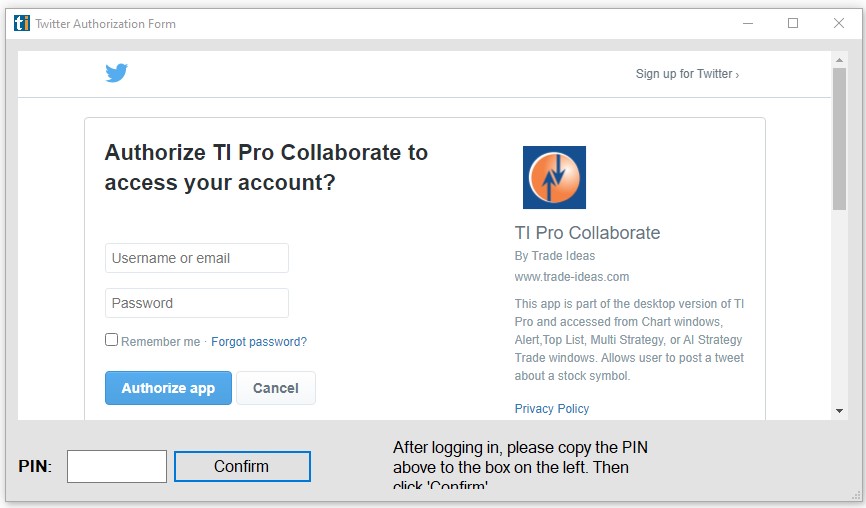
You can also send a symbol to an already externally linked target platform.
If you have not established External Linking yet, the External Linking Window will open and enable you to Add a Link.
With external linking enabled, any symbol you click on within Trade Ideas will automatically load in an external platform like your charting or brokerage app. This is a good way to connect to a lot of different applications.
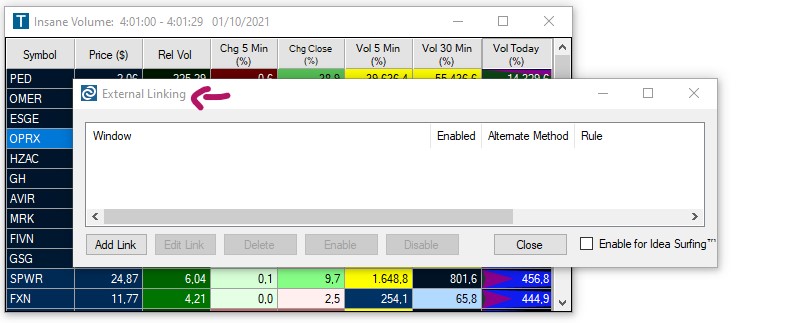
A further tutorial will discuss External Linking in more detail.
Another option is to send the stock symbol to the Web. By selecting send to Web, you can find info about the particular stock on Yahoo, Finviz, StockCharts, BigCharts, as well as other web-based platforms, and conduct further research.
If you check the option, Use Symbol Linking, and leave the particular web-based platform open, it will automatically load every symbol you select in your scan on the web-based platform as well. This way, you will get an instant internet look-up for every symbol that you’re interested in.
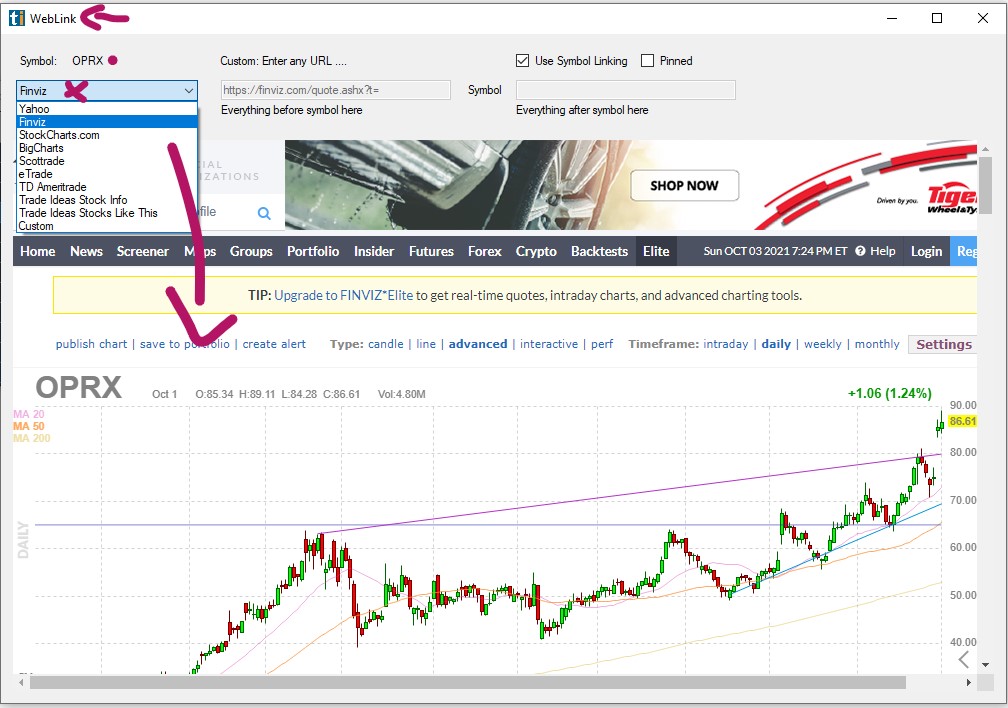
In addition to the sites in the selection menu, you can select Custom to add a different web-based platform. If this platform requires a login, log into the web-based platform first. Then, have a look at the URL when you are logged in to your web destination. Copy this URL, and split it where the symbol is mentioned. Enter the part of the URL before the symbol, into the first section, and the part after the symbol in the next section.
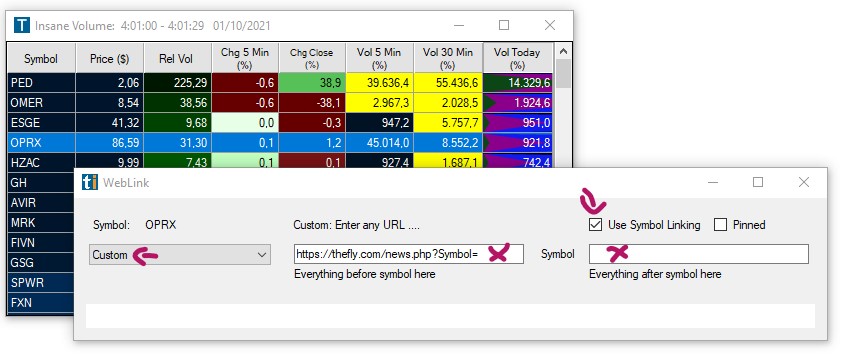
Lastly, you can send the stock symbol to one of your existing Symbol Lists. Or even create a New List to add the symbol to.

Send XYZ to Symbol List
The Send To Feature allows you to add stock symbols to a so-called Symbol List or Watchlist. A Symbol List is useful if you would like to include or exclude certain stocks from your scans.
To add more symbols to any of your existing Symbol Lists, on the fly, from any of your scans or charts, just right-click, then choose the stock ticker you would like to add, select Send to, and then Symbol Lists from the dropdown.
Thereafter, choose a specific Symbol List to add the stock to from the following dropdown menu.
If you have recently sent a symbol to any of the lists, it will be bold. To remove this visual highlight, select Clear Recent List and click Yes.
To start an entirely new Symbol list or edit your Symbol lists, select the option, Manage Symbol Lists. This will bring you to the main Symbol List Configuration Menu, where you can create, edit, copy, rename, and delete your symbol lists. You can also access the main Symbol List Configuration Menu from the Toolbar. Just go to the Tools Tab and select Symbol Lists.
Head to the Symbol Lists section to learn all about how to create and edit Symbol Lists.
Symbol Linking
Most Trade Idea Windows, including Alert, Top List, Multi-Strategy, and Compare Count Windows as well as the Holly AI Windows, RBI, GBI, and Price Alerts can be symbol-linked to a Chart or Single Stock Window.
This means that when changing your windows stock symbol, your symbol-linked Chart or Single Stock Window will automatically change as well, and display the specific stock’s data.
By default, all symbol-linked free-floating Windows belong to the blue, Link to All, Color Group.
By default, all docked Windows are assigned to the pink, Dock Window, Linking Group. In "Pink Mode" only the menu items contained in the indiviual dock respond to symbol changes.
The assigned color group will always be displayed in the top left-hand corner of each window.

You can create up to 4 additional Linking Groups and by doing so, link selected windows to a specific Chart or Single Stock Window, which is very useful when monitoring various scans.
There are two ways to create a Linking Group:
- Option 1
You can assign windows to a specific color group individually.
To do so, right-click into your window, select Symbol Linking, and choose a color from the dropdown. The selected window will now display the Color Group in the top left-hand corner.

To enable Symbol Linking for a Single Stock Window, right-click into it, and select Symbol Linking.
Then, add a Checkmark to the left-hand side of the Symbol Linking option.

To enable Symbol Linking for a Chart, right-click into it, select Properties, and then Symbol Linking. Now, add a Checkmark to the left-hand side of the Symbol Linking option.

- Option 2
To establish a Linking Group for a number of windows at once, go to the Toolbar, open the Tools Tab, and select, Symbol Linking Groups.

The next window will display all the Trade Ideas windows currently in use.

By default, each free-floating window is assigned to the blue, Link to All, Linking Group.
By default, each docked window is assigned to the pink, Dock Window, Linking Group. In "Pink Mode" only the menu items contained in the indiviual dock respond to symbol changes.
To establish a new Linking Group, select the windows that will be part of the new Linking Group by adding a checkmark.
You can select all windows at once by choosing, Select All, at the bottom.

You can clear your selection by selecting, Clear Selected, at the bottom.
Once you have selected the windows, open the Link Groups dropdown in the top left-hand corner. Select a color for your new Linking Group, then choose, Set All Selected, to assign the windows.

All the selected windows will now display the color of the Linking Group you have assigned them to.
To see all windows that are assigned to a specific Linking Group, choose the Group Color from the Link Groups dropdown, then select, Filter By. To see all available windows, select, Clear Filter.

Once you have assigned the windows, select Close.
All the windows that you assigned to a Linking Group will now display the Group Color in the top left-hand corner.
Any Single Stock Window or Chart that has been assigned to the same Color Group will update accordingly, whenever you change a stock symbol in one of the other Linking Group windows.
Please note, that even when a Single Stock Window and Chart have been assigned to a specific color group, they will always also be linked to the Blue Color Group since this is the default Link to All Group. This means in turn that any window that is assigned to the blue linking group will be linked to all open Single Stock Windows and Charts.
Freeze
Top List Windows have a 30-second refresh cycle, so they update much slower than our real-time Alert Windows. Alerts always come in at the top, which makes them easy to see, whereas changes in a Top List Window can happen in any column. To ease analysis, Top List Windows have a Freeze Function. To enable it, right-click into the window, and check Freeze. Once Freeze is enabled, the filter column headers turn blue. When frozen, the Top List Window does not refresh, so the data does not change. As soon as you unfreeze it, it will update and present the latest data immediately.
Duplicate
To copy your current Trade Ideas Window, use the Duplicate function. Simply right-click into your Top List Window and select Duplicate from the dropdown. You will get an exact copy of the current window, which you can modify while keeping the original window intact.
Duplicate into New Dock Window
To open a copy of a free-floating window in a new Dock, right-click into the free-floating window and select Duplicate into New Dock Window. An exact copy of your free-floating window will now be opened in a new Dock.
Duplicate into XYZ Dock
To load a copy of a free-floating window into an already open Dock, right-click into the free-floating window and select Duplicate into XYZ Dock, where XYZ stands for the Name of that particular Dock. An exact copy of your free-floating window will now be added to the chosen Dock.
Properties
Each Top List Window has a Properties Menu that enables you to modify the visual appearance of the window itself as well as the data within it.
Show Strategy Menu
The Show Strategy Menu option allows you to add the list of preconfigured strategies that you can find in the Config Window as a dropdown menu to the top left-hand side of the scan window.
Show Cylinder Score
The Cylinder Score Feature is measuring and graphically displaying the number of symbols that are above and below a certain threshold. If you hover over the Cylinder at the bottom of your Top List Window, a popup will display the filter, the stocks are scored on, the defined filter threshold, the number of stocks below and above this defined threshold, as well as the total number of stocks measured.
To enable the Cylinder Score, right-click into your Top List Window, select Properties, and then Show Cylinder Score. The Cylinder Score will now be added to the bottom of your Top List Window.
To configure it, right-click into the cylinder and select the Score Filter of your choice.
The default Threshold is set to 0. To adjust it, right-click again and select Set Custom Threshold. As an example, you could choose Price as the Score Filter and set the Threshold to $25 to see, how many stocks in your Top List are priced above and how many are priced below $25.
Text Headers
The Text Headers option allows you to adjust the way the column headers are displayed. By default, the column headers will show the filter names. To display filter icons instead, right-click select Properties and uncheck the Text Headers option. If you hover over the icons, the filter names will, however, always pop up.
Select Colors
Top List Windows have more color capabilities than Alert Windows. Here, you have two options, you can either color entire grid rows based on one filter or color each filter column separately.
Option 1: Color the entire grid row
To color the entire grid row, right-click into the Top List, select Properties, and then Select Colors. This will bring up the Top List Color Chooser Menu.
The left-hand side displays the current color scheme in use. With each color representing a numeric value, the color gradually changes as the value ascends and descends.
At the center, you'll see 7 pre-configured color palettes, each with 5 numerical placeholders. The placeholders could represent different percentage intervals in case of a Change from Close filter, or Dollar amounts, or Share numbers. It is entirely up to you to define the values and color code them.
Selecting one of the color palettes will change the color scheme of your Top List.
The preconfigured color palettes and numerical placeholders are optional, you can add as many numerical values and colors as you like.
Top right, a dropdown menu shows all available filter columns.
Use the search box below the drop-down list to find a particular filter.
The Top List Window will turn white if you highlight a filter, not in the Top List.
Highlight the filter column you would like to define a color scheme for.
Use the text field above the Add/Edit button to enter a new numeric value.
You can set each numeric value to have the same color by choosing the equal symbol or use the less than, equal, and/or greater than symbols to differentiate even further. Once you have made your selection, press the Add/Edit button.
To change the color scheme of an existing numeric value, highlight it. Once selected, an arrow will appear on the right-hand side.
Change the color by selecting the equal, less than, or greater than symbol, then select a color from the popup menu and hit OK. Then press Add/Edit.
To change the current color order, select the Flip Colors button.
To remove a numeric value and associated color scheme, highlight it and select the Delete button.
To remove the entire current scheme and start from scratch, select the Delete All button.
To undo changes and go back to a previous color scheme, select it from the Select recent or suggested settings field at the bottom left-hand side.
Hit OK when you are done.
Option 2: Color individual filter column
To assign a color to an individual filter column, right-click the text header of the particular column in your Top List and select Custom Colors for XYZ. This will bring up the Top List Color Chooser Menu.
The field on the top right-hand side shows the chosen filter column.
The left-hand side displays the current or last color scheme in use.
With each color representing a numeric value, the color gradually changes as the value ascends and descends.
At the center, you'll see 7 pre-configured color palettes, each with 5 numerical placeholders. The placeholders could represent different percentage intervals in case of a Change from Close filter, or Dollar amounts, or Share numbers. It is entirely up to you to define the values and color code them.
The preconfigured color palettes and numerical placeholders are optional, you can add as many numerical values and colors as you like.
Use the text field above the Add/Edit button to enter a new numeric value.
You can set each numeric value to have the same color by choosing the equal symbol or use the less than, equal, and/or greater than symbols to differentiate even further. Once you have made your selection, press the Add/Edit button.
To change the color scheme of an existing numeric value, highlight it. Once selected, an arrow will appear on the right-hand side.
Change the color by selecting the equal, less than, or greater than symbol, then select a color from the popup menu and hit OK. Then press Add/Edit.
To change the current color order, select the Flip Colors button.
To remove a numeric value and associated color scheme, highlight it and select the Delete button.
To remove the entire current scheme and start from scratch, select the Delete All button.
To undo changes and go back to a previous color scheme, select it from the Select recent or suggested settings field at the bottom left-hand side.
Hit OK when you are done.
Small Borders
From the right-click menu, you can select Small Borders. This makes the border surrounding the window smaller than the default window view. With this option enabled, you can make the window much more narrow than with regular borders. If you have limited screen space, this can help to make the use of it more efficient. You could, for example, resize your window to only show the symbol column.
Graphical Indicator
Graphical Indicators can be used to display the performance of stocks, in a quick-to grasp visual format. They can be used for all Position in Range Filters. These visually enhanced filter columns can be placed anywhere inside of a window.
When the indicator shows green, and when the green bar moves towards the right, it signals that the stock's current price is moving towards the high of the range.
If the indicator is red, it means, that the stock price is closer to the low of the range.
A lot of grey, on the other hand, signals that the stock is currently trading near the middle of its range.
To see the underlying percentage value, hover your mouse over the Graphical Indicator.
To switch between the graphical indicator and a numerical value, right-click into the specific Position in Range column, that you would like to change, select Properties, and Then check or uncheck the option, Graphical Indicator. This option is only available for the Position in Range filters, it will be greyed out for any other filter.
Pinned
To keep a single Trade Ideas window on your screen permanently, even when switching layouts, or toggling through channels, right-click into the specific window, and select Pinned from the dropdown. The Pinned Feature, is available for all Trade Idea Windows, including Scans, Charts, Compare Count, and the Holly AI Windows.
Once a window is pinned, it does not follow the behavior of the other windows.
This is useful if you would like to include one or more windows of a channel in a custom layout, without saving the individual windows to the Cloud first.
It is important to note, that this window will stay open until you decide to unpin it. When accidentally saved within a layout, It might load multiple times, when closing and re-opening this layout. At worst, you will have multiple versions of the window all running on top of each other in the same position. This can put a strain on system resources and drastically impact software performance. The pinning option should therefore be used very carefully and consciously. A window should always be unpinned after the desired action is completed.
To do this, right-click into the window and remove the checkmark on Pinned.
To see all pinned and unpinned windows, or to close them, go to the Toolbar, select Windows, and choose, Close All Unpinned, or Close All Pinned.
Save or Share to Cloud
Once you have created your own scan or have changed the settings of a preconfigured scan, make sure to save it to the cloud for future use.
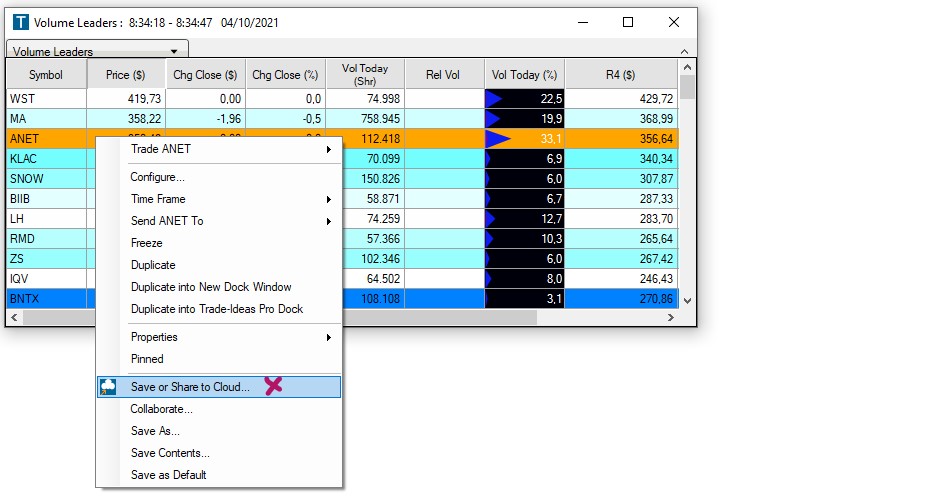
1. Right-click into the window and select Save or Share to Cloud
2. Enter a new name into the Name field or keep the automatically added one.
3. Enter a description for your new scan or leave the Description field blank.
4. If you would like to automatically close any other open layout or channel in the future, whenever you load this new scan, select Clear Previous Layout.
If you would like to load this scan on top of any already opened layout, leave this checkbox blank.
5. Select Save when you are done or select Save and Share to share the scan with others before saving it to the cloud.
6. There are various sharing options:
-
Scan the QR code
-
Select Copy All, to save the Cloud link to your clipboard and paste it into an email or messaging app.
-
Click the Twitter icon and include a text message if you like. If you haven't connected Trade Ideas to Twitter yet, a Twitter Authorization Form will open. Log in with your Twitter username and password. Then click, Authorize App. Thereafter, copy the displayed Pin Code into the field at the bottom left-hand side of the window and select Confirm.
7. Select OK when you are done.
Your new scan is now stored in your cloud, from where it can easily be retrieved. Just go to the Toolbar, open the File Tab and choose Load from Cloud. To find a saved scan, you can enter its name in the search field, or scroll through the list. Just highlight your scan, then choose Load.
Collaborate
QR Codes
The Collaborate Feature enables you to export your strategies to your phone. Just right-click into your Alert, Top List, or Multi-Strategy Window and select Collaborate.
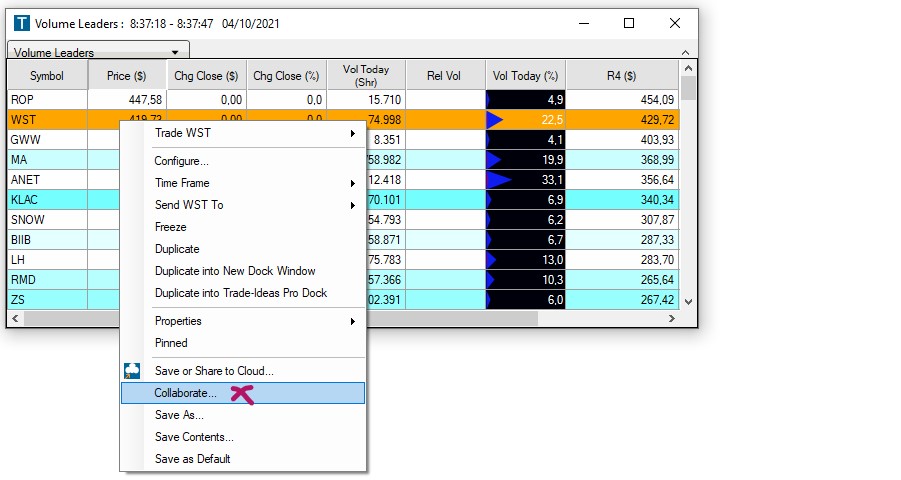
You can scan the displayed code with any QR reader app available on your phone. Thereafter, you can share it with others. If you choose to open the scanned URL on your phone, it will bring you to our website, where you can see the scan settings and real-time data output when logged in. If you follow the recommended link to our HTML5 page, you will be redirected to our latest Web Version. Once logged in, the particular scan will load immediately.
Social Media/Twitter
The Collaborate Feature also enables you to share your Alert, Top List, and Multi-Strategy on Twitter. Right-click into your Alert, Top List, or Multi-Strategy Window and select Collaborate. Here, enter a text message if you like. Thereafter, click the Twitter icon. If you haven't connected Trade Ideas to Twitter yet, a Twitter Authorization Form will open. Log in with your Twitter username and password. Then click, Authorize App. Thereafter, copy the displayed Pin Code into the field at the bottom left-hand side of the window and select Confirm. You will only need to do this once. Thereafter your Tweets will be sent immediately.
Copy & Paste
The Collaborate Feature enables you to share your scans via copy and paste. Simply right-click into your Alert, Top List, or Multi-Strategy Window and select Collaborate. Then, choose Copy All, to save the collaboration link to your clipboard and paste it into an email or messaging app.
Create a New Alert or Top List Window
The Collaborate Feature enables you to create an entirely new scan by loading a collaboration link into an existing Alert or Top List Window.
This is useful when you have received a collaboration link from a colleague or would like to use one of the collaboration links of a scan on our website. Simply right-click into your Alert or Top List Window and select Collaborate. Delete the existing URL in the field at the top, then paste your collaboration link into it. Thereafter, hit OK. This will erase the old setting and your Alert or Top List Window will now contain the new strategy. Make sure to save it to your cloud for future use. Just right-click and select Save or Share to Cloud.
Create a Multi-Strategy Window
The Collaborate Feature enables you to create Multi-Strategy Windows. A Multi-Strategy Window allows you to combine multiple independent Alert Windows into a single space-saving container window, each with its own unique alert and filter configurations.
To create a new Multi-Strategy Window, go to the Toolbar, open the New Tab, and select Multi-Strategy Window from the dropdown. This will open a blank window, into which you can now insert your individual Alert Windows.
To add new strategies to a Multi-Strategy Window, right-click into the Alert Window, you would like to add, and select Collaborate. Choose Copy All in the popup window. Next, right-click into the Multi-Strategy Window, select Strategies, New Strategy, and then Collaborate. Now, select Paste All. Your Alert Window will now be part of the Multi-Strategy Window. You can repeat this process to add further strategies.
Turn a Top List Window into an Alert Window
The Collaborate Feature enables you to turn a Top List Window into an Alert Window. This feature is particularly useful when you would like to backtest a strategy that includes the filters of a specific Top List Window. This way, you don’t need to add the filters one by one to an Alert Window, but can transfer the entire Top List to an Alert Window.
To turn a Top List into an Alert Window, right-click into the Top List Window and select Collaborate. Then choose Copy All. Thereafter, go to the Toolbar, open the New Tab, and select Alert Window. In the Alert Config Window, go to the top left-hand corner and double-click Start from Scratch, then hit OK. Ignore the error popup and select No. Thereafter, a new Alert Window with the Heartbeat as a placeholder will open up. Next, right-click into the Alert Window, select Collaborate and then Paste All. Thereafter, the Alert Window will contain all the filters of the Top List Window. Just right-click, select Configure and open the Summary Tab to see the new settings. Since the heartbeat is a default placeholder that just pings the server every couple of minutes to look for symbols satisfying the filters without the need for a specific event, you should go ahead and select an Alert, for example, a New High, for your new scan. To do so, right-click into the scan, select Configure, open the Search Tab and choose any Alert you would like.
Add Strategies to a Compare Count Window
The Collaborate Feature enables you to add two strategies to a Compare Count window. Typically, the Compare Count Window is used to visually compare a bullish against a bearish strategy. By default, it compares New Highs versus New Lows. It is a great visualization tool that can provide an indication of what the markets are up to. If you wish to compare one of your bullish and bearish strategies to one another, right-click into the Alert Window, you would like to add and select Collaborate. Choose Copy All in the popup window. Next, go to the Toolbar, open the New Tab, and select Compare Count Window. Now, select Collaborate in the Green Data field on the left-hand side to add a bullish strategy or in the Red Data field on the right-hand side to add a bearish strategy. Choose Paste All in the popup menu, then hit OK.
To add the second strategy, right-click into the Alert Window, that you would like to add and select Collaborate. Then select Copy All.
Now, right-click into the Compare Count Window and select Configure. Choose Collaborate in the Compare Count Config Window, then select, Paste All.
Your bullish and bearish Alert Windows will now be part of the Compare Count Window.
Save As
Apart from saving your windows to the cloud, you can also save them to your local PC in order to create a backup. This is especially useful if you have spent a lot of time and effort customizing your scans and layouts. Just right-click into your window and select Save As from the dropdown. This will bring up the standard Save file dialog. Enter a name for the file and choose a folder to save it to. By default, it will be saved in your local TradeIdeasPro folder. Lastly, press the Save button.
To load these .WTI files, open the File Tab of the Toolbar, and select Load Window.
Save Contents
To save all the displayed data of an Alert, Top List, or Multi-Strategy Window, as a CSV file on your PC, right-click and select Save Contents.
The standard Save file dialog will be displayed. Enter a name for the file, choose the file type and file folder, then press the Save button.
To manually transfer column entries into a spreadsheet, highlight the rows either by clicking and holding down your left mouse key while moving over the rows or by pressing the Control and A key on your keyboard. To copy your selection, press Control and C. Finally, press the Control and V key to paste the selected rows into your spreadsheet.
To highlight entire rows with one mouse-click, Go to the Toolbar, select Options, General, and then, Highlight grid row upon selection.
To be able to highlight single columns, leave this option unchecked.
Save as Default
You can save a window and its configuration as the default version of this window type by right-clicking and choosing Save As Default. Whenever you now open a new window of this type from the New Tab of your Toolbar, the window configuration that you saved as default, will load.
The Load Window option, which you can find in the File Tab of the Toolbar, provides access to all the default versions of your Trade Ideas windows. The default layouts of your Chart, Single Stock, Brokerage Plus, and AI Windows are saved in the TradeIdeasPro folder on your local computer.
Alert Logging
When Alert Logging is enabled, the incoming alerts will automatically be added to a CSV file which is stored in the TradeIdeasPro folder on your PC:

Alert Logging needs to be enabled in two places:
In the The Toolbar:
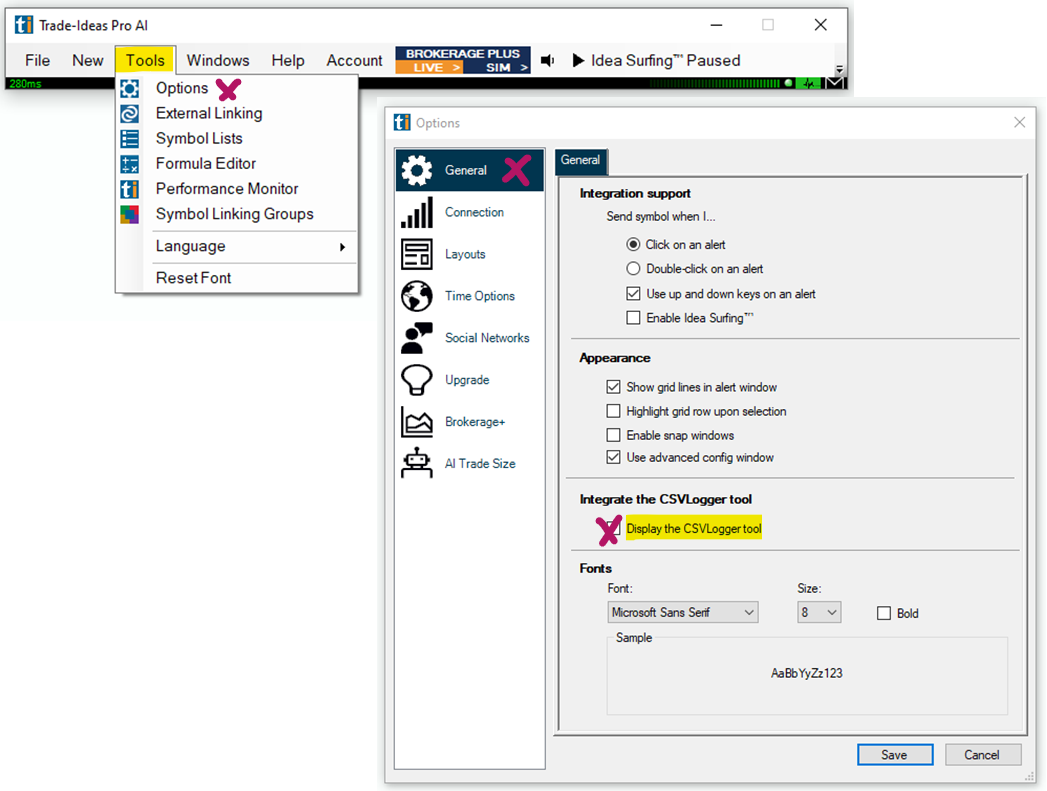
And in the individual Alert/Top List Window:
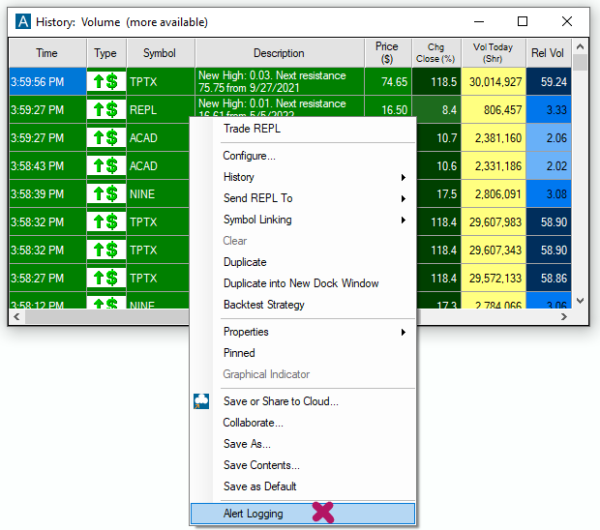
Multi-Strategy Window
A Multi-Strategy Window allows you to combine multiple independent Alert Windows into a single space-saving container window.
Each strategy can contain its own unique alert and filter requirements and can be color-coded for easy differentiation.
Each Multi-Strategy Window will display an M on the top left-hand side of the window. As new signals arrive, they stream in real-time. For easy visual differentiation, the color scheme for each strategy can be customized.
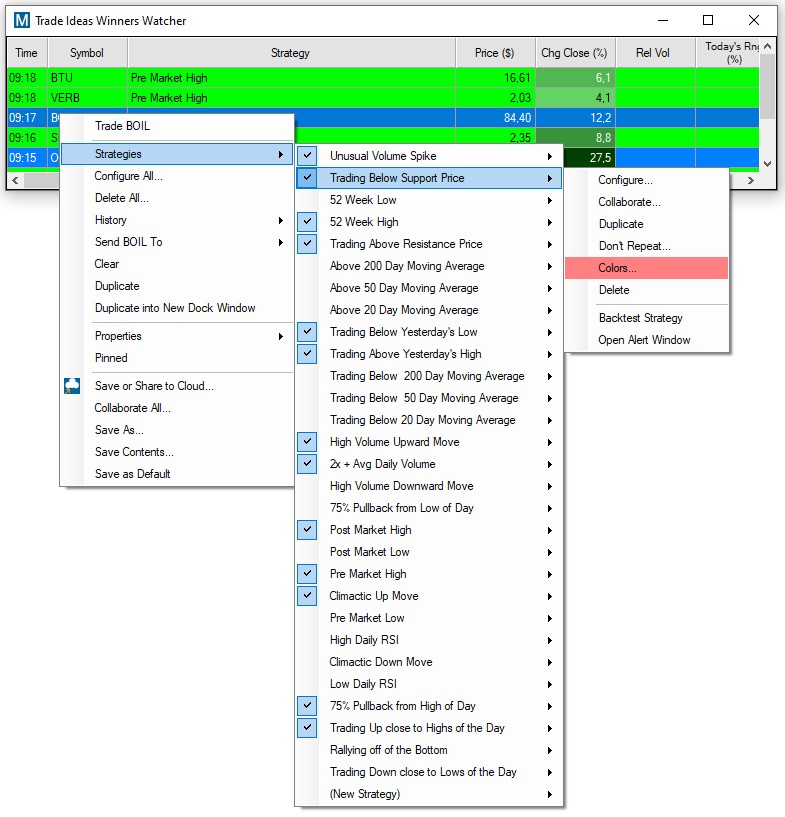
Trade XYZ
You can trade stocks right from your scans and charts via our One-Click Order Feature. Simply right-click into the scan or chart and select Trade to bring up a dropdown menu with preconfigured order templates.
How to create a custom Order Entry Template:
Strategies
To create a new Multi-Strategy Window, go to the Toolbar, open the New Tab, and select Multi-Strategy Window from the dropdown.
This will open a blank window, into which you can now insert your individual Alert Windows.
To add new strategies to a Multi-Strategy Window, right-click into the Alert Window, you would like to add, and select Collaborate.
Choose Copy All in the popup window. Next, right-click into the Multi-Strategy Window, select Strategies, New Strategy, and then Collaborate.
Now, select Paste All. Your Alert Window will now be part of the Multi-Strategy Window.
You can repeat this process to add further strategies.
Checkbox Function (Selected Strategy)
The Checkbox function enables you to easily turn selected strategies on or off temporarily.
Simply right-click into the Multi-Strategy Window, select Strategies, then check or uncheck a selected strategy from the strategies dropdown.
While disabled, the selected strategy won't trigger inside the window.
Configure (Selected Strategy)
You can change the settings of an individual strategy within the Multi-Strategy window.
To configure one of its strategies, right-click into the Multi-Strategy Window, select Strategies, then choose a specific Strategy and select Configure from the dropdown.
The Config Menu of each individual strategy is identical to that of an Alert Window.
Collaborate (Selected Strategy)
The Collaborate Feature enables you to export or share selected strategies of your Multi-Strategy Window.
Simply right-click into your Multi-Strategy Window, select Strategies, then choose a specific Strategy and select Collaborate from the dropdown menu.
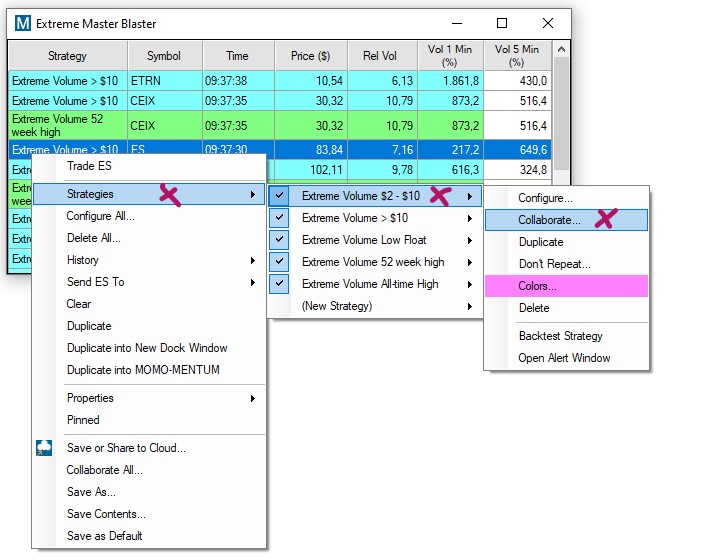
QR Codes
You can scan the displayed code with any QR reader app available on your phone. Thereafter, you can share it with others. If you choose to open the scanned URL on your phone, it will bring you to our website, where you can see the scan settings and real-time data output when logged in. If you follow the recommended link to our HTML5 page, you will be redirected to our latest Web Version. Once logged in, the particular scan will load immediately.
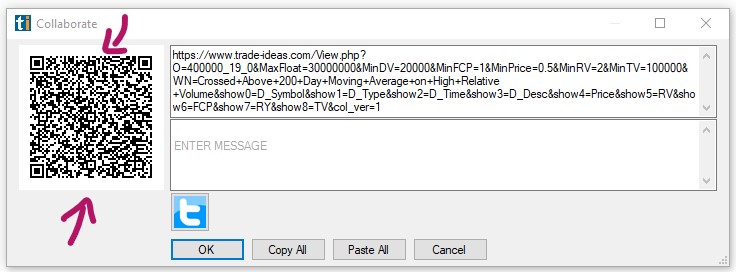
Social Media/Twitter
The Collaborate Feature also enables you to share your strategies on Twitter. Simply right-click into your Multi-Strategy Window, select Strategies, then choose a specific Strategy and select Collaborate from the dropdown menu.
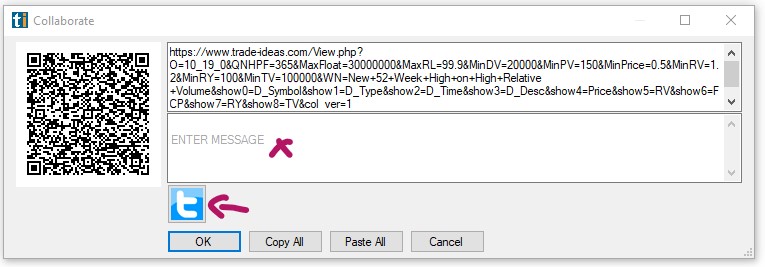
Here, enter a text message if you like. Thereafter, click the Twitter icon. If you haven't connected Trade Ideas to Twitter yet, a Twitter Authorization Form will open. Log in with your Twitter username and password. Then click, Authorize App. Thereafter, copy the displayed Pin Code into the field at the bottom left-hand side of the window and select Confirm. You will only need to do this once. Thereafter your Tweets will be sent immediately.
Copy & Paste
The Collaborate Feature enables you to share your scans via copy and paste. Simply right-click into your Multi-Strategy Window, select Strategies, then choose a specific Strategy and select Collaborate from the dropdown menu. Then, choose Copy All, to save the collaboration link to your clipboard and paste it into an email or messaging app.
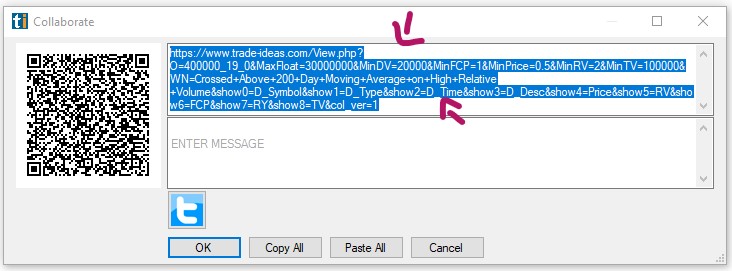
Duplicate (Selected Strategy)
You can Duplicate a selected Strategy within a Multi-Strategy Window.
To do so, right-click into the Multi-Strategy Window, select Strategies, then choose a specific Strategy and select Duplicate from the dropdown.
Thereafter, the selected strategy will be listed twice in the Multi-Strategy Window. This function is particularly helpful when you would like to Flip a bearish or bullish strategy and use it together with its counterpart in the same Multi-Strategy Window. You can easily do so, by selecting the duplicated strategy, choosing Configure, and then Flip.
You could just as easily also adjust the settings of the duplicated strategy in different ways via the Configure option.
Don't Repeat (Selected Strategy)
The Don’t Repeat Feature is useful when your strategy displays many alerts for the same symbols in fast progression.
This function helps to filter these repeated symbols.
To access the Don’t Repeat Feature, right-click into the Multi-Strategy Window, select Strategies, then choose a specific Strategy and select Don’t Repeat from the dropdown.
Now, you can select a time period, in which a symbol won’t be repeated, or choose not to repeat symbols at all.
To define a Don’t Repeat Period for symbols within the Multi-Strategy Window, right-click into the Multi-Strategy Window, select Properties, and then Don’t Repeat from the dropdown.
Colors (Selected Strategy)
For easy visual differentiation, you can color-code the strategies of a Multi-Strategy Window.
Newly added strategies will not automatically be colored and are displayed in plain black and white.
To access the Colors Function, right-click into the Multi-Strategy Window, select Strategies, then choose a specific Strategy and select Colors from the dropdown. Here, you can assign a custom background and text color for your selected strategy.
Delete (Selected Strategy)
To permanently remove a strategy from a Multi-Strategy Window, right-click into the Multi-Strategy Window, select Strategies, then choose a specific Strategy and select Delete from the dropdown.
To temporarily disable a selected Strategy, simply uncheck it.
To remove all strategies from the Multi-Strategy Window at once permanently, right-click and select Delete All from the dropdown.
Backtest Strategy (Selected Strategy)
You have the ability to run the Oddsmaker for any strategy within your Multi-Strategy Window.
To backtest a specific strategy, right-click into the Multi-Strategy Window, select Strategies, then choose a specific Strategy and select Backtest Strategy from the dropdown.
Open Alert Window (Selected Strategy)
To isolate a selected strategy from the Multi-Strategy Window, right-click into the Multi-Strategy Window, select Strategies, then choose a specific Strategy and select Open Alert Window from the dropdown. Thereafter, your strategy will open in its own, standalone Alert Window and can be used independently.
Configure All
The Configure All function enables you to change the settings of all strategies at once. Right-click into the Multi-Strategy Window and select Configure All. The popup window will list all the available strategies. Choose Select All to edit all strategies at once or choose Select None and make a selection from the list.
Once you've made your selection, press the Edit Selected button. This will lead you to the Configuration Menu, which is similar to the Alert Config Menu.
The Window Specific Filters Tab will display all the filters currently in use.
A white filter background with values indicates that these values are shared by all strategies. If you hover over the filter value field, a popup will display the settings of each individual strategy.
A grey filter background indicates that the strategies have different values for this particular filter. If you hover over the filter value field, a popup will display the settings of each individual strategy.
A white filter background without values indicates that none of the strategies have values defined for this filter.
If you enter or change a value in any of the filter fields, it will be applied to all strategies.
You can add more filters by pressing the More Button and then using the Search function. Press the Hide Unused Button to only show the filters that are currently in use. Choose Add Defaults to add filters that are generally used.
The Exchanges Tab will display all the exchanges that the various strategies are set to scan. When all strategies are scanning a particular exchange, the box will have a checkmark. When some of the strategies scan an exchange, the box will be filled. Hover over an individual exchange to bring up a popup that lists the strategies that scan the particular market.
In the Symbol Lists Tab, you can choose to include or exclude certain stock symbols from your scans.
In order to do this, you first need to check the option Apply changes to all strategies. Thereafter, you can select Symbol Lists from the Add Existing List menu or choose Create New List. Any changes made will apply to all strategies that are currently selected for editing.
Delete All
The Delete All Function removes all strategies from a Multi-Strategy Window permanently. To do so, right-click into the Multi-Strategy Window and select Delete All.
History
The History Feature allows you to analyze the alerts of your Multi-Strategy Windows over the past 60 odd days.
By default, alerts will be streaming in real-time, however, you can uncheck the real-time mode, if you wish to look further back.
You can select All to see past alerts or request historical alerts for a specific Timeframe. Start describes the most recent alerts that you want to see. By default, these appear at the top of the alert window.
You can choose Now as the Start Date, or you can choose a specific Date and Time.
Below you can choose the oldest alert that you would like to see. You can make a selection from the dropdown, which starts this morning and ends 64 days ago. Alternatively, you can choose a specific date and time.
Press the OK button and you will see the Window will fill with historical alerts. The caption of the Multi-Strategy Window will be updated to show that historical data is currently displayed and that more historical data is available.
If you click on an alert to display it in a linked chart, you will see a blue arrow pointing at the bar where the alert occurred.
Please note, that the window will load a maximum of 1000 alerts and the past alerts will be split up by the number of strategies. If your Multi-Strategy Window contains 20 strategies, you will see about 50 past alerts for each strategy.
To fully analyze the historical output of a strategy, isolate the strategy and run the history of the individual Alert Window. To do so, right-click into the Multi-Strategy Window, select Strategies, then the specific Strategy, and choose Open Alert Window. To use the History Feature within an Alert Window, right-click and select History.
To save all the displayed data of the Alert Window as a CSV file on your PC, right-click and select Save Contents.
To transfer the column entries into a spreadsheet, highlight the rows either by clicking and holding down your left mouse key while moving over the rows or by pressing the Control and A key on your keyboard. To copy your selection, press the Control and C key on your PC’s keyboard. Finally, press the Control and V key to paste the selected rows into your spreadsheet.
To highlight entire rows with one mouse-click, Go to the Toolbar, select Options, General, and then, Highlight grid row upon selection.
To be able to highlight single columns, leave this option unchecked.
Send XYZ To
The Send To Feature enables you to look up more info for a stock or share it with others. This feature is available in most Trade Ideas Windows, namely Charts, Top Lists, Alert, and Multi-Strategy Windows as well as Price Alerts and AI Strategy Trades Windows. Simply highlight a symbol, then right-click and select, Send XYZ to... where XYZ stands for the chosen stock symbol.
You can choose to send the chosen symbol to a new Chart Window, or a new Single Stock Window.
In addition to that our Send To Feature lets you share the stock with your followers on Twitter. Enter your message, and if you would like to share the Alert as well as the Strategy, check the box, Include Strategy Config in Message. Thereafter click, Tweet Now. If you haven’t connected to Twitter yet, the Twitter Authorization Window will open. Enter your Twitter username and password, then click Authorize app. After logging in, copy the received PIN into the box on the bottom left-hand side. Then click, Confirm.
You can also send a symbol to an already externally linked target platform. If you have not established External Linking yet, the External Linking Window will open and enable you to Add a Link. With external linking enabled, any symbol you click on within Trade Ideas will automatically load in an external platform like your charting or brokerage app. This is a good way to connect to a lot of different applications. A further tutorial will discuss External Linking in more detail.
Another option is to send the stock symbol to the Web. By selecting send to Web, you can find info about the particular stock on Yahoo, Finviz, StockCharts, BigCharts, as well as other web-based platforms, and conduct further research. If you check the option, Use Symbol Linking, and leave the particular web-based platform open, it will automatically load every symbol you select in your scan on the web-based platform as well. This way, you will get an instant internet look-up for every symbol that you’re interested in. In addition to the sites in the selection menu, you can select Custom to add a different web-based platform. If this platform requires a login, log into the web-based platform first. Then, have a look at the URL when you are logged in to your web destination. Copy this URL, and split it where the symbol is mentioned. Enter the part of the URL before the symbol, into the first section, and the part after the symbol in the next section.
Lastly, you can send the stock symbol to one of your existing Symbol Lists. Or even create a New List to add the symbol to. A further tutorial will discuss how to create, edit and use Symbol Lists in more detail.
Clear
To remove all currently displayed alerts from the Multi-Strategy Window, use the Clear function. Simply right-click into the Multi-Strategy Window and select Clear. New Alerts will start populating in real-time as they trigger.
Missing Symbol Check
The Missing Symbol Check function makes it very easy for you to determine why a specific stock symbol didn't appear on your scan.
It automates all the manual steps you would otherwise have to go through to see why a symbol didn't appear in your strategy along with red/green color coding pointing to exactly why a stock didn't show up.
To access this function, right-click into your Multi-Strategy Window and select Missing Symbol Check
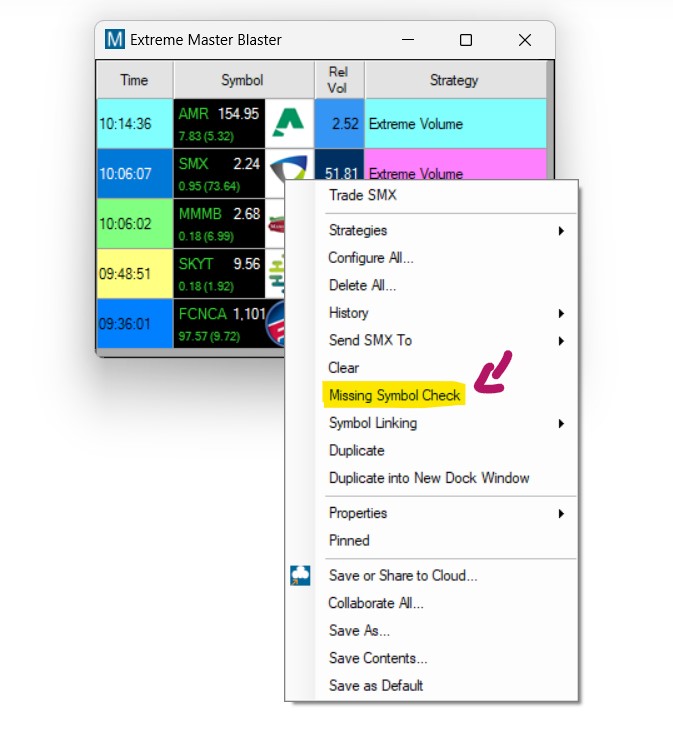
The Missing Symbol Check Window will list all strategies of your Multi-Strategy Window.
You can perform the check on one strategy at a time by placing a checkmark next to your chosen the strategy.
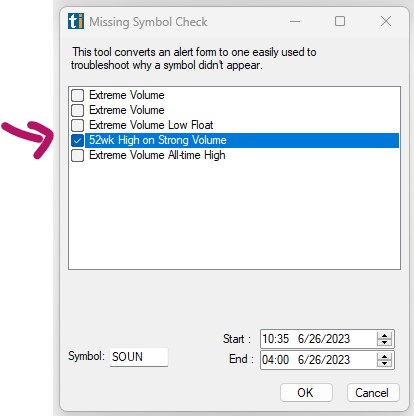
You can check a specific symbol, by entering it in the Symbol Field.
Enter a time period for your check.
Start is the Date and Time closest to the current time, End is the Date and Time farthest in the past.
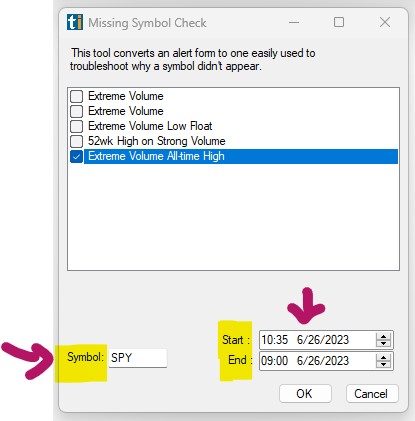
Once you entered a specific symbol, for example SPY, as well as a Time, for example 10:35 am for the Start, and 9 am for the End, click OK.
The individual Alert Window of your chosen strategy will now load:
The Alert Window will only point at the specific ticker you entered, for example the SPY, and highlight which of the scan's filter criteria the symbol meets and which ones it doesn't meet.
-
The filter criteria that aren't met by the entered symbol, are highlighted in red. These are the reason why the stock didn't appear on your scan.
-
The filter requirements that are fulfilled will be highlighted in green.

If the stock did not trigger one of the alerts selected in your Alert Window, you will see a Heartbeat Alert otherwise you will see the alert together with a time stamp.

Symbol Linking
Most Trade Idea Windows, including Alert, Top List, Multi-Strategy, and Compare Count Windows as well as the Holly AI Windows, RBI, GBI, and Price Alerts can be symbol-linked to a Chart or Single Stock Window.
This means that when changing your windows stock symbol, your symbol-linked Chart or Single Stock Window will automatically change as well, and display the specific stock’s data.
By default, all symbol-linked free-floating Windows belong to the blue, Link to All, Color Group.
By default, all docked Windows are assigned to the pink, Dock Window, Linking Group. In "Pink Mode" only the menu items contained in the indiviual dock respond to symbol changes.
The assigned color group will always be displayed in the top left-hand corner of each window.

You can create up to 4 additional Linking Groups and by doing so, link selected windows to a specific Chart or Single Stock Window, which is very useful when monitoring various scans.
There are two ways to create a Linking Group:
- Option 1
You can assign windows to a specific color group individually.
To do so, right-click into your window, select Symbol Linking, and choose a color from the dropdown. The selected window will now display the Color Group in the top left-hand corner.

To enable Symbol Linking for a Single Stock Window, right-click into it, and select Symbol Linking.
Then, add a Checkmark to the left-hand side of the Symbol Linking option.

To enable Symbol Linking for a Chart, right-click into it, select Properties, and then Symbol Linking. Now, add a Checkmark to the left-hand side of the Symbol Linking option.

- Option 2
To establish a Linking Group for a number of windows at once, go to the Toolbar, open the Tools Tab, and select, Symbol Linking Groups.

The next window will display all the Trade Ideas windows currently in use.

By default, each free-floating window is assigned to the blue, Link to All, Linking Group.
By default, each docked window is assigned to the pink, Dock Window, Linking Group. In "Pink Mode" only the menu items contained in the indiviual dock respond to symbol changes.
To establish a new Linking Group, select the windows that will be part of the new Linking Group by adding a checkmark.
You can select all windows at once by choosing, Select All, at the bottom.

You can clear your selection by selecting, Clear Selected, at the bottom.
Once you have selected the windows, open the Link Groups dropdown in the top left-hand corner. Select a color for your new Linking Group, then choose, Set All Selected, to assign the windows.

All the selected windows will now display the color of the Linking Group you have assigned them to.
To see all windows that are assigned to a specific Linking Group, choose the Group Color from the Link Groups dropdown, then select, Filter By. To see all available windows, select, Clear Filter.

Once you have assigned the windows, select Close.
All the windows that you assigned to a Linking Group will now display the Group Color in the top left-hand corner.
Any Single Stock Window or Chart that has been assigned to the same Color Group will update accordingly, whenever you change a stock symbol in one of the other Linking Group windows.
Please note, that even when a Single Stock Window and Chart have been assigned to a specific color group, they will always also be linked to the Blue Color Group since this is the default Link to All Group. This means in turn that any window that is assigned to the blue linking group will be linked to all open SingleStock Windows and Charts.
Duplicate
To copy your current Trade Ideas Window, use the Duplicate function. Simply right-click into your Multi-Strategy Window and select Duplicate from the dropdown. You will get an exact copy of the current window, which you can modify while keeping the original window intact.
Duplicate into New Dock Window
To open a copy of a free-floating window in a new Dock, right-click into the free-floating window and select Duplicate into New Dock Window. An exact copy of your free-floating window will now be opened in a new Dock.
Duplicate into XYZ Dock
To load a copy of a free-floating window into an already open Dock, right-click into the free-floating window and select Duplicate into XYZ Dock, where XYZ stands for the Name of that particular Dock. An exact copy of your free-floating window will now be added to the chosen Dock.
Properties
Each Multi-Strategy Window has a Properties Menu that enables you to modify the visual appearance of the window itself as well as the data within it.
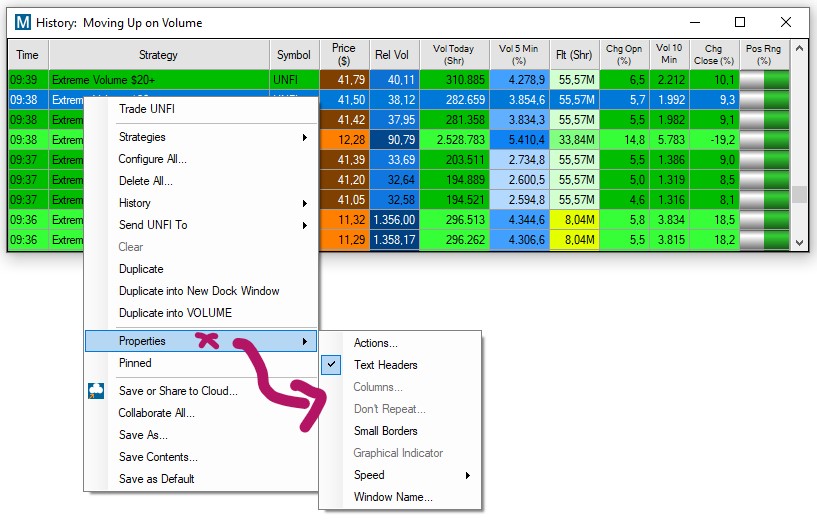
Each function will be discussed in detail on the next pages.
Actions - Sound Alert
The Actions feature of our Alert window allows you to select various audio options. This way, you will be notified by a particular sound each time an alert triggers.
-
A Right-Click in the Multi-Strategy Window, select Properties, and then Actions.
-
Check Play Sound in the new popup window. Then click Set Up Sound.
-
The next window will display built-in sound options. You can choose an asterisk, a beep, exclamation, a stop, or text to speech.
If you choose the Text-To-Speech Option, a female voice will call out each stock symbol that triggers.
Further below, you can choose a custom sound from your local computer. Please note that custom files need to be in WAV format, the system isn't able to use MP3.
-
Once you have selected a Sound Option, click Play to test the audio. Use the Balance and Volume sliders to adjust the sound to your liking.
-
Hit Okay when you are done.
Should you at any point decide, rather not to have sound alerts, you can always go back into the right-click Actions Menu and uncheck the sound option again.
Actions - Show Alert Window
To receive a visual notification when a new alert triggers in one of your scans, enable the Show Alert Window Feature.
Right-click into your Multi-Strategy Window, select Properties, and then Actions. Here, check the option, Show Alert Window.
Once this option is enabled, the particular Window will pop to the surface if it is hidden behind other windows. It will flash when it is already on the surface.
Use this feature with caution, since it could put a strain on the UI resources when used in excess.
The best way to be notified of new alerts triggering and to be able to distinguish between the alerts from different scans is to set up a different Sound Alert for each Window.
Text Headers
The Text Headers option allows you to adjust the way the column headers are displayed. By default, the column headers will show the filter names. To display filter icons instead, right-click select Properties and uncheck the Text Headers option. If you hover over the icons, the filter names will, however, always pop up.
Columns
The columns displayed in the Multi-Strategy Window can be reorganized via left-click drag and drop. The individual columns can also be extended or compressed by using your mouse. To add more viewable columns to your Multi-Strategy Window, right-click, select Properties, and then Columns.
The left-hand side shows the already listed columns, the right-hand side shows the columns that can be added.
Select additional columns from the field on the right-hand side by highlighting them with a mouse click. Then, click the arrow pointing to the left to move them to the Selected Columns field.
To remove any of the already selected columns, highlight the column, then click the arrow pointing to the right.
To only see the filter columns that are already part of your strategies, press the Hide Unused button.
To see generally used filter columns press the Add Defaults button.
To see a list of all available filter columns, press the More button.
Click OK when you are done.
To save all the displayed data of the Alert Window as a CSV file, right-click and select Save Contents. You can also transfer selected column entries, into a spreadsheet. To do so, highlight the rows either by clicking and holding down your left mouse key while moving over the rows or by pressing Control and A on your keyboard. To copy your selection, press Control, and C. Finally, press Control, and V, to paste the selected rows into your spreadsheet.
Symbol Plus Column
The Symbol Plus Feature enables our users to condense some of the stock's key data into one single column.
It is available in Alert, Top List and Multi-Strategy Windows, as well as in the Premium AI Strategy Trades Window.
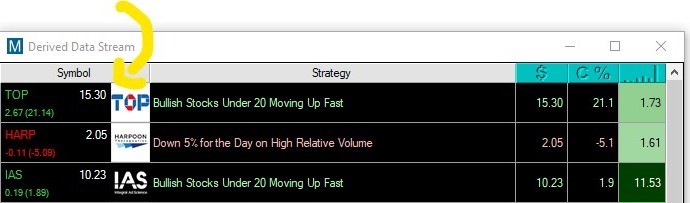
To enable Symbol Plus, right-click into the header of the symbol column of your scan.
A dropdown with the following options will appear:

The option Normal will display the following info in the symbol column:

-
The company's symbol
-
The stock's current price
-
The Change from the Close in $
-
The Change from the Close in %
-
The company's logo
The option Logo Only will display the following way:

The option No Logo will display the following info in the symbol column:

-
The company's symbol
-
The stock's current price
-
The Change from the Close in $
-
The Change from the Close in %
The option Symbol/Logo will display the following info in the symbol column:

The option Off will show the traditional symbol column.

Don't Repeat
The Don't Repeat Feature is useful when your Multi-Strategy Window displays many alerts for the same symbols in fast progression. This function helps to filter these repeated symbols. To access the Don't Repeat Feature, right-click into the Multi-Strategy Window, select Properties, and then Don't Repeat from the dropdown.
Now, you can select a time period, in which a symbol won't be repeated by any strategy within the Multi-Strategy Window, or choose not to repeat symbols at all. To define a Don't Repeat period for a selected strategy only, right-click into the Multi-Strategy Window, select Strategies, then choose a specific Strategy and select Don't Repeat from the dropdown.
Small Borders
You can set Small Borders for your Multi-Strategy Window. To do so, right-click into the Multi-Strategy Window, select Properties, then choose Small Borders from the dropdown. With this option enabled, you can make the window much more narrow than with regular borders, which is beneficial if screen space is limited. You could, for example, resize your window to only show the symbol column.
Graphical Indicator
Graphical Indicators can be used to display the performance of stocks, in a quick-to grasp visual format. They can be used for all Position in Range Filters. These visually enhanced filter columns can be placed anywhere inside of a window.
When the indicator shows green, and when the green bar moves towards the right, it signals that the stock's current price is moving towards the high of the range.
If the indicator is red, it means, that the stock price is closer to the low of the range.
Grey, on the other hand, signals that the stock is currently trading near the middle of its range.
To see the underlying percentage value, hover your mouse over the Graphical Indicator.
To switch between the graphical indicator and a numerical value, right-click into the specific Position in Range column, select Properties and then check or uncheck the option Graphical Indicator.
Speed
The Speed Feature allows you to control the speed of the alerts scrolling inside of the Multi-Strategy window. By default, it is set to normal. To access the Speed Feature, right-click select Properties and then Speed. Here, you can choose between 6 speed options ranging from slowest.
Window Name
By default, a newly created Multi-Strategy Window is named just that. Right-click into the Multi-Strategy Window, select Properties, and then Window Name, to give your Multi-Strategy Window a defining name.
Pinned
To keep a single Trade Ideas window on your screen permanently, even when switching layouts, or toggling through channels, right-click into the specific window, and select Pinned from the dropdown. The Pinned Feature, is available for all Trade Idea Windows, including Scans, Charts, Compare Count, and the Holly AI Windows.
Once a window is pinned, it does not follow the behavior of the other windows.
This is useful if you would like to include one or more windows of a channel in a custom layout, without saving the individual windows to the Cloud first.
It is important to note, that this window will stay open until you decide to unpin it. When accidentally saved within a layout, It might load multiple times, when closing and re-opening this layout. At worst, you will have multiple versions of the window all running on top of each other in the same position. This can put a strain on system resources and drastically impact software performance. The pinning option should therefore be used very carefully and consciously. A window should always be unpinned after the desired action is completed.
To do this, right-click into the window and remove the checkmark on Pinned.
To see all pinned and unpinned windows, or to close them, go to the Toolbar, select Windows, and choose, Close All Unpinned, or Close All Pinned.
Save or Share to Cloud
Once you have created your own scan or have changed the settings of a preconfigured scan, make sure to save it to the cloud for future use.
-
Right-click into the window and select Save or Share to Cloud
-
Enter a new name into the Name field or keep the automatically added one.
-
Enter a description for your new scan or leave the Description field blank.
-
If you would like to automatically close any other open layout or channel in the future, whenever you load this new scan, select Clear Previous Layout. If you would like to load this scan on top of any already opened layout, leave this checkbox blank.
-
Select Save when you are done or select Save and Share to share the scan with others before saving it to the cloud.
-
There are various sharing options:
-
Scan the QR code
-
Select Copy All, to save the Cloud link to your clipboard and paste it into an email or messaging app.
-
Click the Twitter icon and include a text message if you like. If you haven't connected Trade Ideas to Twitter yet, a Twitter Authorization Form will open. Log in with your Twitter username and password. Then click, Authorize App. Thereafter, copy the displayed Pin Code into the field at the bottom left-hand side of the window and select Confirm.
- Select OK when you are done.
Your new scan is now stored in your cloud, from where it can easily be retrieved. Just go to the Toolbar, open the File Tab and choose Load from Cloud. To find a saved scan, you can enter its name in the search field, or scroll through the list. Just highlight your scan, then choose Load.
Collaborate All
QR Codes
The Collaborate Feature enables you to export your strategies to your phone. Just right-click into your Multi-Strategy Window and select Collaborate All. You can scan the displayed code with any QR reader app available on your phone. Thereafter, you can share it with others. If you choose to open the scanned URL on your phone, it will bring you to our website, where you can see the scan settings and real-time data output when logged in. If you follow the recommended link to our HTML5 page, you will be redirected to our latest Web Version. Once logged in, the particular scan will load immediately.
Social Media/Twitter
The Collaborate Feature also enables you to share your Multi-Strategy Window on Twitter. Right-click into your Multi-Strategy Window and select Collaborate All. Here, enter a text message if you like. Thereafter, click the Twitter icon. If you haven't connected Trade Ideas to Twitter yet, a Twitter Authorization Form will open. Log in with your Twitter username and password. Then click, Authorize App. Thereafter, copy the displayed Pin Code into the field at the bottom left-hand side of the window and select Confirm. You will only need to do this once. Thereafter your Tweets will be sent immediately.
Copy & Paste
The Collaborate Feature enables you to share your scans via copy and paste. Simply right-click into your Multi-Strategy Window and select Collaborate All.Then, choose Copy All, to save the collaboration link to your clipboard and paste it into an email or messaging app.
Save As
Apart from saving your windows to the cloud, you can also save them to your local PC in order to create a backup. This is especially useful if you have spent a lot of time and effort customizing your scans and layouts. Just right-click into your window and select Save As from the dropdown. This will bring up the standard Save file dialog. Enter a name for the file and choose a folder to save it to. By default, it will be saved in your local TradeIdeasPro folder. Lastly, press the Save button.
To load these .WTI files, open the File Tab of the Toolbar, and select Load Window.
Save Contents
To save all the displayed data of an Alert, Top List, or Multi-Strategy Window, as a CSV file on your PC, right-click and select Save Contents.
The standard Save file dialog will be displayed. Enter a name for the file, choose the file type and file folder, then press the Save button.
To manually transfer column entries into a spreadsheet, highlight the rows either by clicking and holding down your left mouse key while moving over the rows or by pressing the Control and A key on your keyboard. To copy your selection, press Control and C. Finally, press the Control and V key to paste the selected rows into your spreadsheet.
To highlight entire rows with one mouse-click, Go to the Toolbar, select Options, General, and then, Highlight grid row upon selection.
To be able to highlight single columns, leave this option unchecked.
Save as Default
You can save a window and its configuration as the default version of this window type by right-clicking and choosing Save As Default. Whenever you now open a new window of this type from the New Tab of your Toolbar, the window configuration that you saved as default, will load.
The Load Window option, which you can find in the File Tab of the Toolbar, provides access to all the default versions of your Trade Ideas windows. The default layouts of your Chart, Single Stock, Brokerage Plus, and AI Windows are saved in the TradeIdeasPro folder on your local computer.
Single Stock Window
The Trade Ideas Single Stock Windows provides key fundamental and other customizable data about a chosen stock. With Symbol Linking enabled by default, it will automatically display details about the symbol that you selected in your scanner or chart.
To open a Single Stock Window, go to the Toolbar, open the New Tab, and select Single Stock Window.
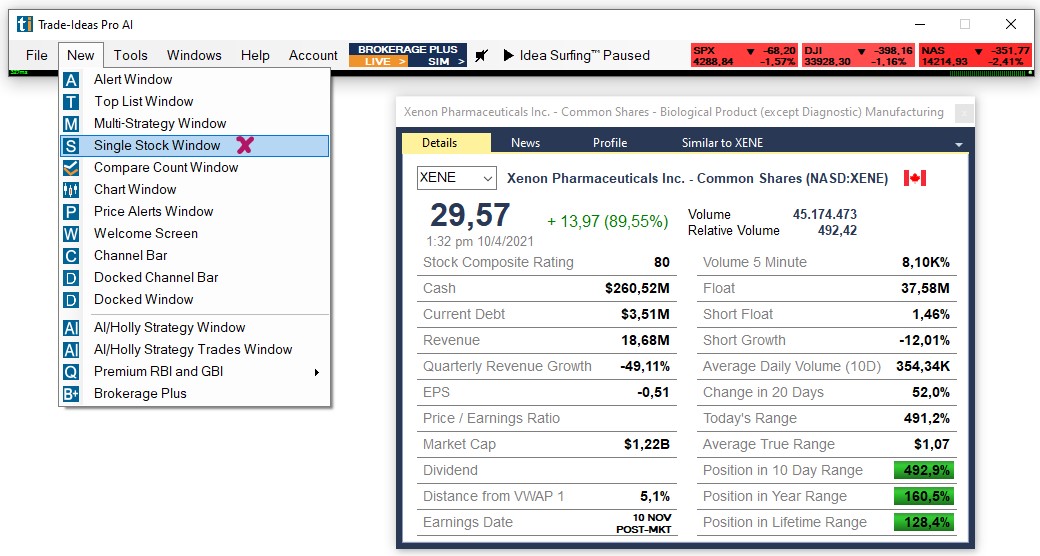
Details Tab
The header of the Single Stock Window displays the company's name and its industry. The field below shows the current Stock Symbol. To switch to a different stock, enter its ticker in this field, then press Enter on your keyboard.
The Detail Tab of the Single Stock Window displays the Company Name, the Exchange, and the Ticker it is listed under as well as the country flag.
Listed below in large letters is the current price and in either green or red next to it are the Change from Close in Dollars and the Change from Close in Percent. Further to the right, you will see Today's Volume in Shares as well as the Relative Volume in blue letters.
Directly below the Current Price, you will see the Time and Date of the snapshot the Single Stock Window provides.
The Details Tab of the Single Stock Window will display various columns containing key fundamental and other customizable data about a chosen stock. Displayed data and column order are highly customizable and can be configured to provide a snapshot of exactly the stock info you would like to see. To do so, simply right-click into the Single Stock Window and select Configure.
News Tab
The News Tab of the Single Stock Window loads the latest Google News of the stock. The News Tab displays the Headline together with the release date and time as well as the source. A click on any header will open the source article in a new browser window.
Profile Tab
The Profile Tab provides insight into the company's field of operation. You can see the Sector, the Sub Sector, the Industry Group, the Industry as well as the Sub Industry the company belongs to. In addition to that, a short Business Summary describes the field of operation. At the bottom, you will find a direct link to the company's website.
Insiders Tab
The Insider Tab shows details about Insider Trades. It lists the Date of the Trade, the Name of the Insider, and the Relation of the Insider to the Company. In addition to that, it provides details about the Transaction Type, which could be labeled as, a Buy, a Sell, a non-open market Acquisition, a non-open market Disposition, an Automatic Buy, an Automatic Sell, an Option Execution. Otherwise, it would be labeled as Unknown. Furthermore, you can see the Number of Shares Traded, as well as the Price, and the total number of Shares held. The columns can be sorted via click, on the column header. For columns containing text, sorting can be done by A to Z, and vice versa. For columns containing numbers, sorting can be done from biggest to smallest, and vice versa.
To filter by Transaction Type, right-click into the Insider Tab and select Transaction Filter, then make your selection and hit Done.
Similar Tab
The Similar Tab displays a Top List Window of stocks that are similar to the company either in price action or business operation. Use the toggle on the right-hand side to switch between these two options. A click on any competitor's symbol will change the data of the Single Stock Window to show a snapshot of the selected stock. The Competitor Top List Window can be isolated and used independently from the Similar Tab of the Single Stock Window via right-click and pop out.
Trade XYZ
You can trade stocks right from your scans and charts via our One-Click Order Feature. Simply right-click into the scan or chart and select Trade to bring up a dropdown menu with preconfigured order templates.
How to create a custom Order Entry Template:
Configure
Configure (Right-Click)
To start customizing your Single Stock Window simply right-click into the Window and select, Configure.
The Search Tab of the Single Stock Config Window enables you to find all of the available filters, you can use to create the data snapshot for your Single Stock Window. Scroll through the entire list, filter by Category, or enter a keyword into the Search Terms Field.
Once you have found the filters that you would like to use, highlight them with a mouse click.
A right-click on a highlighted alert or filter will bring up a popup menu with various options. The same options are accessible by pressing the buttons below the list.
To find out more about a specific filter and its settings, highlight it, then press the Help button. This will bring you to the Alert & Filter Definition page on our website.
The Clear All option will unselect all highlighted filters.
The Show Me option is a great tool when you are uncertain about the exact filter settings or would like to see the effects filter changes will have on the number of stocks available to scan. A further tutorial will discuss this feature in more detail.
To display a filter column in your Single Stock Window, highlight the filter, then select the Show Column option at the bottom of the list.
This will bring you to the Columns Tab, where the chosen filter has automatically been added to the bottom of the field on the left-hand side. This field displays the already chosen columns. The right-hand side, on the other hand, contains all the available filters that can be selected for display in your scan.
Select additional columns from the field on the right-hand side by highlighting them with a mouse click. Then, click the arrow pointing to the left to move them to the Selected Columns field.
To remove any of the already selected columns, highlight the column, then click the arrow pointing to the right.
To only see the filters that are already part of your Single Stock Window, press the Hide Unused button.
Choose Add Defaults to see the list of filters that are generally used. You can add more filters by pressing the More Button and then using the Search function of the Search Tab.
The Columns Order Tab enables you to arrange the displayed columns in your Single Stock Window. The field on the left-hand side lists the columns that are located on the left-hand side of your Single Stock Window. The right-hand side field shows the data columns located on the right-hand side of the Single Stock Window. To move specific columns from the left to the right or vice versa, highlight the column, then press the arrow pointing to the opposite side. To move columns up or down in their field, use the up and down arrows below.
Click OK when you are done, or jump to one of the other tabs to adjust your Single Stock Window further.
Include Pre and Post Market
If you would like your Single Stock Window to display Pre and Post Market data for stocks, right-click and select Include Pre and Post Market.
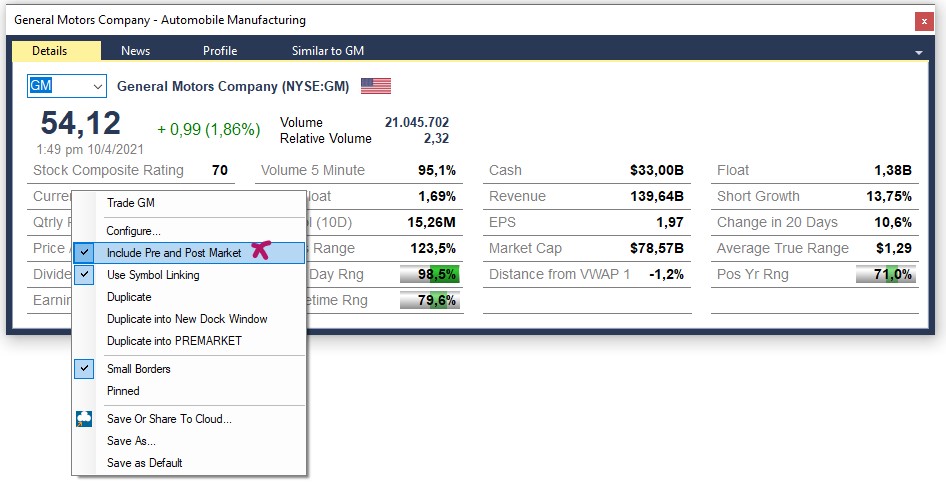
Symbol Linking
Most Trade Idea Windows, including Alert, Top List, Multi-Strategy, and Compare Count Windows as well as the Holly AI Windows, RBI, GBI, and Price Alerts can be symbol-linked to a Chart or Single Stock Window.
This means that when changing your windows stock symbol, your symbol-linked Chart or Single Stock Window will automatically change as well, and display the specific stock’s data.
By default, all symbol-linked free-floating Windows belong to the blue, Link to All, Color Group.
By default, all docked Windows are assigned to the pink, Dock Window, Linking Group. In "Pink Mode" only the menu items contained in the indiviual dock respond to symbol changes.
The assigned color group will always be displayed in the top left-hand corner of each window.

You can create up to 4 additional Linking Groups and by doing so, link selected windows to a specific Chart or Single Stock Window, which is very useful when monitoring various scans.
There are two ways to create a Linking Group:
- Option 1: Assign windows individually
You can assign windows to a specific color group individually.
To enable Symbol Linking for a Single Stock Window, right-click into it, and select Symbol Linking.
Then, add a Checkmark to the left-hand side of the Symbol Linking option.

To enable Symbol Linking for a scan, right-click into your window, select Symbol Linking, and choose a color from the dropdown. The selected window will now display the Color Group in the top left-hand corner.

To enable Symbol Linking for a Chart, right-click into it, select Properties, and then Symbol Linking. Now, add a Checkmark to the left-hand side of the Symbol Linking option.

- Option 2: Assign multiple windows at once
To establish a Linking Group for a number of windows at once, go to the Toolbar, open the Tools Tab, and select, Symbol Linking Groups.

The next window will display all the Trade Ideas windows currently in use.

By default, each free-floating window is assigned to the blue, Link to All, Linking Group.
By default, each docked window is assigned to the pink, Dock Window, Linking Group. In "Pink Mode" only the menu items contained in the indiviual dock respond to symbol changes.
To establish a new Linking Group, select the windows that will be part of the new Linking Group by adding a checkmark.
You can select all windows at once by choosing, Select All, at the bottom.

You can clear your selection by selecting, Clear Selected, at the bottom.
Once you have selected the windows, open the Link Groups dropdown in the top left-hand corner. Select a color for your new Linking Group, then choose, Set All Selected, to assign the windows.
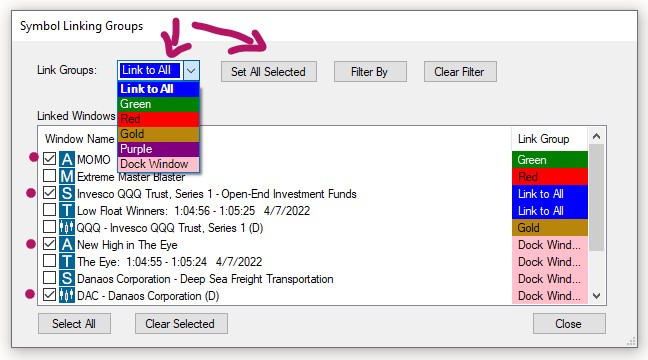
All the selected windows will now display the color of the Linking Group you have assigned them to.
To see all windows that are assigned to a specific Linking Group, choose the Group Color from the Link Groups dropdown, then select, Filter By. To see all available windows, select, Clear Filter.

Once you have assigned the windows, select Close.
All the windows that you assigned to a Linking Group will now display the Group Color in the top left-hand corner.
Any Single Stock Window or Chart that has been assigned to the same Color Group will update accordingly, whenever you change a stock symbol in one of the other Linking Group windows.
Please note, that even when a Single Stock Window and Chart have been assigned to a specific color group, they will always also be linked to the Blue Color Group since this is the default Link to All Group. This means in turn that any window that is assigned to the blue linking group will be linked to all open SingleStock Windows and Charts.
Duplicate
To copy your current Trade Ideas Window, use the Duplicate function. Simply right-click into your Single Stock Window and select Duplicate from the dropdown. You will get an exact copy of the current window, which you can modify while keeping the original window intact.
Duplicate into New Dock Window
To open a copy of a free-floating window in a new Dock, right-click into the free-floating window and select Duplicate into New Dock Window. An exact copy of your free-floating window will now be opened in a new Dock.
Duplicate into XYZ Dock
To load a copy of a free-floating window into an already open Dock, right-click into the free-floating window and select Duplicate into XYZ Dock, where XYZ stands for the Name of that particular Dock. An exact copy of your free-floating window will now be added to the chosen Dock.
Small Borders
You can set Small Borders for your Single Stock Window. To do so, right-click into the Window and choose Small Borders from the dropdown. With this option enabled, you can make the window much more narrow than with regular borders, which is beneficial if screen space is limited.
Font Size
You can change the Font Size of the Single Stock Window from the default size normal to small or large by right-clicking into the window, selecting Font Size and making your selection:
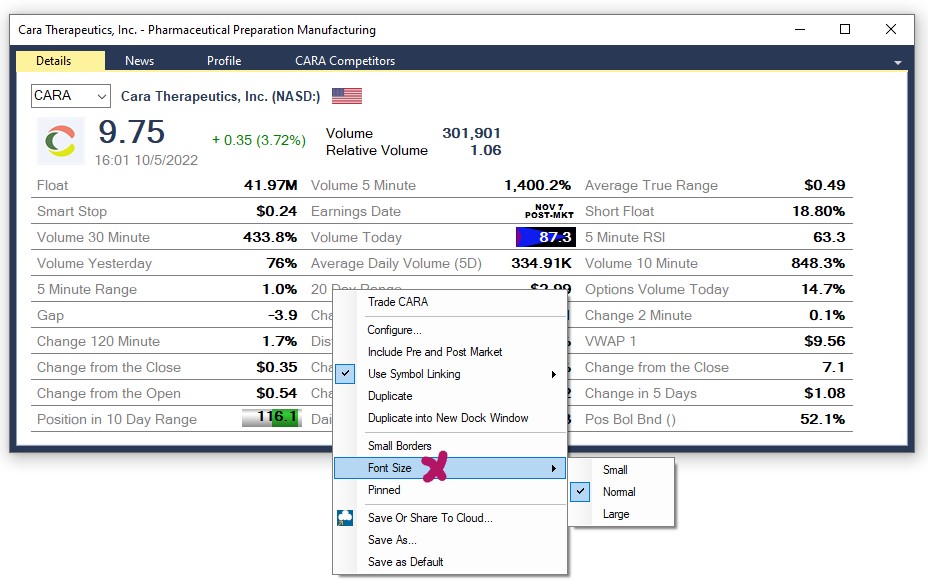
Pinned
To keep a single Trade Ideas window on your screen permanently, even when switching layouts, or toggling through channels, right-click into the specific window, and select Pinned from the dropdown. The Pinned Feature, is available for all Trade Idea Windows, including Scans, Charts, Compare Count, and the Holly AI Windows.
Once a window is pinned, it does not follow the behavior of the other windows.
This is useful if you would like to include one or more windows of a channel in a custom layout, without saving the individual windows to the Cloud first.
It is important to note, that this window will stay open until you decide to unpin it. When accidentally saved within a layout, It might load multiple times, when closing and re-opening this layout. At worst, you will have multiple versions of the window all running on top of each other in the same position. This can put a strain on system resources and drastically impact software performance. The pinning option should therefore be used very carefully and consciously. A window should always be unpinned after the desired action is completed.
To do this, right-click into the window and remove the checkmark on Pinned.
To see all pinned and unpinned windows, or to close them, go to the Toolbar, select Windows, and choose, Close All Unpinned, or Close All Pinned.
Save or Share to Cloud
Once you have configured your Single Stock Window the way you like it, make sure to save it to the cloud for future use.
-
Right-click into the window and select Save or Share to Cloud
-
Enter a new name into the Name field or keep the automatically added one.
-
Enter a description for your new Single Stock Window or leave the Description field blank.
-
If you would like to automatically close any other open layout or channel in the future, whenever you load this new Single Stock Window, select Clear Previous Layout. If you would like to load this Single Stock Window on top of any already opened layout, leave this checkbox blank.
-
Select Save when you are done or select Save and Share to share the scan with others before saving it to the cloud.
-
There are various sharing options:
-
Scan the QR code
-
Select Copy All, to save the Cloud link to your clipboard and paste it into an email or messaging app.
-
Click the Twitter icon and include a text message if you like. If you haven't connected Trade Ideas to Twitter yet, a Twitter Authorization Form will open. Log in with your Twitter username and password. Then click, Authorize App. Thereafter, copy the displayed Pin Code into the field at the bottom left-hand side of the window and select Confirm.
- Select OK when you are done.
Your new Single Stock Window is now stored in your cloud, from where it can easily be retrieved. Just go to the Toolbar, open the File Tab and choose Load from Cloud. To find a saved layout item, you can enter its name in the Search Field, or scroll through the list. Just highlight the layout item, that you would like to open, then choose Load.
Save As
Apart from saving your windows to the cloud, you can also save them to your local PC in order to create a backup. This is especially useful if you have spent a lot of time and effort customizing your scans and layouts. Just right-click into your window and select Save As from the dropdown. This will bring up the standard Save file dialog. Enter a name for the file and choose a folder to save it to. By default, it will be saved in your local TradeIdeasPro folder. Lastly, press the Save button.
To load these .WTI files, open the File Tab of the Toolbar, and select Load Window.
Save as Default
You can save a window and its configuration as the default version of this window type by right-clicking and choosing Save As Default. Whenever you now open a new window of this type from the New Tab of your Toolbar, the window configuration that you saved as default, will load.
The Load Window option, which you can find in the File Tab of the Toolbar, provides access to all the default versions of your Trade Ideas windows. The default layouts of your Chart, Single Stock, Brokerage Plus, and AI Windows are saved in the TradeIdeasPro folder on your local computer.
Compare Count Window
The Compare Count Window is used to visually compare a bullish against a bearish strategy. By default, it compares New Highs versus New Lows. It is a great visualization tool that can provide an indication of what the markets are up to.
To open a Compare Count Window, go to the Toolbar, open the New Tab, and select Compare Count Window. If you leave all the settings unchanged and click OK at the bottom of the window, it will graphically display the New Highs versus New Lows comparison.
The green line is representing the bullish strategy, the red line, the bearish strategy. You can see the lines update in real-time. The thick lines represent the fast EMAs. The thin lines represent the slower, smoothed-out Moving Averages, showing the more general trend for each strategy. The blue line represents the percent line, it correlates with the bullish, green strategy and shows the percentage of new Highs. If the blue line would sit right at the top, at 100%, it would mean that all stocks would be making new highs. If it was at 0% it would mean all stocks would be making new lows. The cylinder score on the left-hand side reflects the percentage of highs versus low or bullish versus bearish as well. The green portion is in line with the blue percent line, the red one with the red EMA line.
The X-axis on the left-hand side displays the timeline, the Y-axis shows the Alerts per Second, the X-axis on the right-hand side displays the Percentage of New Highs.
You can adjust the compare count view via the right-click menu. You have the option to only show points, only show percent, or to show both. In addition to that, you can include or exclude the legend on the top-right-hand side of the Compare Count Window.
Furthermore, you can choose a Dark Background.
The Small Borders function enables you to make the window much more narrow than with regular borders, which is beneficial if screen space is limited.
Select Clear, to reload the Compare Count Window. During the refresh, the current percent and EMA lines will be removed and then start calculating anew.
To create an exact copy of the current Compare Count Window, select Duplicate.
Config Window
To change the default comparison of New Highs versus New Lows and to compare other bullish and bearish strategies to one another, right-click into the Compare Count Window and select Configure.
Configure Green Data/Red Data
To add a different bullish strategy, select Configure, below the Green Data Header. To add a different bearish strategy, select Configure, below the Red Data Header.
This will open the Alert Config Window. Select a bullish or bearish strategy from the Strategies Tab or create an entirely new strategy. Hit OK when you are done.
Collaborate Green Data/Red Data
To add a different bullish or bearish strategy from an already open Alert Window, use the Collaborate function below the Green Data or Red Data Header.
Right-click into the Alert Window, you would like to add and select Collaborate. Choose Copy All in the popup window. Next, go to the Toolbar, open the New Tab, and select Compare Count Window. Now, select Collaborate in the Green Data field on the left-hand side to add a bullish strategy or in the Red Data field on the right-hand side to add a bearish strategy. Choose Paste All in the popup menu, then hit OK.
Configure and Collaborate
In addition to that, you can use a combination of the Configure and Collaborate function together with the Flip feature.
If you have loaded a bullish strategy and would like to compare it to its exact bearish counterpart, you can use the Collaborate function in combination with the Flip Feature. After loading the bullish strategy, either via the Configure, or the Collaborate function, select Collaborate. Now, select Copy All, then close the Collaborate Window. Next, open the Collaborate window by selecting, Collaborate below the Red Data Header. Select Paste All then open the Configure option below the Red Data Header. You will see that the same bullish strategy has loaded in the Red Data field. To turn it into the bearish counterpart, select Flip on the bottom right-hand side. Give your bearish strategy a new name in the Summary Tab, then hit OK.
Update Speed
The Update Speeds controls how quickly the Compare Count data points are updated. By default, they update every 5 seconds. You can increase that to one data point every 120 seconds, which means you will see less detail, but more historical data.
Thick EMA/Thin EMA
The thick and thin EMA lines can be set to move faster and show more data points or to be slower and therefore smoother.
Symbol Linking
Most Trade Idea Windows, including Alert, Top List, Multi-Strategy, and Compare Count Windows as well as the Holly AI Windows, RBI, GBI, and Price Alerts can be symbol-linked to a Chart or Single Stock Window.
This means that when changing your windows stock symbol, your symbol-linked Chart or Single Stock Window will automatically change as well, and display the specific stock’s data.
By default, all symbol-linked free-floating Windows belong to the blue, Link to All, Color Group.
By default, all docked Windows are assigned to the pink, Dock Window, Linking Group. In "Pink Mode" only the menu items contained in the indiviual dock respond to symbol changes.
The assigned color group will always be displayed in the top left-hand corner of each window.

You can create up to 4 additional Linking Groups and by doing so, link selected windows to a specific Chart or Single Stock Window, which is very useful when monitoring various scans.
There are two ways to create a Linking Group:
- Option 1: Assign windows individually
You can assign windows to a specific color group individually.
To enable symbol linking for your Compare Count Window, right-click into it, select Symbol Linking, and choose a color from the dropdown. The selected window will now display the Color Group in the top left-hand corner.
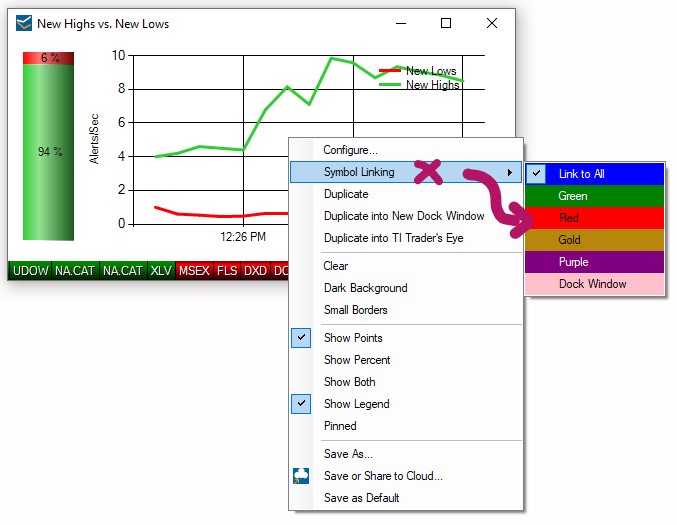
To enable symbol linking for your scan, right-click into your window, select Symbol Linking, and choose a color from the dropdown. The selected window will now display the Color Group in the top left-hand corner.

To enable Symbol Linking for a Single Stock Window, right-click into it, and select Symbol Linking.
Then, add a Checkmark to the left-hand side of the Symbol Linking option.

To enable Symbol Linking for a Chart, right-click into it, select Properties, and then Symbol Linking. Now, add a Checkmark to the left-hand side of the Symbol Linking option.

- Option 2: Assign multiple windows at once
To establish a Linking Group for a number of windows at once, go to the Toolbar, open the Tools Tab, and select, Symbol Linking Groups.

The next window will display all the Trade Ideas windows currently in use.

By default, each free-floating window is assigned to the blue, Link to All, Linking Group.
By default, each docked window is assigned to the pink, Dock Window, Linking Group. In "Pink Mode" only the menu items contained in the indiviual dock respond to symbol changes.
To establish a new Linking Group, select the windows that will be part of the new Linking Group by adding a checkmark.
You can select all windows at once by choosing, Select All, at the bottom.

You can clear your selection by selecting, Clear Selected, at the bottom.
Once you have selected the windows, open the Link Groups dropdown in the top left-hand corner. Select a color for your new Linking Group, then choose, Set All Selected, to assign the windows.

All the selected windows will now display the color of the Linking Group you have assigned them to.
To see all windows that are assigned to a specific Linking Group, choose the Group Color from the Link Groups dropdown, then select, Filter By. To see all available windows, select, Clear Filter.

Once you have assigned the windows, select Close.
All the windows that you assigned to a Linking Group will now display the Group Color in the top left-hand corner.
Any Single Stock Window or Chart that has been assigned to the same Color Group will update accordingly, whenever you change a stock symbol in one of the other Linking Group windows.
Please note, that even when a Single Stock Window and Chart have been assigned to a specific color group, they will always also be linked to the Blue Color Group since this is the default Link to All Group. This means in turn that any window that is assigned to the blue linking group will be linked to all open SingleStock Windows and Charts.
Pinned
To keep a single Trade Ideas window on your screen permanently, even when switching layouts, or toggling through channels, right-click into the specific window, and select Pinned from the dropdown. The Pinned Feature, is available for all Trade Idea Windows, including Scans, Charts, Compare Count, and the Holly AI Windows.
Once a window is pinned, it does not follow the behavior of the other windows.
This is useful if you would like to include one or more windows of a channel in a custom layout, without saving the individual windows to the Cloud first.
It is important to note, that this window will stay open until you decide to unpin it. When accidentally saved within a layout, It might load multiple times, when closing and re-opening this layout. At worst, you will have multiple versions of the window all running on top of each other in the same position. This can put a strain on system resources and drastically impact software performance. The pinning option should therefore be used very carefully and consciously. A window should always be unpinned after the desired action is completed.
To do this, right-click into the window and remove the checkmark on Pinned.
To see all pinned and unpinned windows, or to close them, go to the Toolbar, select Windows, and choose, Close All Unpinned, or Close All Pinned.
Save As
Apart from saving your Compare Count Window to the cloud, you can also save it to your local PC in order to create a backup. This is especially useful if you have spent a lot of time and effort customizing your windows. Just right-click into your window and select Save As from the dropdown. This will bring up the standard Save file dialog. Enter a name for the file and choose a folder to save it to. By default, it will be saved in your local TradeIdeasPro folder. Lastly, press the Save button.
To load these .WTI files, open the File Tab of the Toolbar, and select Load Window.
Save or Share to Cloud
Once you have configured a Compare Count Window the way you like it, make sure to save it to the cloud for future use.
-
Right-click into the window and select Save or Share to Cloud
-
Enter a new name into the Name field or keep the automatically added one.
-
Enter a description for your new scan or leave the Description field blank.
-
If you would like to automatically close any other open layout or channel in the future, whenever you load this window, select Clear Previous Layout. If you would like to load this window on top of any already opened layout, leave this checkbox blank.
-
Select Save when you are done or select Save and Share to share the Compare Count Window with others before saving it to the cloud.
-
There are various sharing options:
-
Scan the QR code
-
Select Copy All, to save the Cloud link to your clipboard and paste it into an email or messaging app.
-
Click the Twitter icon and include a text message if you like. If you haven't connected Trade Ideas to Twitter yet, a Twitter Authorization Form will open. Log in with your Twitter username and password. Then click, Authorize App. Thereafter, copy the displayed Pin Code into the field at the bottom left-hand side of the window and select Confirm.
- Select OK when you are done.
Your new Compare Count Window is now stored in your cloud, from where it can easily be retrieved. Just go to the Toolbar, open the File Tab and choose Load from Cloud. To find a saved layout item, you can enter its name in the Search Field, or scroll through the list. Just highlight the layout item, that you would like to open, then choose Load.
Save as Default
You can save your Compare Count Window and its configuration as the default version of this window type by right-clicking and choosing Save As Default. Whenever you now open a new window of this type from the New Tab of your Toolbar, the window configuration that you saved as default, will load.
The Load Window option, which you can find in the File Tab of the Toolbar, provides access to all the default versions of your Trade Ideas windows. The default layouts of your Chart, Single Stock, Brokerage Plus, and AI Windows are saved in the TradeIdeasPro folder on your local computer.
Chart Window
Our Charts enable you to visually confirm the alerts of our scans and to trade directly from them via our One-Click-Trading Feature. Depending on your plan, you can have a set number of charts open simultaneously, which can all have different settings.
The Time Frames of our charts range from One Minute to Monthly and you can choose between a light and a dark theme. You can add Indicators, Trendlines, Arrows, and Text as well as Price Alerts. In addition to that, our Charts provide you with a quick-to grasp smart risk level assessment for each stock including target level and smart stop as well as a suggested swing exit for longer-term holds. With an account at a participating broker, orders can be sent directly from the charts either via one-click order entry or drag and drop.
Trade XYZ
You can trade stocks right from your charts via our One-Click Order Feature. Simply right-click into the chart and select Trade to bring up a dropdown menu with preconfigured order templates.
How to create a custom Order Entry Template:
Create Price Alert
Our Price Alerts Feature enables you to highlight price levels that are of interest to you right in the Chart and to receive alerts when said levels are reached. To place a Price Alert, move your mouse cursor to the price level you would like to be alerted to, then right-click into the Chart and select Create Price Alert.
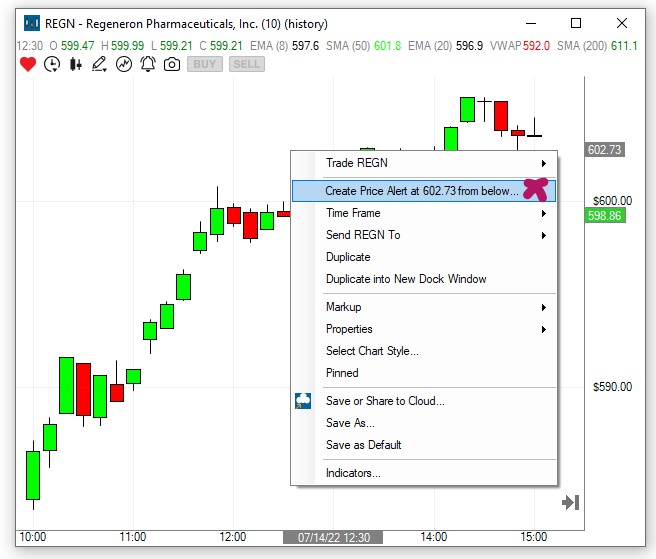
The Create Price Alert Window will open, where you can apply further settings.
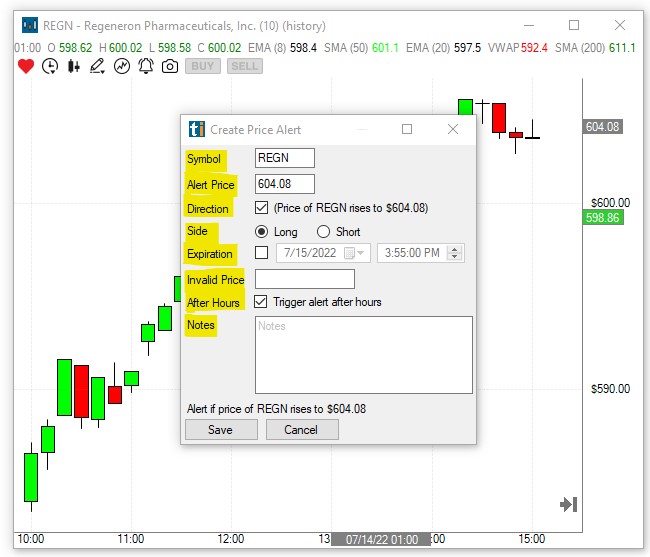
It will show the Symbol and the Alert Price you have defined, as well as the Current Price of the stock, and the Distance in Dollars, to your Price Alert Level.

Below, the Direction of the necessary price move to reach the defined Price Alerts Level, based on the Current Price, is automatically listed, together with it being a Long or a Short.
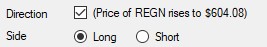
Furthermore, you can define an Expiration Date and Time, on which the Price Alert will become invalid.

Alternatively, or in addition to that, you can define a Price Level that, if reached by the stock, will invalidate the current Price Alert.

To prevent your Price Alerts from triggering in the pre- and postmarket, uncheck the option Trigger Alert After Hours.

Finally, you can add some personal Notes to the Price Alert. The Notes field is very helpful since it can contain details of the trading strategy to apply, should the Price Level of the Price Alert be reached.
The bottom of the Create Price Alert Window displays a written Summary of your configured Price Alert.
After hitting Save a blue line will be placed on the Chart, indicating the Price Level of the Price Alert. Hovering over it will bring up more details about the specific Price Alert. To change the Price Level, this line can be moved via drag and drop with your mouse. To remove the current Price Alert, select the blue line with your mouse and press the Delete key on your keyboard. A popup window will ask to Confirm Deletion. Press OK to confirm or Cancel to abort the deletion.
Once the stock reaches the Alert Price, the Price Alerts Window will pop up and display details about each Price Alert. A further tutorial will discuss the Price Alerts Window in more detail.
Time Frame
The current Time Frame of the Chart will be displayed in the top left-hand corner together with the Stock Symbol and the current date. To change the Time Frame, right-click into the Chart, select Time Frame, then make your selection from the menu. The Time Frames of our charts range from One Minute to Monthly. Another way to quickly change the Time Frame is to use the clock icon, found on the top left-hand side of the Chart Window.
Send XYZ to...
The Send To Feature enables you to look up more info for a stock or share it with others. This feature is available in most Trade Ideas Windows, namely Charts, Top Lists, Alert, and Multi-Strategy Windows as well as Price Alerts and AI Strategy Trades Windows. Simply highlight a symbol, then right-click and select, Send XYZ to... where XYZ stands for the chosen stock symbol.
You can choose to send the chosen symbol to a new Chart Window, or a new Single Stock Window.
In addition to that our Send To Feature lets you share the stock with your followers on Twitter. Enter your message, and if you would like to share the Alert as well as the Strategy, check the box, Include Strategy Config in Message. Thereafter click, Tweet Now. If you haven't connected to Twitter yet, the Twitter Authorization Window will open. Enter your Twitter username and password, then click Authorize app. After logging in, copy the received PIN into the box on the bottom left-hand side. Then click, Confirm.
You can also send a symbol to an already externally linked target platform. If you have not established External Linking yet, the External Linking Window will open and enable you to Add a Link. With external linking enabled, any symbol you click on within Trade Ideas will automatically load in an external platform like your charting or brokerage app. This is a good way to connect to a lot of different applications. A further tutorial will discuss External Linking in more detail.
Another option is to send the stock symbol to the Web. By selecting send to Web, you can find info about the particular stock on Yahoo, Finviz, StockCharts, BigCharts, as well as other web-based platforms, and conduct further research. If you check the option, Use Symbol Linking, and leave the particular web-based platform open, it will automatically load every symbol you select in your scan on the web-based platform as well. This way, you will get an instant internet look-up for every symbol that you're interested in. In addition to the sites in the selection menu, you can select Custom to add a different web-based platform. If this platform requires a login, log into the web-based platform first. Then, have a look at the URL when you are logged in to your web destination. Copy this URL, and split it where the symbol is mentioned. Enter the part of the URL before the symbol, into the first section, and the part after the symbol in the next section.
Lastly, you can send the stock symbol to one of your existing Symbol Lists. Or even create a New List to add the symbol to. A further tutorial will discuss how to create, edit and use Symbol Lists in more detail.
Send XYZ to Symbol List
The Send To Feature allows you to add stock symbols to a so-called Symbol List or Watchlist. A Symbol List is useful if you would like to include or exclude certain stocks from your scans.
To add more symbols to any of your existing Symbol Lists, on the fly, from any of your scans or charts, just right-click, then choose the stock ticker you would like to add, select Send to, and then Symbol Lists from the dropdown.
Thereafter, choose a specific Symbol List to add the stock to from the following dropdown menu.
Duplicate
To copy your current Trade Ideas Window, use the Duplicate function. Simply right-click into your Chart Window and select Duplicate from the dropdown. You will get an exact copy of the current window, which you can modify while keeping the original window intact.
Duplicate into New Dock Window
To open a copy of a free-floating window in a new Dock, right-click into the free-floating window and select Duplicate into New Dock Window. An exact copy of your free-floating window will now be opened in a new Dock.
Duplicate into XYZ Dock
To load a copy of a free-floating window into an already open Dock, right-click into the free-floating window and select Duplicate into XYZ Dock, where XYZ stands for the Name of that particular Dock. An exact copy of your free-floating window will now be added to the chosen Dock.
Markup
To mark up the Chart with Lines, Trendlines, Arrows, or Text Annotations, right-click into the Chart and select Markup.
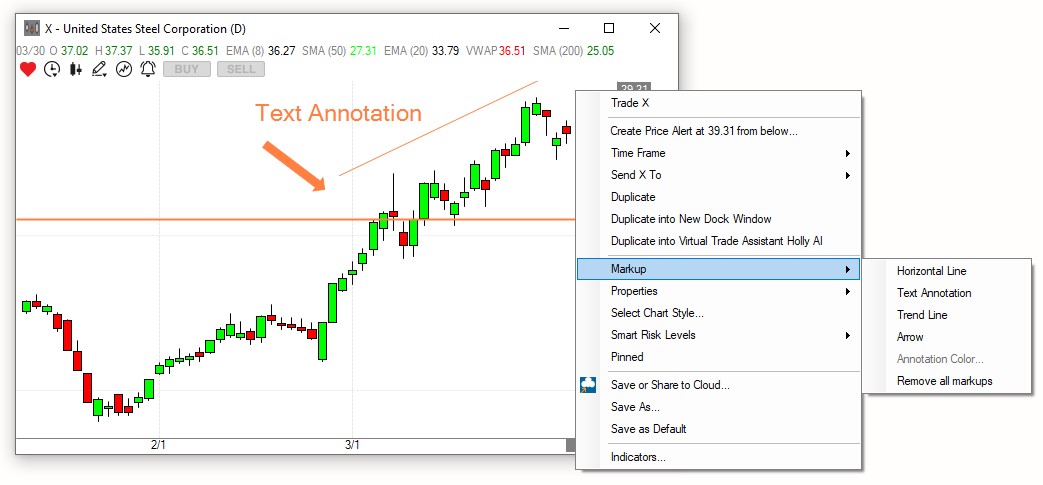
You can change the Annotation position via drag and drop, you can change the size or direction of Trend Lines and Arrows via grab and drag.
To change the color of any Annotation, select it from the menu, place it on the chart and highlight it with your mouse thereafter. Now, right-click again, select Markup, and then Annotation Color.
To remove an Annotation, simply select it on your Chart, then press the Delete key on your keyboard.
To remove all Annotations at once, right-click into the Chart, select Markup and then Remove all Markups.
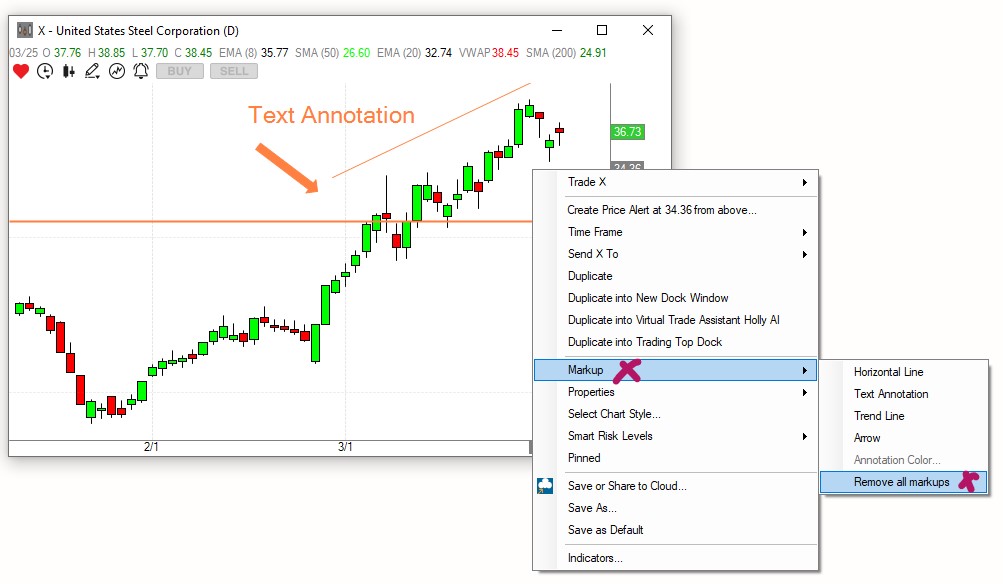
Another way to quickly add Annotations to the Chart is to use the icons found on the top left-hand side of the Chart Window.
You will find icons for a Horizontal Line, a Trend Line, an Arrow, and Text Annotation there.
To place an Annotation on your chart, click on one of these icons, then move your mouse to the desired location on the Chart and click into the Chart to add the Annotation.
To quickly change the color of any Chart Annotation, select it on the Chart, then click the Color Changer Icon and make a color selection.
Properties
Chart Navigation
-
To change the symbol of a chart, simply click into your chart and start typing. This will bring up the Change Symbol field.
-
To move back in history on your chart, use the scroll-wheel of your mouse or the left and right arrow keys on your keyboard.
-
To zoom in and out of your chart, press the control key on your keyboard while using the scroll-wheel of your mouse.
-
In our legacy charts, you can alternatively use the left and right arrow keys of your keyboard whilst holding the control key for scrolling.
HTML Charts Right-Edge Padding
Our HTML Browser Charts load with right edge padding by default.
To disable this function, head to Toolbar, open the Tools Tab, select Options and then Charts and deselect this setting. Head here for more info.

Chart Properties
Many of the chart features are located in the Properties drop-down of the right-click Menu.
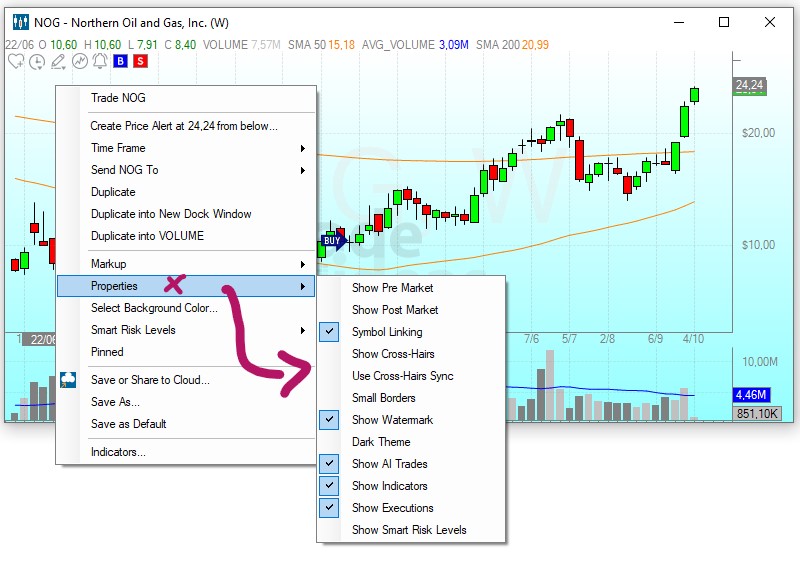
Show Pre Market/Show Post Market
To see Pre and Post Market candles in your chart, right-click into the chart, select Properties, and then Show Pre Market/Show Post Market.
The Pre-market session will be colored in a light beige tone, the Post Market session will appear light purple.
Symbol Linking
Most Trade Idea Windows, including Alert, Top List, Multi-Strategy, and Compare Count Windows as well as the Holly AI Windows, RBI, GBI, and Price Alerts can be symbol-linked to a Chart or Single Stock Window.
This means that when changing your windows stock symbol, your symbol-linked Chart or Single Stock Window will automatically change as well, and display the specific stock’s data.
By default, all symbol-linked free-floating Windows belong to the blue, Link to All, Color Group.
By default, all docked Windows are assigned to the pink, Dock Window, Linking Group. In "Pink Mode" only the menu items contained in the indiviual dock respond to symbol changes.
The assigned color group will always be displayed in the top left-hand corner of each window.

You can create up to 4 additional Linking Groups and by doing so, link selected windows to a specific Chart or Single Stock Window, which is very useful when monitoring various scans.
There are two ways to create a Linking Group:
- Option 1: Assign windows individually
You can assign windows to a specific color group individually.
To enable Symbol Linking for a Chart, right-click into it, select Properties, and then Symbol Linking. Now, add a Checkmark to the left-hand side of the Symbol Linking option.

To enable symbol-linking for a scan, right-click into your window, select Symbol Linking, and choose a color from the dropdown. The selected window will now display the Color Group in the top left-hand corner.

To enable Symbol Linking for a Single Stock Window, right-click into it, and select Symbol Linking.
Then, add a Checkmark to the left-hand side of the Symbol Linking option.

- Option 2: Assign multiple windows at once
To establish a Linking Group for a number of windows at once, go to the Toolbar, open the Tools Tab, and select, Symbol Linking Groups.

The next window will display all the Trade Ideas windows currently in use.

By default, each free-floating window is assigned to the blue, Link to All, Linking Group.
By default, each docked window is assigned to the pink, Dock Window, Linking Group. In "Pink Mode" only the menu items contained in the indiviual dock respond to symbol changes.
To establish a new Linking Group, select the windows that will be part of the new Linking Group by adding a checkmark.
You can select all windows at once by choosing, Select All, at the bottom.

You can clear your selection by selecting, Clear Selected, at the bottom.
Once you have selected the windows, open the Link Groups dropdown in the top left-hand corner. Select a color for your new Linking Group, then choose, Set All Selected, to assign the windows.

All the selected windows will now display the color of the Linking Group you have assigned them to.
To see all windows that are assigned to a specific Linking Group, choose the Group Color from the Link Groups dropdown, then select, Filter By. To see all available windows, select, Clear Filter.

Once you have assigned the windows, select Close.
All the windows that you assigned to a Linking Group will now display the Group Color in the top left-hand corner.
Any Single Stock Window or Chart that has been assigned to the same Color Group will update accordingly, whenever you change a stock symbol in one of the other Linking Group windows.
Please note, that even when a Single Stock Window and Chart have been assigned to a specific color group, they will always also be linked to the Blue Color Group since this is the default Link to All Group. This means in turn that any window that is assigned to the blue linking group will be linked to all open SingleStock Windows and Charts.
Show Cross-Hairs/Use Cross-Hairs Sync
To use Crosshairs on your charts, right-click into the Chart, select Properties, and then Show Cross-Hairs.
Please note that Crosshairs might make it difficult to drag and drop the Markups, like Trend Lines, on your Chart. If this is the case, simply uncheck this option until your Annotations are placed, then re-enable Crosshairs.
The option, Use Cross-hairs Sync, will sync the Crosshairs on all Symbol Linked Charts.
If you move the Crosshairs on one chart, they will move in sync on all other charts that have this option, as well as Symbol Linking, enabled. This is particularly helpful when monitoring a stock on various time frames.
Small Borders
You can set Small Borders for your Chart.
To do so, right-click into the Window, select Properties, then choose Small Borders from the dropdown.
With this option enabled, you can make the window much more narrow than with regular borders, which is beneficial if screen space is limited.
Show Watermark
To see a Watermark of the Stock Symbol, including its Time Frame in the center of your chart, right-click into the Chart, select Properties, then choose, Show Watermark from the dropdown.
Dark Theme
If you prefer darker colored charts, right-click into the Window, select Properties, then choose Dark Theme from the dropdown.
If you would like the grey borders of your Trade Ideas Windows to be darker or differently colored, you can adjust them in the Color settings of your Windows Operating System.
Right-click into your Desktop area and select Personalize.
Choose a color from the color palette or add a custom color, then check Title Bar and Window Borders.
You might need to Restart Trade Ideas after you have made changes to your Windows color settings.
Thereafter the borders of an active Trade Ideas window will appear in your desired color.
Show AI Trades
The trades of our AI Holly (Premium feature) will not only be presented to you in the AI Strategy Trades Window but also on the charts. To enable this feature, right-click into your Chart, select Properties, and then Show AI Trades.
The AI trades will be displayed in a quick and easy-to-grasp visual format:
-
An upward-pointing arrow indicates the entry bar of a Long Trade.
-
A downward-pointing arrow indicates the entry bar of a Short Trade.
-
The blue line represents Holly's Entry Price.
-
The red line indicates the Stop Price.
-
The green line indicates the Target Price.
-
The background coloration highlights the time period of the trade.
-
The green coloration indicates the area in which the trade is profitable.
-
The red coloration points to the area in which the trade would result in a loss.
-
If you hover over the sideways-pointing arrows, you will see a breakdown of the trade parameters. This feature is particularly helpful when reviewing past Holly trades on the chart.
Holly on Charts:
Holly AI One-Click Trading:
Show Order History
When submitting orders via our Brokerage Plus Module, horizontal lines indicating the order price level as well as execution flags, which reveal order details on mouse hover, will be placed on the stock's chart.
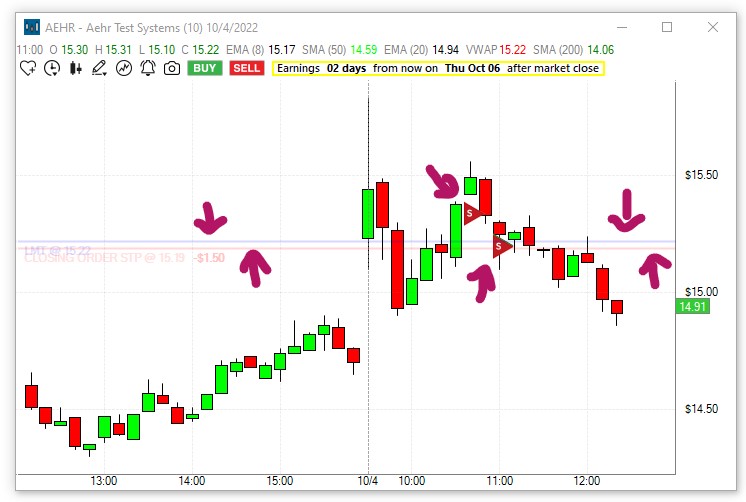
The Properties Menu gives you the option to enable/disable these markers.
To see all order lines, right-click into the chart, and select Properties. Here, check the option Show Orders History, and make a selection from the dropdown.
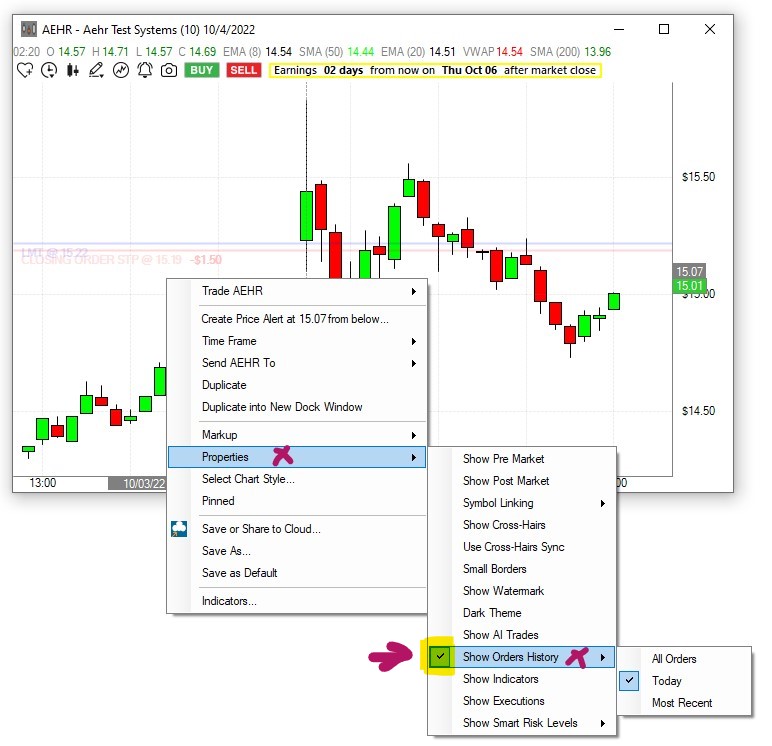
To disable these order markers, right-click into the chart, select Properties and uncheck the option Show Orders History.
To enable/disable the execution flags, right-click into the chart, select Properties and check/uncheck the option Show Executions.
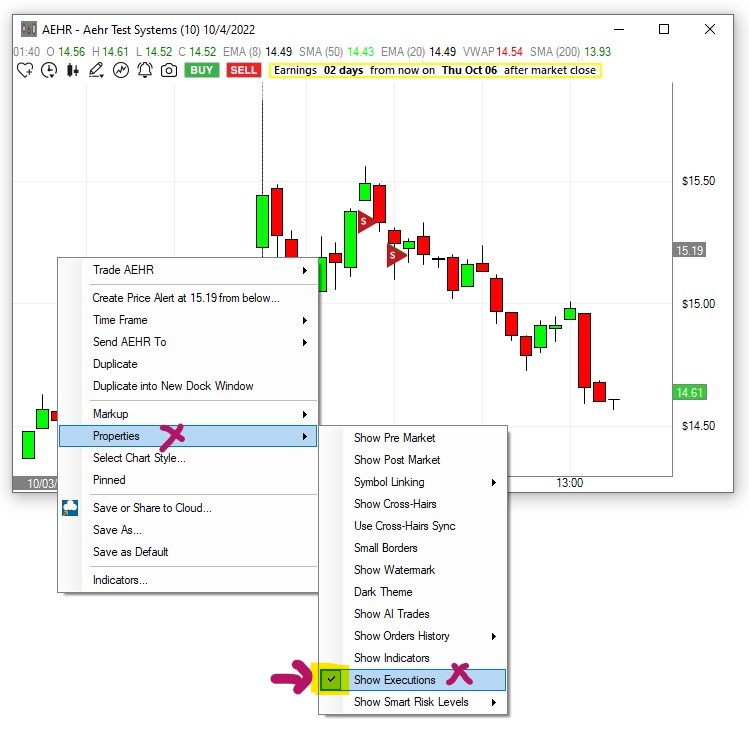
On mouse hover, these flags will provide trade details such as Share Size, Execution Price, Date and Time as well as the Execution ID.
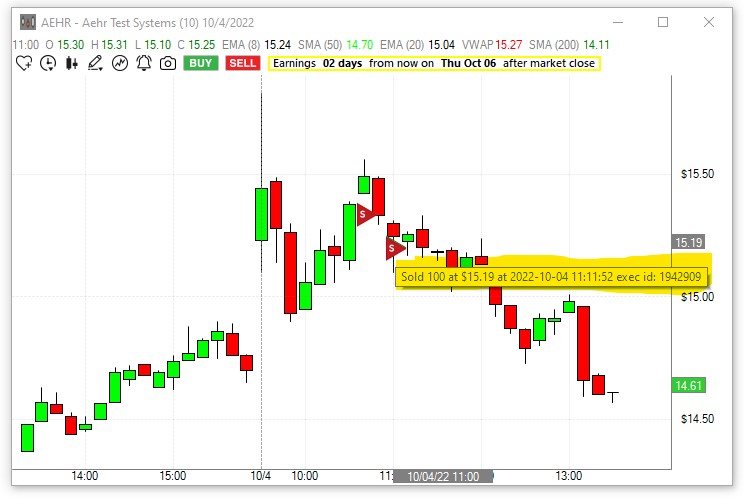
Please note, you need to be connected to our Brokerage Plus Module for order markers to show on the charts.
Show Indicators
To show or temporarily hide all Indicators on your Chart, right-click into the Window, select Properties, then check or uncheck Show Indicators from the dropdown.
Show Executions
To see your own Trades including Entry, Stop Loss, Target, and Exit, right-click into the Chart, select Properties, then choose Show Executions from the dropdown.
Please note, you need to be connected to our Brokerage Plus Module for your executions to show on the charts.
Smart Risk Levels
To see AI-powered Smart Risk Levels for each stock including suggestions for Profit Target (green line) and Smart Stop Level (red line), right-click into the Chart, select Properties, then choose Show Smart Risk Levels from the dropdown. The Profit and Loss values are based on your AI Trade Size settings. To adjust them, go to the Toolbar, open the Tools Tab, and select AI Trade Size. Here you have the choice between Dollars, Shares, and Risk based on Stop Loss.
The Smart Stop is a proprietary risk management filter. The exit point is unique to each symbol based on the stock's volatility, relative volume and daily range.
Select, if you would like to see the Smart Risk Levels for a potential long or a short trade via right-click into the Chart. Select Smart Risk Levels, then choose Long or Short.
The higher Time Frame Charts will additionally display the Swing Exit Level. Swing traders typically observe the 20 day low as a signal to potentially exit their position. This level is indicated by the dark red line on the higher Time Frame Charts. It suggests a possible closing of the trade, when the price area that's marked by the dark red line is reached.
Select Chart Style
To change the type and style of your chart including its color scheme, right-click into the chart and choose Select Chart Style.
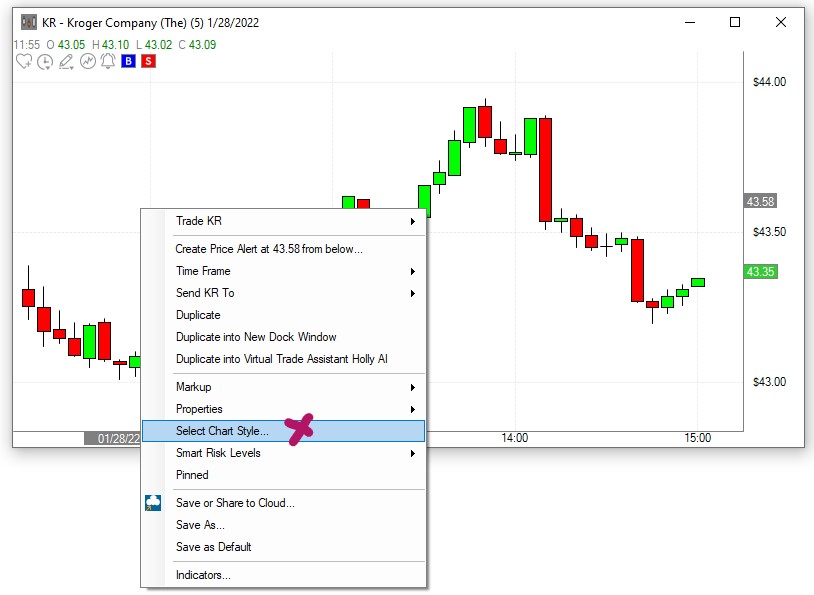
Styles Tab
The Chart style dropdown enables you to choose between Candlestick Charts, Line Charts, Bar Charts, Area Charts, HLC Charts or OHLC Charts.
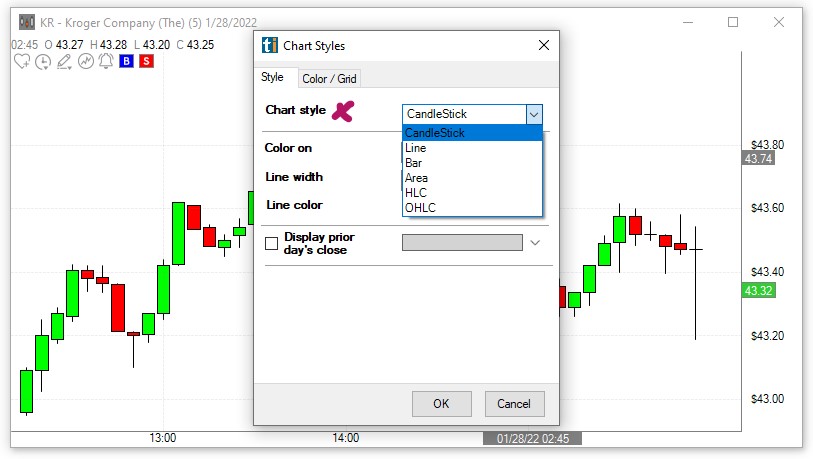
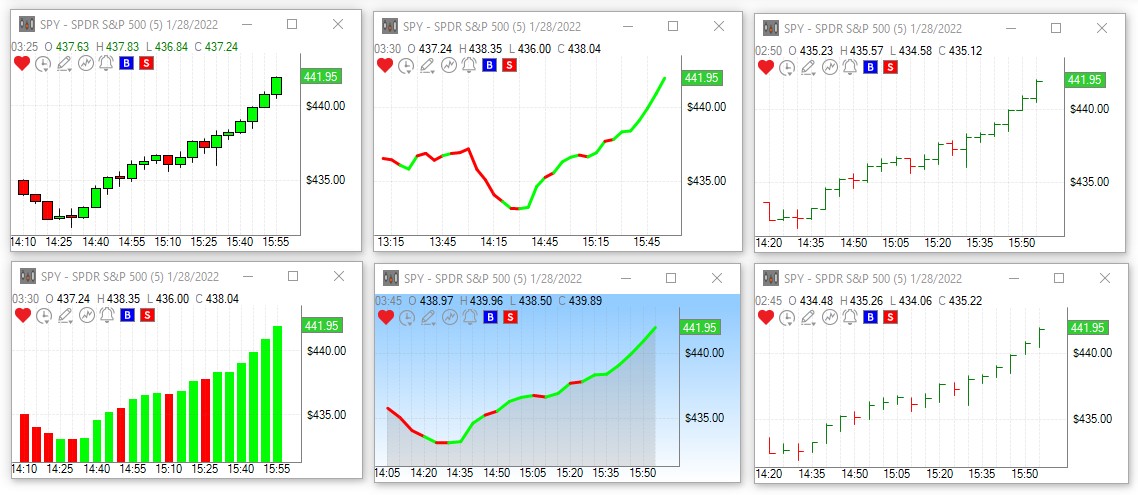
The Color on dropdown enables you to display the chart in two colors based on Open vs Close or in one color.
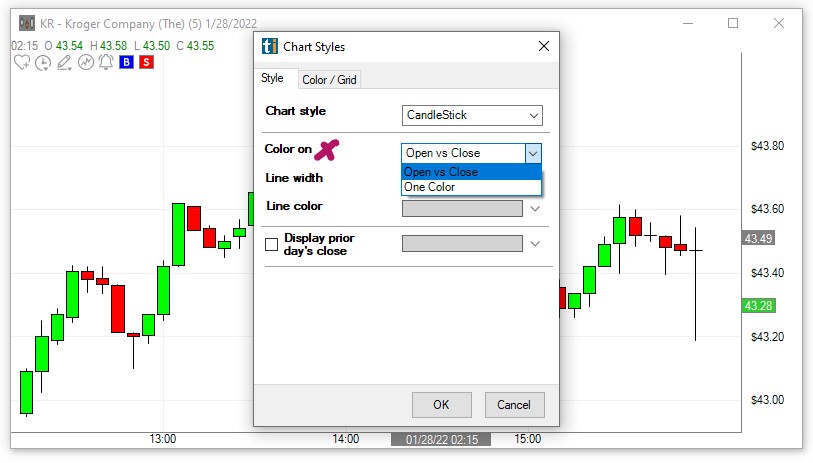
When selecting One Color, head to the Line Color dropdown to make your color choice:
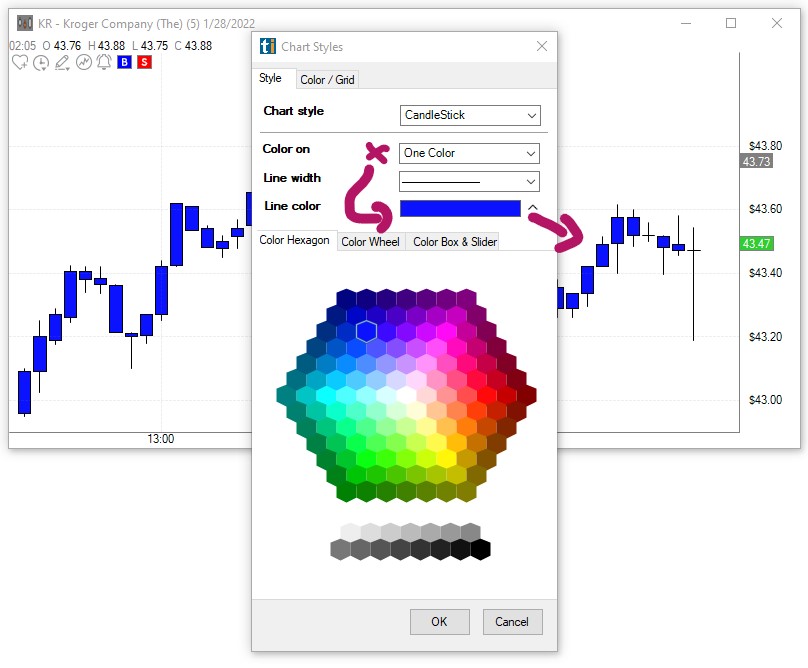
When selecting Open vs Close, open the Color/Grid Tab, then choose an Up Candle Color and a Down Candle Color from the respective dropdowns:
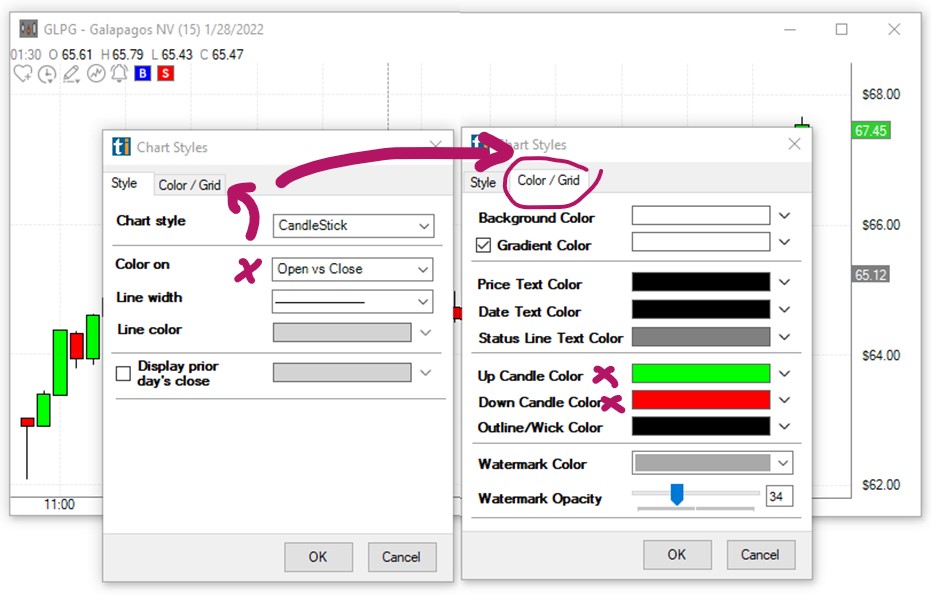
The Line width slider enables you to select the line thickness of your Line, Area, HLC and OHLC Charts:
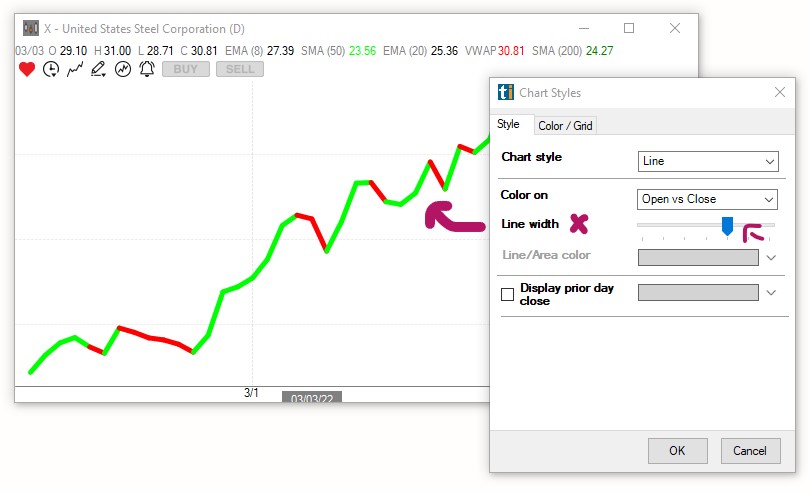
When the option Display prior day's close is checked, a horizontal line indicating yesterday's closing price will be added to your chart. Use the Color Hexagon, the Color Wheel or the Color Box & Slider to choose a color for the closing price line:
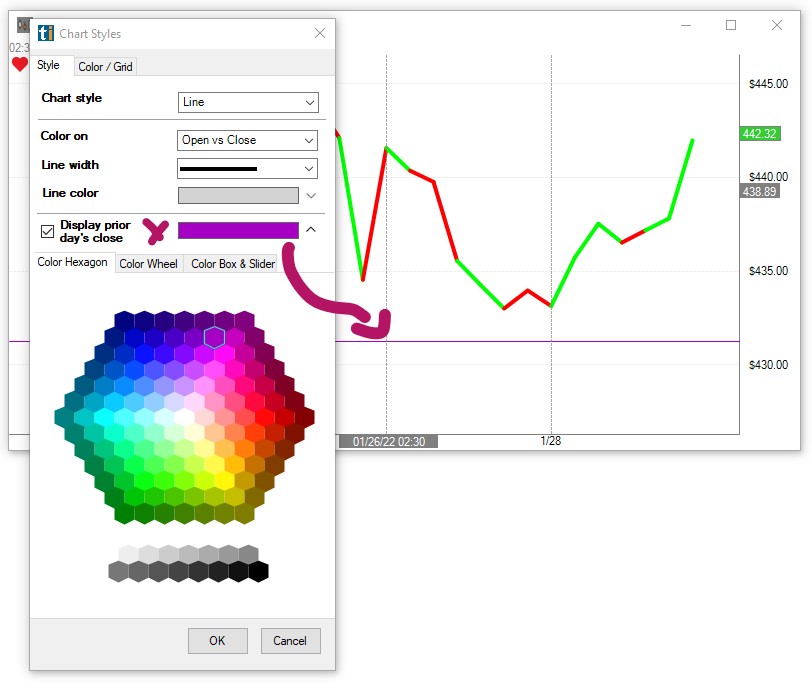
Color/Grid
To change the background color, candle color as well as text color of your chart, right-click into the chart, choose Select Chart Style, then open the Color/Grid Tab.
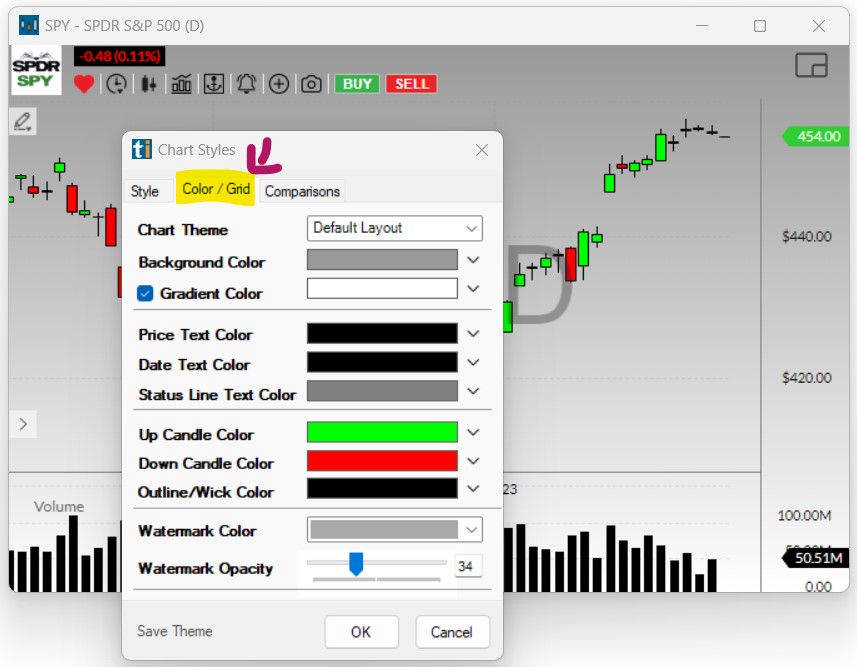
- Chart Theme
The Chart Theme dropdown contains a few ready-made chart styles to choose from.
- Background Color
To select a Background Color, click the downward pointing arrow to open the color selection menu. Here, you can choose a color from the Color Hexagon, the Color Wheel, or the Color Box & Slider. You will see the color changes displayed on your chart as you toggle through the different color options.
Once you have selected a color, click OK to apply the changes and close the Chart Style Menu or click the upward pointing arrow to continue the color selection for your chart.
- Gradient Color
To apply a Gradient Color, check the box on the left-hand side of the Gradient Color option, then click the downward pointing arrow to open the color selection menu. Here, you can choose a gradient color from the Color Hexagon, the Color Wheel or the Color Box & Slider. You will see the color changes displayed on your chart as you toggle through the different color options.
Click OK to apply the changes and close the Chart Style Menu or click the upward pointing arrow to continue the color selection for your chart.
- Price Axis
To apply a different color to the Price Axis, click the downward pointing arrow to open the color selection menu. Here, you can choose a Price Text Color from the Color Hexagon, the Color Wheel or the Color Box & Slider. You will see the color changes displayed on your chart as you toggle through the different color options.
Click OK to apply the changes and close the Chart Style Menu or click the upward pointing arrow to continue the color selection for your chart.
- Date Axis
To apply a different color to the Date Axis, click the downward pointing arrow to open the color selection menu. Here, you can choose a Date Text Color from the Color Hexagon, the Color Wheel or the Color Box & Slider. You will see the color changes displayed on your chart as you toggle through the different color options.
Click OK to apply the changes and close the Chart Style Menu or click the upward pointing arrow to continue the color selection for your chart.
- Status Line Color
To apply a different color to the Status Line Text, click the downward pointing arrow to open the color selection menu. Here, you can choose a Status Line Text Color from the Color Hexagon, the Color Wheel, or the Color Box & Slider. You will see the color changes displayed on your chart as you toggle through the different color options.
Click OK to apply the changes and close the Chart Style Menu or click the upward pointing arrow to continue the color selection for your chart.
- Up Candles Color
To apply a different color to your, by default green, Up Candles, click the downward pointing arrow to open the color selection menu. Here, you can choose an Up Candle Color from the Color Hexagon, the Color Wheel or the Color Box & Slider. You will see the color changes displayed on your chart as you toggle through the different color options.
Click OK to apply the changes and close the Chart Style Menu or click the upward pointing arrow to continue the color selection for your chart.
- Down Candles Color
To apply a different color to your, by default red, Down Candles, click the downward pointing arrow to open the color selection menu. Here, you can choose a Down Candle Color from the Color Hexagon, the Color Wheel or the Color Box & Slider. You will see the color changes displayed on your chart as you toggle through the different color options.
Click OK to apply the changes and close the Chart Style Menu or click the upward pointing arrow to continue the color selection for your chart.
- Wick and Outline Color
To apply a different color to the Candle Wick and Outline, click the downward pointing arrow to open the color selection menu. Here, you can choose a Wick and Outline Candle Color from the Color Hexagon, the Color Wheel or the Color Box & Slider. You will see the color changes displayed on your chart as you toggle through the different color options.
Click OK to apply the changes and close the Chart Style Menu or click the upward pointing arrow to continue the color selection for your chart.
- Watermark Color and Transparency
To change the display of the chart’s watermark, click the downward pointing arrow. Then, make a choice between Off White, which is best when using a darker background color, and Dark Grey, as the base color.
The Watermark Opacity slider enables you to define the watermark’s transparency.
For the Watermark to display, the Show Watermark option needs to be enabled. To do so, right-click into the chart, select Properties and then Show Watermark.
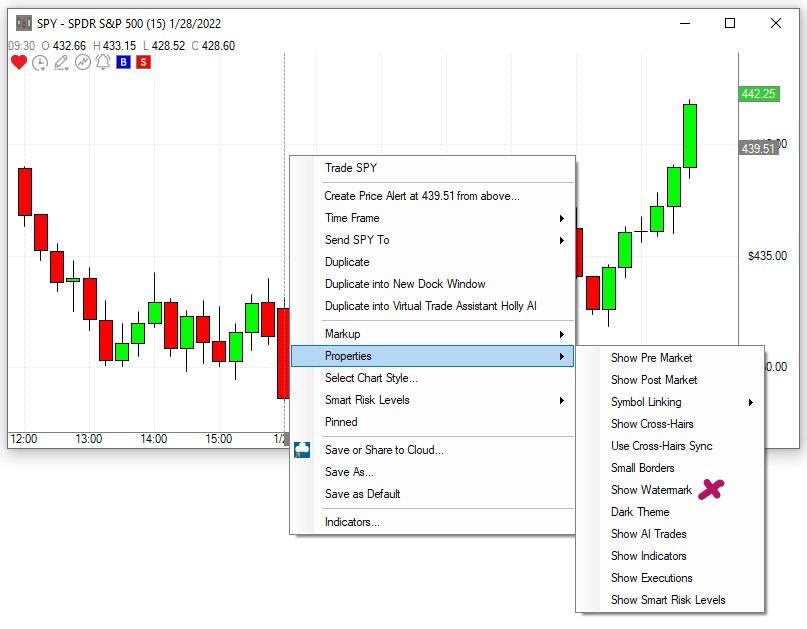
Click OK to apply the changes and close the Chart Style Menu or click the upward pointing arrow to continue the color selection for your chart.
Comparisons Tab
To compare up to 6 stocks on a chart, right-click into a chart, choose Select Chart Style, then open the Comparisons Tab.
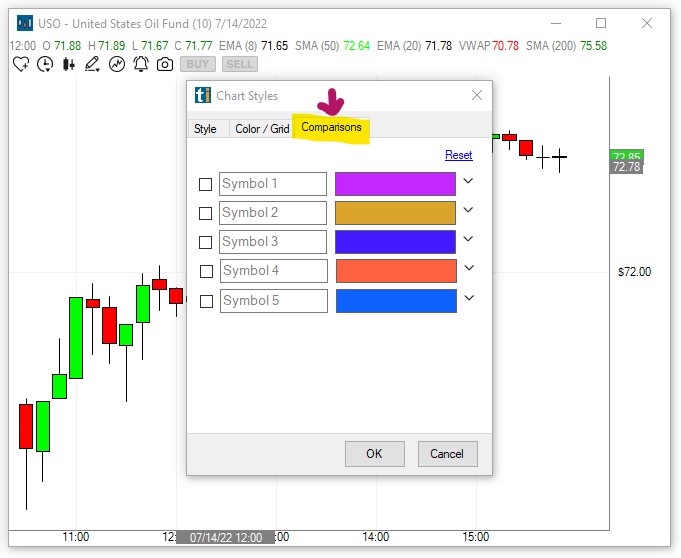
Enter stock symbols into the Symbol Fields 1 to 5, and add checkmarks to add the symbols to the chart.
The Reset Link will clear all entered symbols.
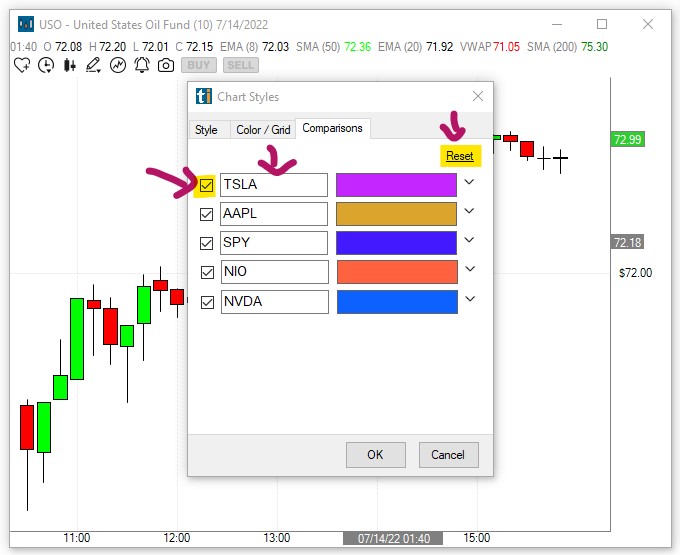
Clicking the small downward-pointing arrow on the right-hand side of the color field, will open the color picker window.
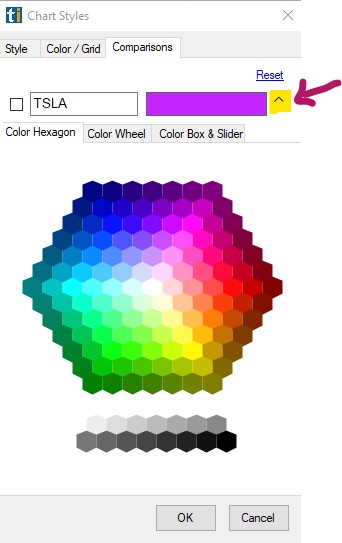
Since the 5 comparison symbols will be displayed as lines, it is advisable to change the style of the base chart to a Line Chart as well.
To do so, head to the Style Tab and select Line from the dropdown:
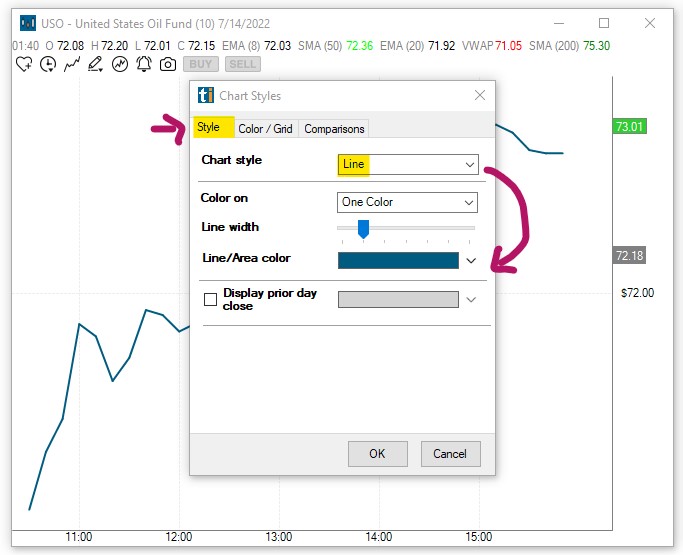
Press OK once you're ready to compare the stocks on your chart.
The Status Line at the top of your chart, will display the symbol of each stock in its given color. When hovering over the line of a stock on the chart, the price at that level will be displayed in the Status Line.
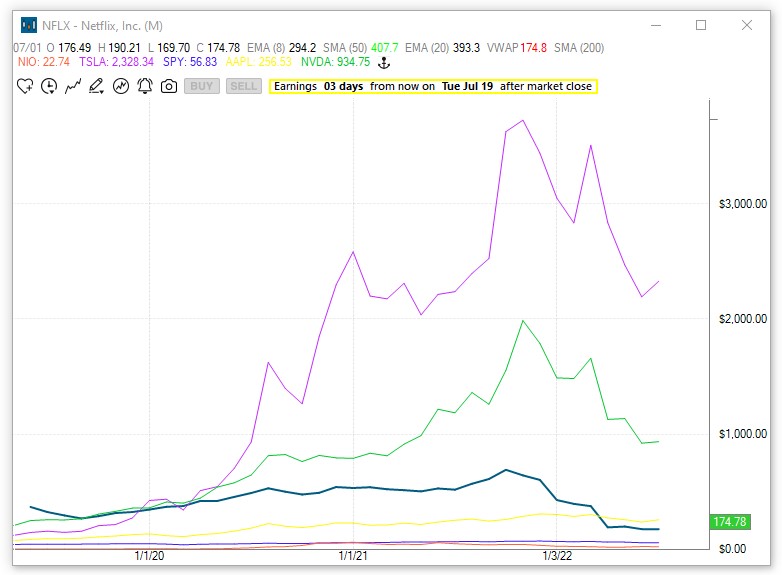
A simple click on a symbol in the Status Line, will bring up the Change Symbol Field, enabling you to easily enter a different symbol for comparison.
Press Enter to confirm the symbol change.
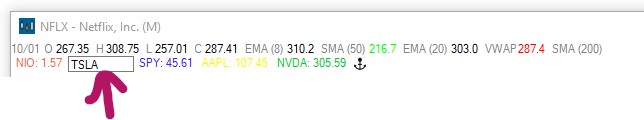
The Anker Icon enables you to Anker all compared stocks to a specific price level of the base stock.
To place an Anker, click the Anker Icon.
Next, move your cursor to the price level of the main chart symbol.
You will see that your cursor has turned into a small upward-pointing arrow.
Click into the chart to place the anker at a specific price level.
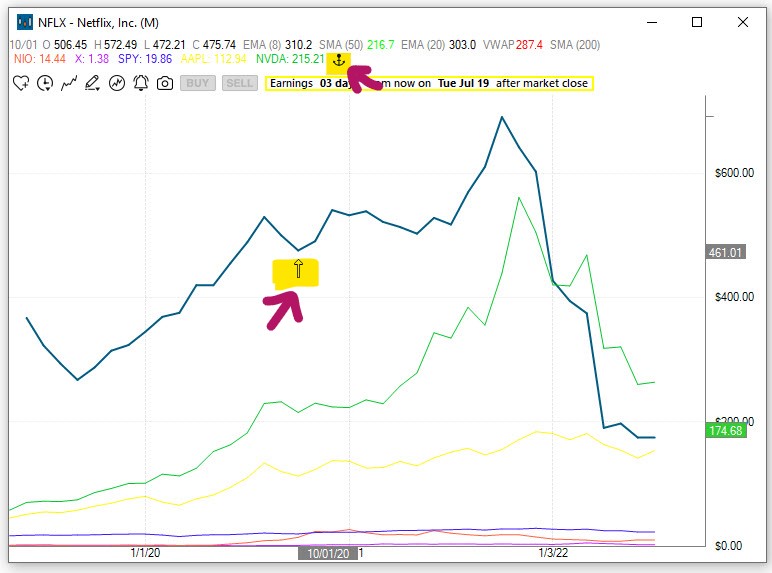
The date and time of the Anker level will be displayed in the Status Line. To remove the Anker, click the Bin Icon in the Status Line.
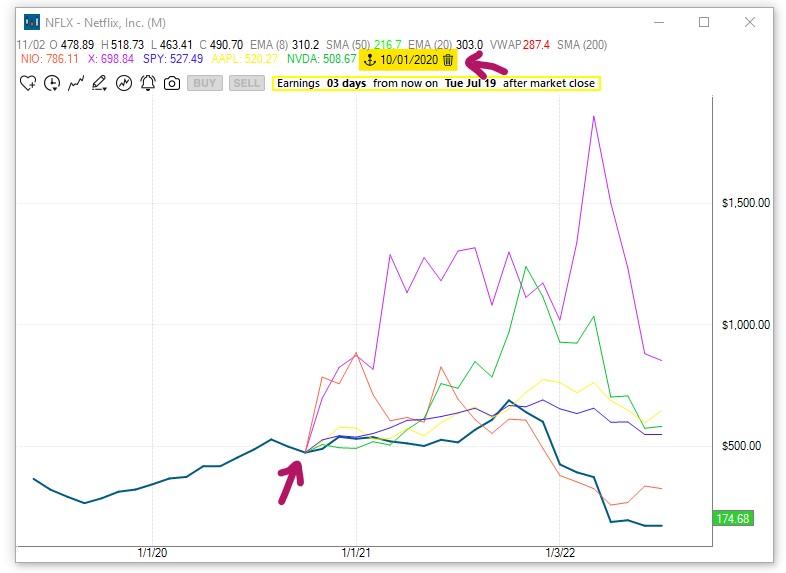
Pinned
To keep a single Trade Ideas window on your screen permanently, even when switching layouts, or toggling through channels, right-click into the specific window, and select Pinned from the dropdown.
Once a window is pinned, it does not follow the behavior of the other windows.
This is useful if you would like to include one or more windows of a channel in a custom layout, without saving the individual windows to the Cloud first.
It is important to note, that this window will stay open until you decide to unpin it. When accidentally saved within a layout, It might load multiple times, when closing and re-opening this layout. At worst, you will have multiple versions of the window all running on top of each other in the same position. This can put a strain on system resources and drastically impact software performance. The pinning option should therefore be used very carefully and consciously. A window should always be unpinned after the desired action is completed.
To do this, right-click into the window and remove the checkmark on Pinned.
To see all pinned and unpinned windows, or to close them, go to the Toolbar, select Windows, and choose, Close All Unpinned, or Close All Pinned.
Save or Share to Cloud
Once you have made adjustments and added the indicators you'd like to see on your chart, make sure to save it to the cloud for future use.
-
Right-click into the chart and select Save or Share to Cloud
-
Enter a new name into the Name field or keep the automatically added one.
-
Enter a description for your new chart or leave the Description field blank.
-
If you would like to automatically close any other open layout or channel in the future, whenever you load this new chart, select Clear Previous Layout. If you would like to load this chart on top of any already opened layout, leave this checkbox blank.
-
Select Save when you are done or select Save and Share to share your chart with others before saving it to the cloud.
-
There are various sharing options:
-
Scan the QR code
-
Select Copy All, to save the Cloud link to your clipboard and paste it into an email or messaging app.
-
Click the Twitter icon and include a text message if you like. If you haven't connected Trade Ideas to Twitter yet, a Twitter Authorization Form will open. Log in with your Twitter username and password. Then click, Authorize App. Thereafter, copy the displayed Pin Code into the field at the bottom left-hand side of the chart and select Confirm.
- Select OK when you are done.
Your new chart is now stored in your cloud, from where it can easily be retrieved. Just go to the Toolbar, open the File Tab and choose Load from Cloud. To find a saved layout item, you can enter its name in the Search Field, or scroll through the list. Just highlight the layout item, that you would like to open, then choose Load.
Save As
Apart from saving your windows to the cloud, you can also save them to your local PC in order to create a backup. This is especially useful if you have spent a lot of time and effort customizing your scans and layouts. Just right-click into your window and select Save As from the dropdown. This will bring up the standard Save file dialog. Enter a name for the file and choose a folder to save it to. By default, it will be saved in your local TradeIdeasPro folder. Lastly, press the Save button.
To load these .WTI files, open the File Tab of the Toolbar, and select Load Window.
Save as Default
You can save a window and its configuration as the default version of this window type by right-clicking and choosing Save As Default. Whenever you now open a new window of this type from the New Tab of your Toolbar, the window configuration that you saved as default, will load.
The Load Window option, which you can find in the File Tab of the Toolbar, provides access to all the default versions of your Trade Ideas windows. The default layouts of your Chart, Single Stock, Brokerage Plus, and AI Windows are saved in the TradeIdeasPro folder on your local computer.
Indicators
You can add a variety of Indicators to your Charts.
To do so, right-click into the Chart and select Indicators. This will open the Indicator Manager Window.
Selecting an Indicator from the Add Tab on the left-hand side, will color its name orange and enable editing its settings on the right-hand side.
Choose a display color by selecting Modify Color. The Indicator Color Chooser Window gives you the option to Use One Color or to define different colors for Up and Down. In addition to that, you can set Color Gradients.
Check the box Show in Status Line, if you would like to see the indicator values displayed below the chart header.
Choose New Chart Area to see the Indicator in its own area below the main Chart.
Select Chart Area #1 (main) for the indicator to display in the main Chart area.
Please note that you can add more than one individual indicator area to the bottom of the Chart window.
Finally, select the Indicator Periods you would like to display.
Once you have configured your indicator, click Add to add it to the chart.
To edit or remove an already placed Indicator, select the Edit Tab on the left-hand side, which will list all the already chosen and displayed Chart Indicators. Select the Indicator that you would like to edit, then make the desired changes on the right-hand side. Thereafter press Save.
To permanently remove an Indicator from the Chart, select it, then press Remove. Press Close once you're done.
Make sure you have the Show Indicator option enabled in your charts. Right-click, select Properties and then, Show Indicators.
Another way to quickly add Indicators to the Chart is to use the icons found on the top left-hand side of the Chart Window.
A click on the Indicator Icon will open the Indicator Manager.
The process of adding, editing, or removing indicators is the same as outlined above.
Use Browser Interface
Our HTML Charts with advanced annotation tools and picture-in-picture charting are now loading as default charts.

Switching between Legacy Charts and PiP-Charts
To switch from a Legacy Chart to a PiP Charts, right-click into the chart and select Use Browser Interface.
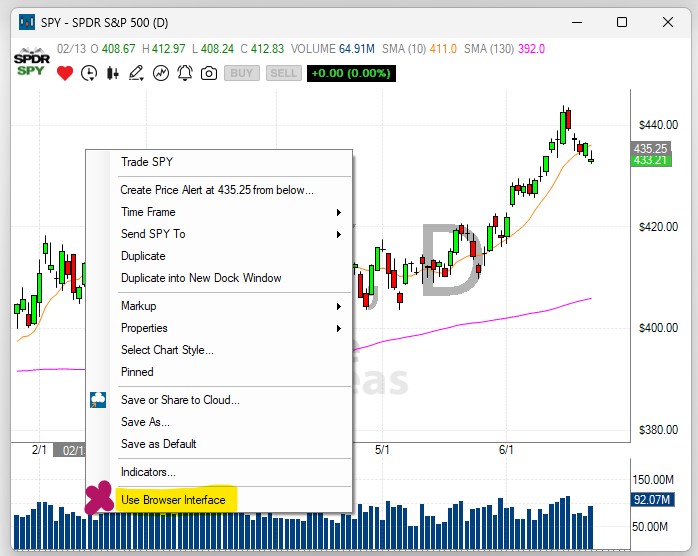
PiP-Chart Stock Data
By default, our PiP-Charts display certain key metrics like Float, Market Cap, Volume, Days to Cover etc. of any given stock at the top.
To hide this data, simply click on the upward pointing arrow on the right-hand side just below the metrics.
PiP-Chart Annotation Tools
To access the advanced annotation and drawing tools of the Browser Interface Charts, click on the small pen icon located just below the stock icon.
This will reveal a host of annotation tools, including chart emojis.
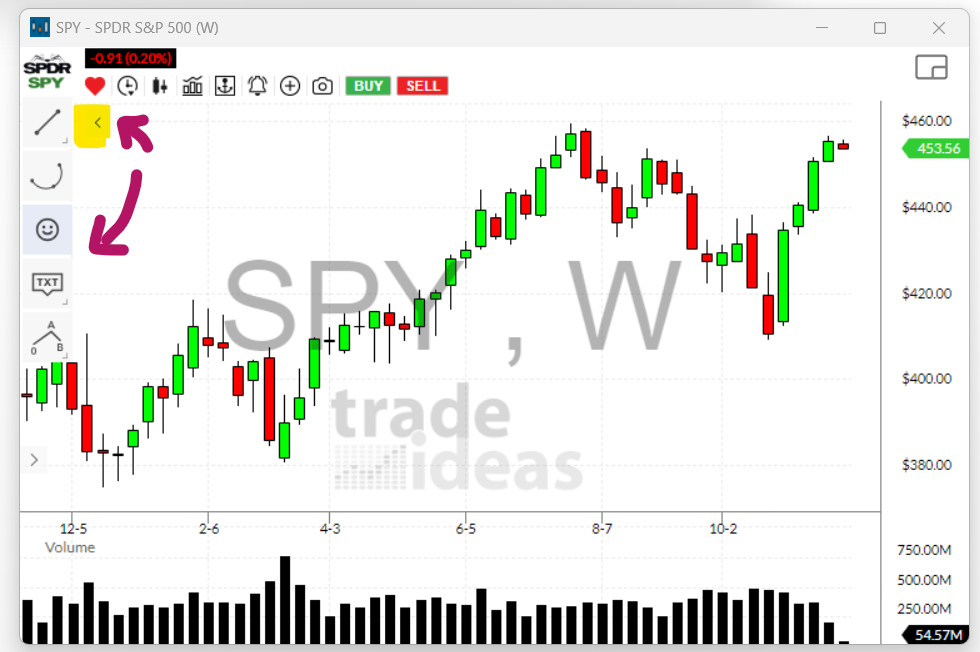
-
Clicking on the small downward-pointing arrow of a particular markup tool will reveal even further options
-
To select a particular tool, click on it, then place your cursor in the chart area you would like to markup.
-
Once the chart annotation is placed, a small menu will appear on the top right-hand side of the chart enabling you to specify settings or delete the markup
Secondary Chart
-
To hide and reveal the small secondary chart located on the bottom left-hand side, click the small arrow.
-
To change the time frame of the secondary chart, click on the small clock icon.
-
To quickly switch the time frames of the main chart and the secondary chart, click the folder icon in the top right-hand side of the main chart.
-
Price Alert can be set in the main chart as well as in the secondary chart. Once activated, they will show on both charts.
Default Chart Type
You can control which chart type, our Legacy Charts or the HTML Charts, are loaded by default. To adjust the default settings, go to the Toolbar, open the Tools Tab, select Options and then Charts.
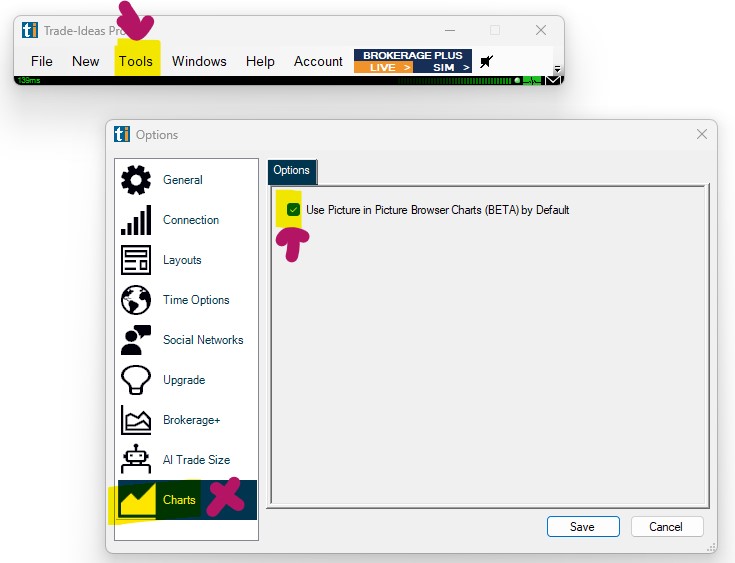
-
To make our legacy charts the default, remove the check-mark Use Picture in Picture Browser Charts by Default.
-
To use the Picture in Picture Browser Charts, no actions need to be taken, simply leave the setting as is.
Chart Icons
You will find a number of icons on the top left-hand side of your charts. They provide quick access to various chart features, which are also accessible via the Right-Click Menu of your charts. You can select the Time Frame and the Chart Style, add Markup and Price Alerts, as well as place orders directly on your charts via the Buy and Sell icons. A click on any of the icon will reveal further options.
The individual icons are discussed in the following sections.
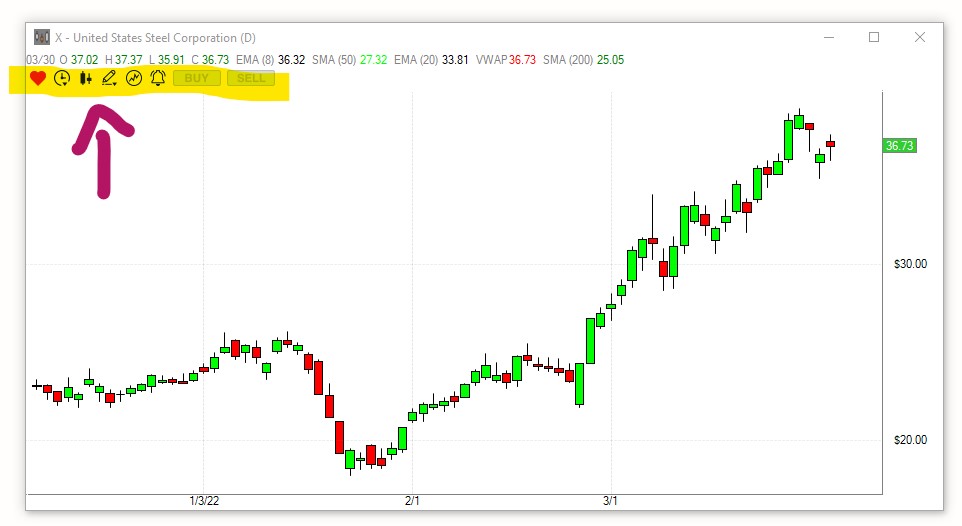
Heart Icon - My Liked Symbol List - Stocks I Like Channel
Every chart has a heart icon in the top left-hand corner that will turn red when clicked. Every stock that has been marked with a red heart, will be listed in the My Liked Symbol List, which is linked to the Stocks I Like Channel of the Channel Bar.
To open the Channel Bar, go to the Toolbar, open the New Tab and select Channel Bar. Scroll through the Channels of the Channel Bar and click on the Stocks I Like Channel to open it.
The Stocks I Like Channel contains the My Liked Symbols Top List and the My Liked Symbols Stream Alert Window.
The Top List ist a plain Watchlist, it shows the stock's filter data, but since none of the filters have values defined in the Windows Specific Filters Tab of the Top List Config Menu, no stocks get filtered out.
The Symbol Lists Tab of the Top List Config Menu, which you can access via right-click and then Configure, shows that it is pointed at the My Liked Symbol List.
Since Top Lists have a 30-second refresh cycle, it might take a few seconds until a newly hearted stock will be displayed in the My Liked Symbols Top List.
The My Liked Symbol Stream Alert Window in the Stocks I Like Channel alerts you when something interesting is happening with any of the red-hearted stocks.
You are not restricted to only using the Top List and Alert Window in the Stocks I Like Channel but can point any scan at the My Liked Symbol List. Just right-click into the scan, select Configure and find the My Liked Symbol List in the Symbol List Tab. Have a look at the Symbol List Tutorials for more details on how to include or exclude Symbol Lists in your scans.
To remove a stock symbol from the My Liked Symbol List, uncheck the heart in the stock's chart or go to the Symbol List section of your Account Management page on our website.
Here, select Edit to remove or add stocks to your My Liked Symbol List. Thereafter select, Update List.
Please note, If you decide to rearrange or modify the Stocks I Like Channel or add your own Top Lists to it, make sure to save the entire layout to your cloud, so you can use it again. The channels of the Channel Bar are fixed and will always open the same way, so any modifications will be lost after a restart.
To save your new layout to the Cloud, go to the Toolbar, open the File Tab and select Save Layout.
Chart Style Icons
To quickly change the style of your chart, use the Chart Style Icon found on the top left-hand side of the Chart Window.
You have the choice between Candlestick Charts, Line Charts, Bar Charts, Area Charts, HLC Charts or OHLC Charts.
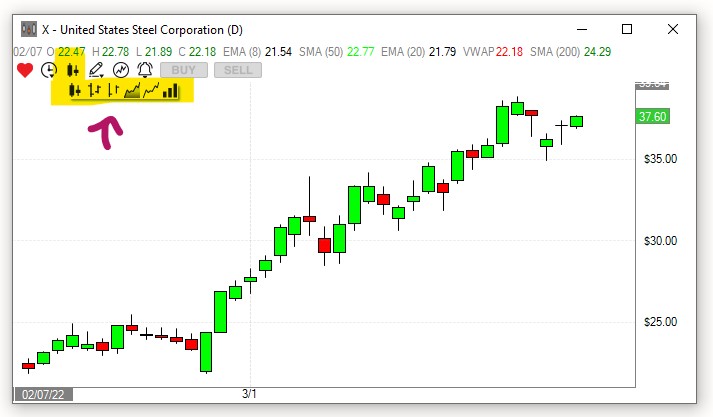

Anchored VWAP Indicator
Together with the markup options, you will find the Anchored VWAP Indicator Icon on the top left-hand side of the Chart Window. To place it, click on the Anchor icon, then click on the candle you would like to anchor the indicator to. The AWVAP will be added to your chart and the price of the AVWAP as well as the Date and Time of the Anchor will be displayed in the Status Line.
The AVWAP can provide invaluable insights into the sentiment of the overall market or individual stock. It's a great combination of Price, Volume, and Time. When this market trifecta is measured together it allows us to objectively identify the emerging sentiment from that point. Because of its moving property, the AVWAP can be analyzed in the same way as traditional moving averages, by looking at its slope, its direction, and its distance from the price.
Markup Icons
To quickly add Annotations to the Chart use the icons found on the top left-hand side of the Chart Window. You will find icons for a Horizontal Line, a Trend Line, an Arrow, and Text Annotation there. To place an Annotation on your chart, click on one of these icons, then move your mouse to the desired location on the Chart. Click into the Chart to add the Annotation. You can change the Annotation position via drag and drop, you can change the size or direction of Trend Lines and Arrows via grab and drag.
To quickly change the color of any Chart Annotation, select it on the Chart, then click Color Changer Icon and make a color selection. To remove an Annotation, simply select it on your Chart, then press the Delete key on your keyboard.
Buys and Sell Icons
In addition to the One-Click Trading Feature, you can also trade directly from a chart by using the Buy & Sell Icons in the top left-hand corner of the Chart Window.

In order to use these icons, you first have to set up your Default Chart Long Strategy and your Default Chart Short Strategy in the Brokerage Plus Module.
If you have already set up a One-Click Order Entry Template or would like to use one of the Preset One-Click Order Entry Templates as your default Chart Trading Strategy, follow these steps.
-
Open the Brokerage Plus Module Learn More
-
Connect to your Brokerage Account or Simulator Learn more
-
Head to the Strategies Tab
-
Highlight the Trading Strategy you would like to use
-
Right-click and check Default Chart Long Strategy or Default Chart Short Strategy.
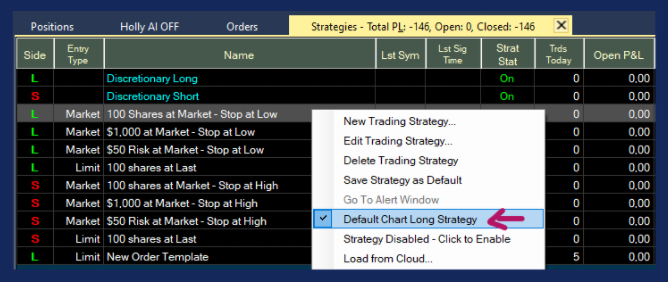
If you would like to apply personalized Stops and Targets to your Chart Order and have not yet set up a One-Click Order Entry Template, follow the steps in this section first.
To trade via the Chart Buy and Sell Icons, follow these simple steps:
-
Click once on either the Buy or the Sell Icon
-
Your cursor will now show a cross
-
Move your cursor cross to the price level in the chart at which you would like to buy/short the stock
-
Click into the chart
Your Default Chart Long Strategy or Default Chart Short Strategy will now automatically be applied.
Your order will be sent directly to your brokerage/simulator with the configured Entry and Exit parameters.

A blue line will indicate your Opening Order Level, a red line will indicate your Stop Loss Level, and a red line will indicate your Target Price.
Once your order is filled, the blue line will disappear and the projected Loss and Profit in Dollars will be displayed at the Target and Stop Loss line.
All orders can be adjusted directly on the charts by moving the lines via drag & drop with your mouse.

Your trade will also be displayed in the Positions Tab of Brokerage Plus. Whenever you adjust the Target or Stop, by moving the line on the chart, it will automatically be updated in Brokerage Plus as well.
Troubleshooting Tip:
If your Buy and Sell Chart Icons are ready to be used, they will be green/red.
If the Buy and/or Sell Icons are greyed out, you are either not connected to your Brokerage/Simulator or have not enabled a strategy as your Default Chart Long Strategy and/or Default Chart Short Strategy.

Earnings Icons
A stock's earnings date is marked with a yellow E icon above the date axis of the chart as well as a yellow vertical line.
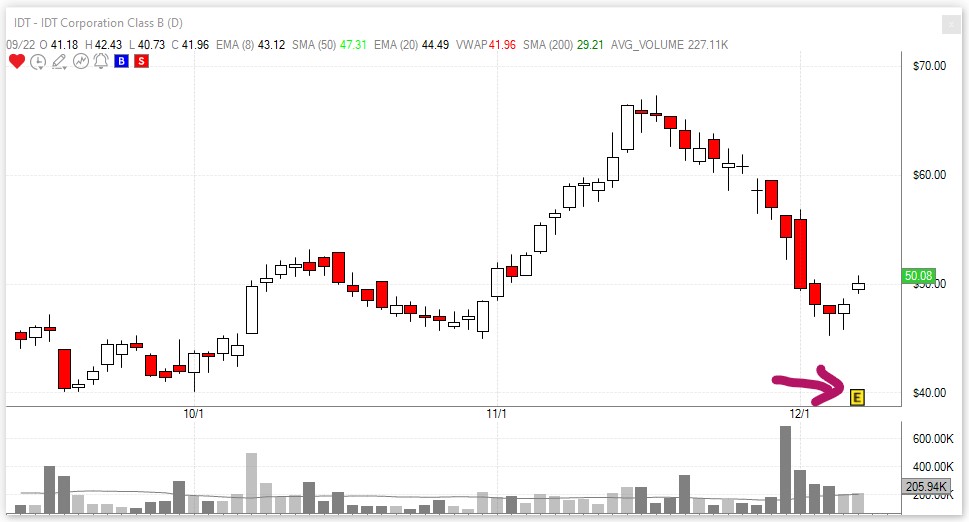
Earnings info is also displayed in the status line above the chart.
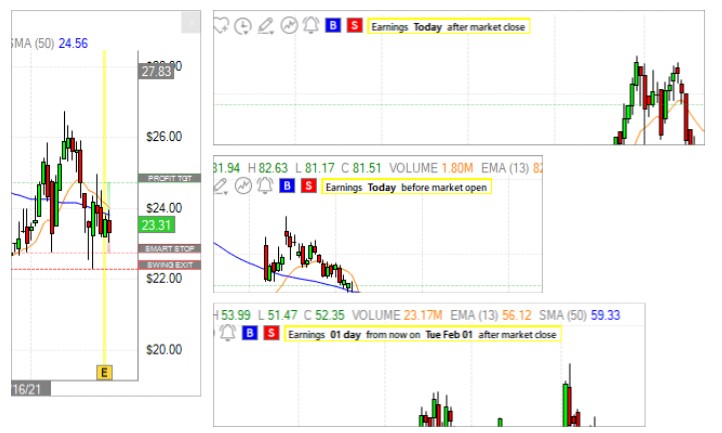
Halt Notification
While a stock is halted, you will see a red Halted notification above the chart.
The notification disappears once trading resumes.
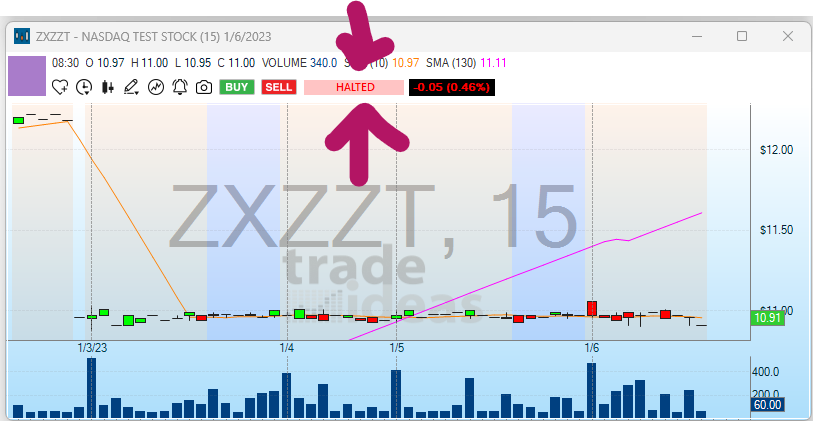
Camera Icon
To make it as easy as possible for our Affiliates to promote Trade Ideas whilst showcasing their trades and setups, we have created this Chart Sharing Feature.
To connect your Twitter account, go to the Toolbar, open the Tools Tab, select Options and then Social Networks.

Here, click on the Twitter Icon and follow the prompts.
To share your chart including all markup, together with your affiliate link on social media, click the Camera Icon.
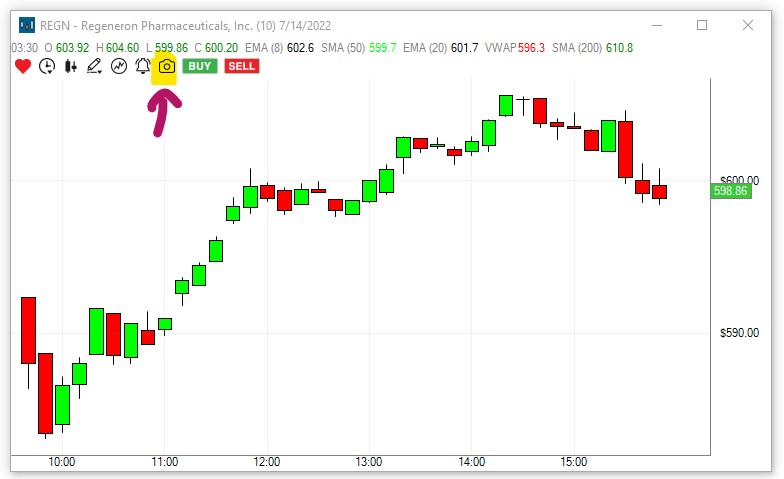
This will open the Screenshot Share Window.
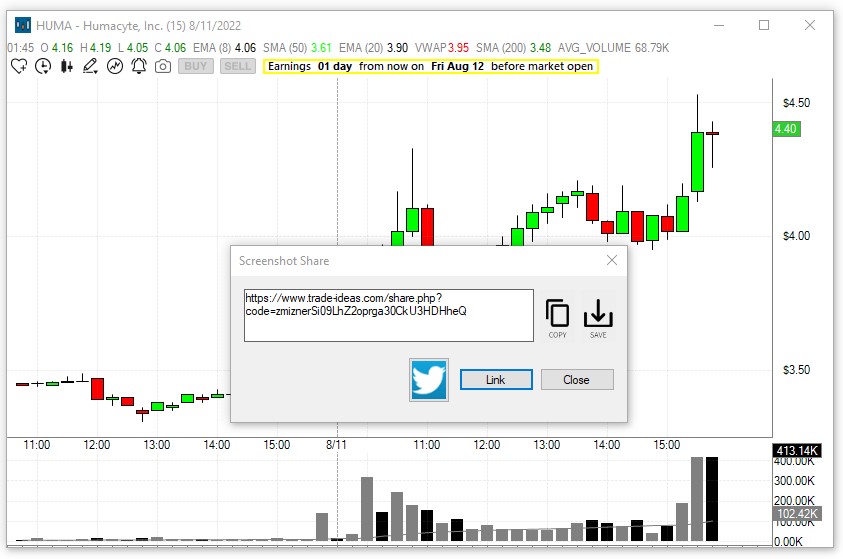
Click the Twitter Icon to share the chart on Twitter.
Click the Copy Button to copy the link and post it on social media.
Click the Save Button to download a .png image of your chart to a folder on your PC.
Click the Link Button to load your chart in your browser window.
To automatically embed your Affiliate Link in every shared chart, head to the Accounts Management Page and login with your username and password.
Here, navigate to the Affiliate Information section and enter your Affiliate Id and Tune Promo Code:

Once completed, every chart shared via the Camera Icon will contain your tracking link, and personal Tune Promo Code, enabling you to generate new leads/signups/commission.
Price Alerts Window
Our software enables you to set up Price Alerts for stocks. These Price Alerts will be displayed not only visually in the charts, but are also listed in the Price Alerts Window. Once the selected price is reached, the Price Alerts Window will pop up to alert you visually and you can additionally enable sound alerts. You can add Notes to your Price Alerts as well as an expiration date and time. In addition to that, you can share them with fellow traders.

To open a new Price Alerts Window, go to the Toolbar, select New, and then Price Alerts Window.
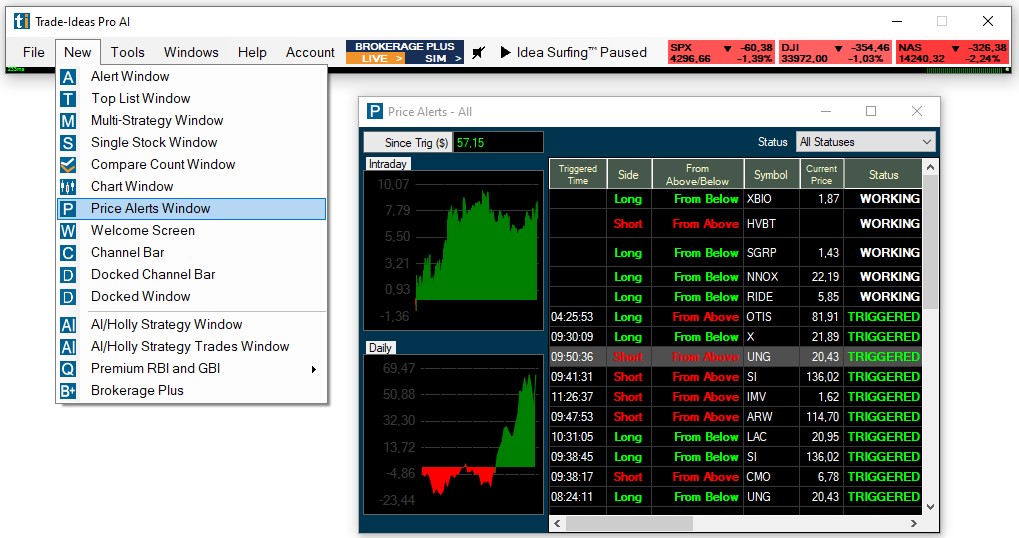
The right-click Menu provides access to all the features of the Price Alerts Window.
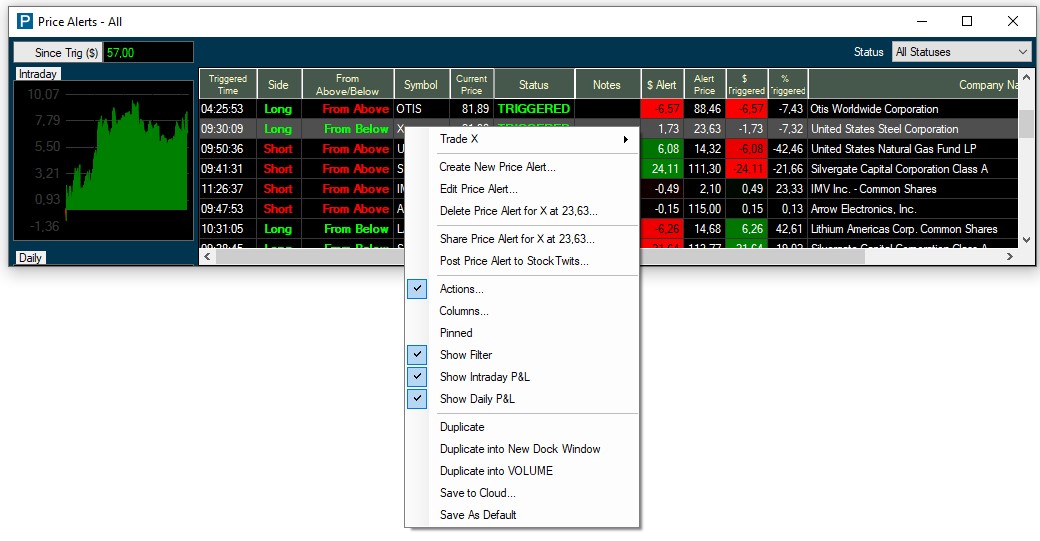
Trade XYZ
You can trade stocks right from the Price Alerts Window via our One-Click Order Feature. Simply highlight a stock, then right-click into the Price Alerts Window and select Trade. This will bring up a dropdown menu with preconfigured order templates when connected to the Brokerage Plus Module.
How to create a custom Order Entry Template:
Create New Price Alert
Our Price Alerts Feature enables you to highlight price levels that are of interest to you and to receive alerts when said levels are reached.
To create a new Price Alert, go to the Toolbar, select New, and then, Price Alerts Window.

Now, right-click into your Price Alerts Window and select, Create New Price Alert.
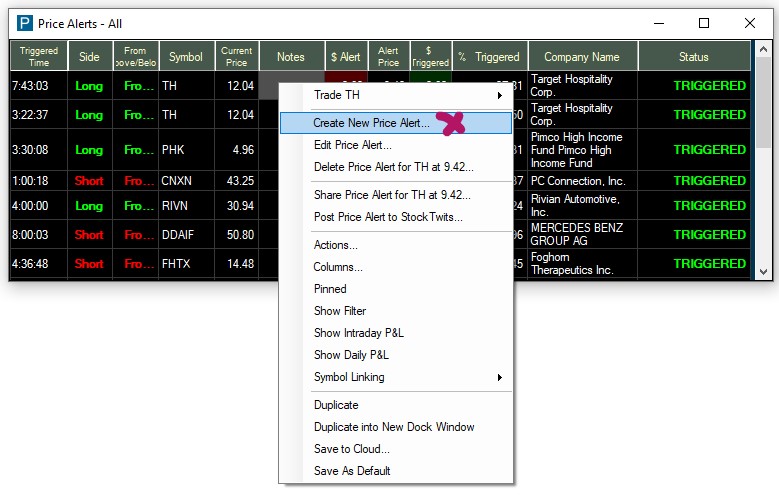
Alternatively, open a Chart from the Toolbar, then move your mouse cursor to the price level you would like to be alerted to. Now, right-click into the Chart, and select Create Price Alert.

The Create Price Alert Window will open, where you can apply further settings.

It will show the Symbol and the Alert Price you have defined, as well as the Current Price of the stock, and the Distance in Dollars, to your Price Alert Level.
Below, the Direction of the necessary price move to reach the defined Price Alerts Level, based on the Current Price, is automatically listed, together with it being a Long or a Short.

Furthermore, you can define an Expiration Date and Time, on which the Price Alert will become invalid.

Alternatively, or in addition to that, you can define a Price Level that, if reached by the stock, will invalidate the current Price Alert.
To prevent your Price Alerts from triggering in the pre- and postmarket, uncheck the option Trigger Alert After Hours.
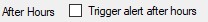
Finally, you can add some personal Notes to the Price Alert. The Notes field is very helpful since it can contain details of the trading strategy to apply, should the Price Level of the Price Alert be reached.

The bottom of the Create Price Alert Window displays a written Summary of your configured Price Alert.
After hitting Save, a blue line will be placed on the Chart, indicating the Price Level of the Price Alert. The Price Alert will also be added to the Price Alerts Window. Its status will be displayed as working until it gets triggered or invalidated.
Hovering over the Price Alert on the Chart will bring up more details about the specific Price Alert. To change the Price Level, this line can be moved via drag and drop with your mouse. To remove the current Price Alert, select the blue line with your mouse, and press the Delete key on your keyboard. A popup window will ask to Confirm Deletion. Press OK to confirm, or Cancel to abort.
Once the stock reaches the Alert Price, the Price Alerts Window will automatically pop up when it isn't already in the front. Further tutorials will discuss the Price Alerts Window in more detail.
Edit Price Alert
To edit an existing Price Alert, highlight it in the Price Alerts Window, then right-click and select Edit Price Alert.
This will bring up the Edit Price Alert Window where you can make your adjustments.
Alternatively, you can move the blue line on the chart representing the Price Alert to change the Price Alert Level.
Delete Price Alert
To remove an existing Price Alerts, highlight one or multiple Price Alerts in the Price Alerts Window, then right-click and select Delete Selected Price Alert(s).
A popup window will ask to Confirm Deletion. Press OK to confirm or Cancel to abort.
Alternatively, highlight the blue line on the Chart representing the Price Alert, and press the Delete key on your keyboard. A popup window will ask to Confirm Deletion.
Press OK to confirm, or Cancel to abort.
Share Price Alert
You can share your Price Alerts with your colleagues, followers, and friends. Simply right-click into the window and select Share Price Alert. This will bring up the Share This Link Window, which offers various sharing options:
Scan the QR code
You can scan the displayed code with any QR reader app available on your phone. Thereafter, you can share it with other users of our desktop program.
Select Copy All, to save the Cloud link to your clipboard and paste it into an email or messaging app.
Click the Twitter icon to share the Price Alerts Cloud Link on Twitter and include a text message if you like. If you haven't connected Trade Ideas to Twitter yet, a Twitter Authorization Form will open. Log in with your Twitter username and password. Then click, Authorize App. Thereafter, copy the displayed Pin Code into the field at the bottom left-hand side of the window and select Confirm.
Select OK when you are done.
Actions - Sound Notifications
In addition to being visually alerted via the Price Alerts Window popping up, you can additionally be alerted by sound. To set up Sound Notifications for the Price Alerts, right-click into the Price Alerts Window and select Actions. A Right-Click in the Alert Window will open the Options Menu.
Check Play Sound in the new popup window. Then click Set Up Sound.
The next window will display built-in sound options. You can choose an asterisk, a beep, exclamation, a stop, or text to speech.
If you choose the Text-To-Speech Option, a female voice will call out each stock symbol that triggers.
Further below, you can choose a custom sound from your local computer. Please note that custom files need to be in WAV format, the system isn't able to use MP3.
Once you have selected a Sound Option, click Play to test the audio. Use the Balance and Volume sliders to adjust the sound to your liking.
Hit Okay when you are done.
Columns
The Price Alerts Window columns can be reorganized via drag and drop. The individual columns can also be extended or compressed by using your mouse.
To add more columns right-click into the Price Alerts Window and select Columns.
The left-hand side shows the already listed columns, the right-hand side shows the columns that can be added.
Select additional columns by highlighting them with a mouse click.
Click the arrow pointing to the left to move them to the Selected Columns field.
To remove any of the already selected columns, highlight the column, then click the arrow pointing to the right.
Click OK when you are done.
Pinned
To keep the Price Alerts Window on your screen permanently, even when switching layouts, or toggling through channels, right-click into the specific window, and select Pinned from the dropdown.
Once a window is pinned, it does not follow the behavior of the other windows.
This is useful if you would like to include one or more windows of a channel in a custom layout, without saving the individual windows to the Cloud first.
It is important to note that this window will stay open until you decide to unpin it. When accidentally saved within a layout, It might load multiple times, when closing and re-opening this layout. At worst, you will have multiple versions of the window all running on top of each other in the same position. This can put a strain on system resources and drastically impact software performance. The pinning option should therefore be used very carefully and consciously. A window should always be unpinned after the desired action is completed.
To do this, right-click into the window and remove the checkmark on Pinned.
To see all pinned and unpinned windows, or to close them, go to the Toolbar, select Windows, and choose, Close All Unpinned, or Close All Pinned.
Show Filter
The Show Filter option enables you to choose if you would like to see the Price Alerts Status Filter on the top right-hand side of the Price Alerts Window.
The filter enables you to find all Triggered, all Expired, all Working, and all Invalidated Price Alerts or a combination thereof.
Show Intraday P&L
When the Show Intraday P&L option is selected via the right-click Menu, you will see the Intraday Profit & Loss displayed on the left-hand side of the Price Alerts Window.
The Intraday P&L is based on your Price Alerts. It is calculated by comparing the current price of the stock to the Price Alert Level. The total sum for today is displayed as the Intraday P&L.
The Intraday P&L shows if your Price Alert and the chosen direction, long or short, have worked in your favor or not.
Show Daily P&L
When the Show Daily P&L option is selected via the right-click Menu, you will see the Daily Profit & Loss displayed on the left-hand side of the Price Alerts Window.
The Daily Profit & Loss is based on your Price Alerts. It is calculated by comparing the current price of the stock to the Price Alert Level. The total sum of all triggered Price Alerts is displayed as the Daily Profit & Loss.
The Daily Profit & Loss shows if your Price Alert and the chosen direction, long or short, have worked in your favor or not.
Symbol Linking
Most Trade Idea Windows, including Alert, Top List, Multi-Strategy, and Compare Count Windows as well as the Holly AI Windows, RBI, GBI, and Price Alerts can be symbol-linked to a Chart or Single Stock Window.
This means that when changing your windows stock symbol, your symbol-linked Chart or Single Stock Window will automatically change as well, and display the specific stock’s data.
By default, all symbol-linked free-floating Windows belong to the blue, Link to All, Color Group.
By default, all docked Windows are assigned to the pink, Dock Window, Linking Group. In "Pink Mode" only the menu items contained in the indiviual dock respond to symbol changes.
The assigned color group will always be displayed in the top left-hand corner of each window.

You can create up to 4 additional Linking Groups and by doing so, link selected windows to a specific Chart or Single Stock Window, which is very useful when monitoring various scans.
There are two ways to create a Linking Group:
- Option 1: Assign windows individually
You can assign windows to a specific color group individually.
To enable symbol-linking for a Price Alerts Window, right-click into your window, select Symbol Linking, and choose a color from the dropdown. The selected window will now display the Color Group in the top left-hand corner.
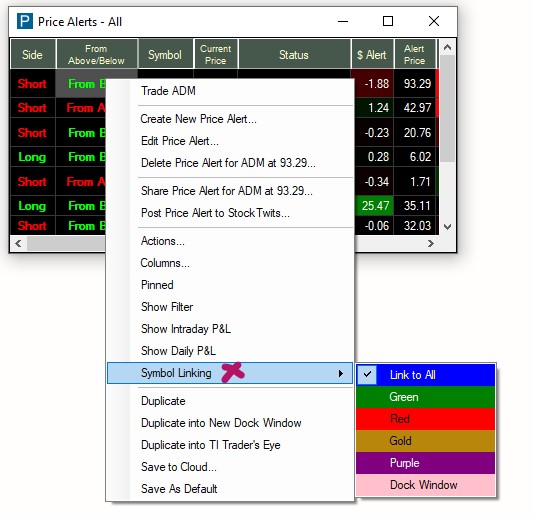
To enable symbol-linking for a scan, right-click into your window, select Symbol Linking, and choose a color from the dropdown. The selected window will now display the Color Group in the top left-hand corner.
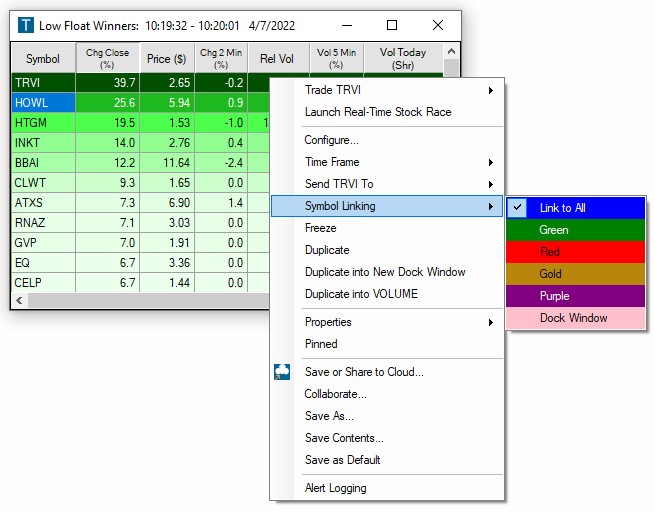
To enable Symbol Linking for a Single Stock Window, right-click into it, and select Symbol Linking.
Then, add a Checkmark to the left-hand side of the Symbol Linking option.

To enable Symbol Linking for a Chart, right-click into it, select Properties, and then Symbol Linking. Now, add a Checkmark to the left-hand side of the Symbol Linking option.

- Option 2: Assign multiple windows at once
To establish a Linking Group for a number of windows at once, go to the Toolbar, open the Tools Tab, and select, Symbol Linking Groups.
The next window will display all the Trade Ideas windows currently in use.

By default, each free-floating window is assigned to the blue, Link to All, Linking Group.
By default, each docked window is assigned to the pink, Dock Window, Linking Group. In "Pink Mode" only the menu items contained in the indiviual dock respond to symbol changes.
To establish a new Linking Group, select the windows that will be part of the new Linking Group by adding a checkmark.
You can select all windows at once by choosing, Select All, at the bottom.

You can clear your selection by selecting, Clear Selected, at the bottom.
Once you have selected the windows, open the Link Groups dropdown in the top left-hand corner. Select a color for your new Linking Group, then choose, Set All Selected, to assign the windows.

All the selected windows will now display the color of the Linking Group you have assigned them to.
To see all windows that are assigned to a specific Linking Group, choose the Group Color from the Link Groups dropdown, then select, Filter By. To see all available windows, select, Clear Filter.

Once you have assigned the windows, select Close.
All the windows that you assigned to a Linking Group will now display the Group Color in the top left-hand corner.
Any Single Stock Window or Chart that has been assigned to the same Color Group will update accordingly, whenever you change a stock symbol in one of the other Linking Group windows.
Please note, that even when a Single Stock Window and Chart have been assigned to a specific color group, they will always also be linked to the Blue Color Group since this is the default Link to All Group. This means in turn that any window that is assigned to the blue linking group will be linked to all open SingleStock Windows and Charts.
Duplicate
To copy your current Price Alerts Window, use the Duplicate function.
Simply right-click into your Price Alerts Window and select Duplicate from the dropdown. You will get an exact copy of the current window, which you can modify while keeping the original window intact.
Duplicate into New Dock Window
To open a copy of a free-floating window in a new Dock, right-click into the free-floating window and select Duplicate into New Dock Window.
An exact copy of your free-floating window will now be opened in a new Dock.
Duplicate into XYZ Dock
To load a copy of a free-floating window into an already open Dock, right-click into the free-floating window and select Duplicate into XYZ Dock, where XYZ stands for the Name of that particular Dock.
An exact copy of your free-floating window will now be added to the chosen Dock.
Save to Cloud
Once you have made adjustments to your Price Alerts Window, like rearranging columns, setting up Sound Alerts, make sure to save it to the cloud for future use.
Right-click into the window and select Save to Cloud.
Enter a new name into the Title field or keep the automatically added one.
Enter a description for your Price Alerts Window or leave the Description field blank.
If you would like to automatically close any other open layout or channel in the future, whenever you load the Price Alerts Window, select Clear Previous Layout.
If you would like to load this scan on top of any already opened layout, leave this checkbox blank.
Select Save when you are done or select Save and Share to share the Price Alerts Window with others before saving it to the cloud.
You can share your Price Alerts with your colleagues, followers, and friends. Simply right-click into the window and select Share Price Alert. This will bring up the Share This Link Window, which offers various sharing options:
Scan the QR code
You can scan the displayed code with any QR reader app available on your phone. Thereafter, you can share it with other users of our desktop program.
Select Copy All, to save the Cloud link to your clipboard and paste it into an email or messaging app.
Click the Twitter icon to share the Price Alerts Cloud Link on Twitter and include a text message if you like. If you haven't connected Trade Ideas to Twitter yet, a Twitter Authorization Form will open. Log in with your Twitter username and password. Then click, Authorize App. Thereafter, copy the displayed Pin Code into the field at the bottom left-hand side of the window and select Confirm.
Select OK when you are done.
Your Price Alerts Window is now stored in your cloud, from where it can easily be retrieved. Just go to the Toolbar, open the File Tab and choose Load from Cloud. To find a saved Price Alerts Window, you can enter its name in the search field, or scroll through the list. Just highlight it, then choose Load.
Save as Default
You can save a Price Alerts Window and its configuration as the default version of this window type by right-clicking and choosing Save As Default. Whenever you now open a new window of this type from the New Tab of your Toolbar, the window configuration that you saved as default, will load.
The Load Window option, which you can find in the File Tab of the Toolbar, provides access to all the default versions of your Trade Ideas windows. The default layouts of your Chart, Single Stock, Brokerage Plus, and AI Windows are saved in the TradeIdeasPro folder on your local computer.
Welcome Screen
The Welcome Screen provides an overview of and access to some of the different Channels of the Channel Bar and some individual bullish and bearish strategies.
In addition to that, it describes some of the Trade Ideas Windows and Tools and provides easy access to them.
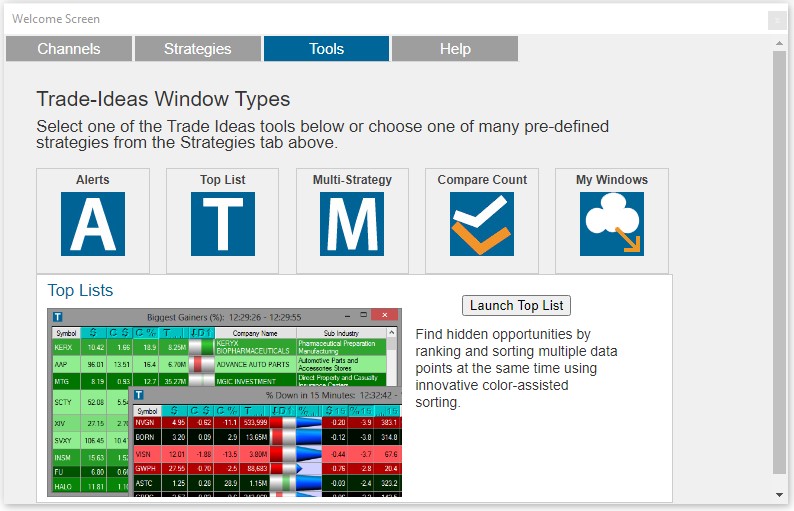
Channel Bar
For more information about the Channel Bar jump to the main Channel Bar Section.
Real-Time Stock Race
The Real-Time Stock Race is a unique way of data visualization that distills the stock market action down to its essence and combats the information overload many traders face.
It enables you to see important metrics generally displayed in our spreadsheet-like Top List Windows in a straightforward and engaging way. Your top-ranking stocks will race against each other, helping you to see winners, the losers, and the ones in the middle field at a glance! You can use any Top List Window of your choice.
For step-by-step instructions head to the following Stock Race sections:
Race Startup
There are three ways to start up a Stock Race. From the Toolbar, from our Channel Bar and directly from any Top List Window.
Option 1:
Go to the Toolbar, open the New Tab and select Real-Time Stock Race:
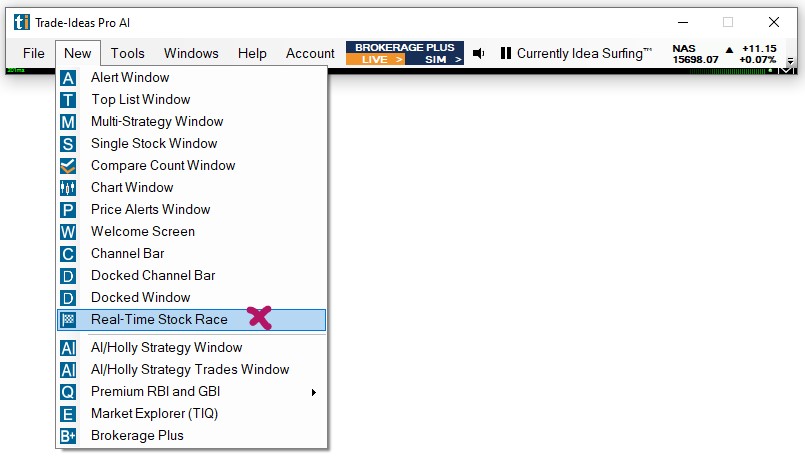
This will load preset races for selection:
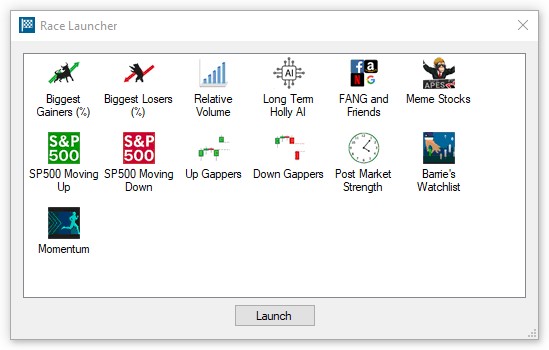
Make a selection, then press Launch to initiate the race.
To use/create a specific Top List for your race, jump to Option 3.
Option 2:
Select one of our dedicated Stock Racing Channels from the Channel Bar to see our stock racing in action.
Many of our other channels, for example the Momo-Mentum, Alpha Predator and Premarket Channel also contain preconfigured Stock Races for ease of use:
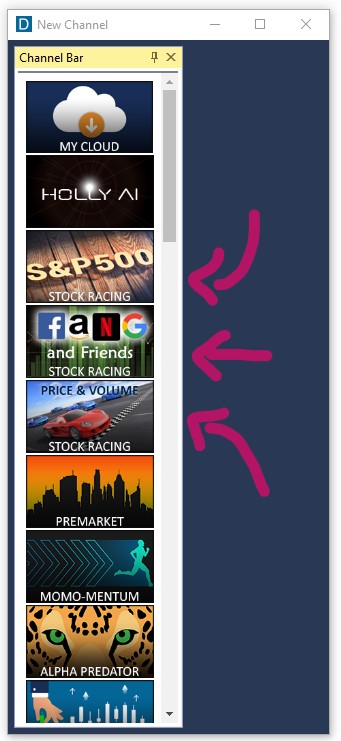
Option 3:
You can also access the Real-Time Stock Race Setup from any open Top List Window.
Simply right-click into your Top List Window and select Launch Real-Time Stock Race.

This will automatically start a race.
To view the Race settings, right-click into the race window and select Show Race Setup.
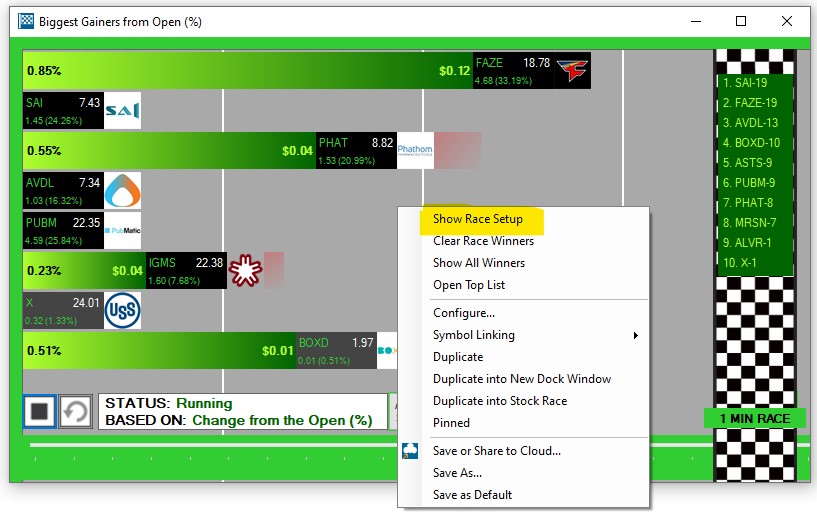
To change the Race settings, right-click into the race window, select Show Race Setup.
Stop the race using the Stop Button, then make your changes.
The configuration options are listed in this section
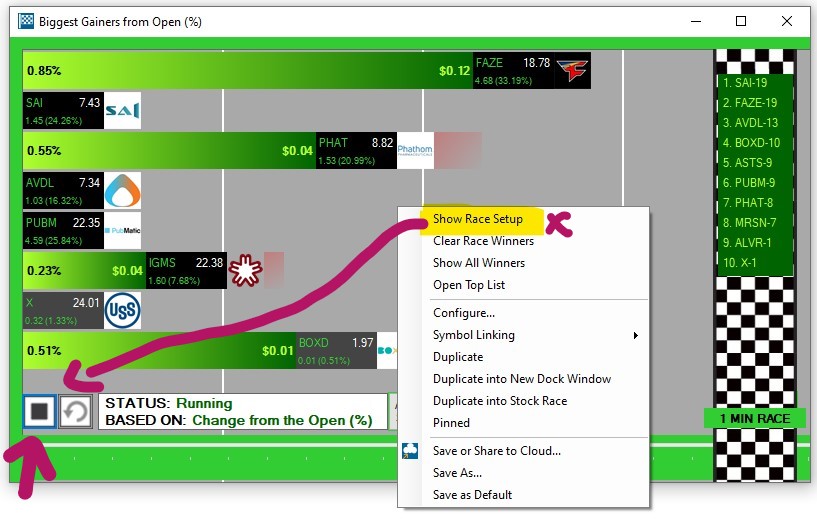
Race Config
To set up your race, right-click into the race window and select Show Race Setup

Here, you will be presented with various configuration options.
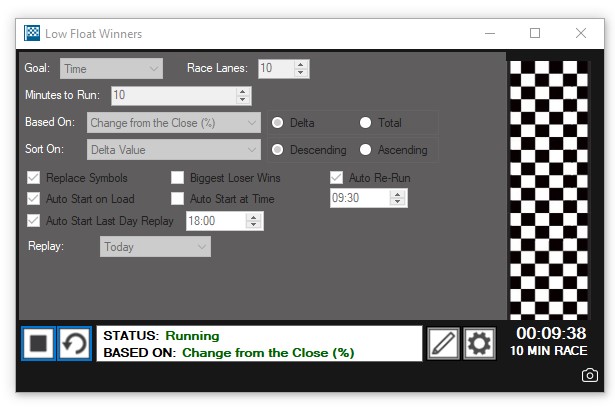
Select a specific setting below, or read on to find out more about all race options:
Race Lanes
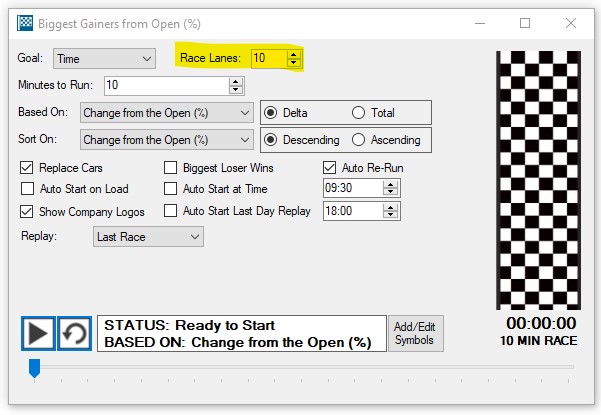
Choose how many stocks will participate in the race.
In order to run races with a large number of stocks, you will have to increase the height of your race setup window so it accommodates all race lanes. Once the race has started, the window size can be decreased again.
Based On
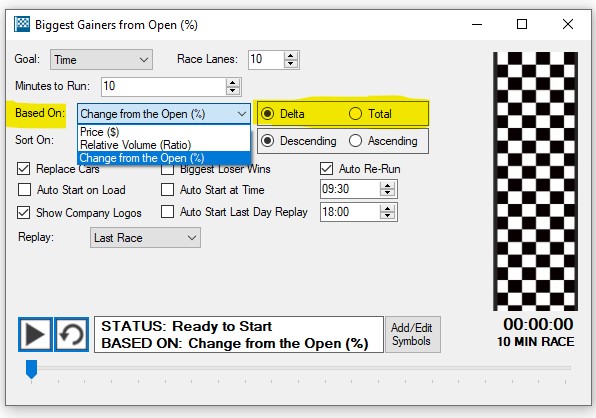
You can base the stock race on any filter that is part of your Top List. All available filters will be listed in the Based On dropdown.
-
Delta: When Delta is selected, all stocks will start equal, no matter the current filter value, and the ones with the biggest increase/change in filter value during the race will become the front-runners.
-
Total: When Total is selected, the stock with the highest total filter value will become the winner.
Sort On
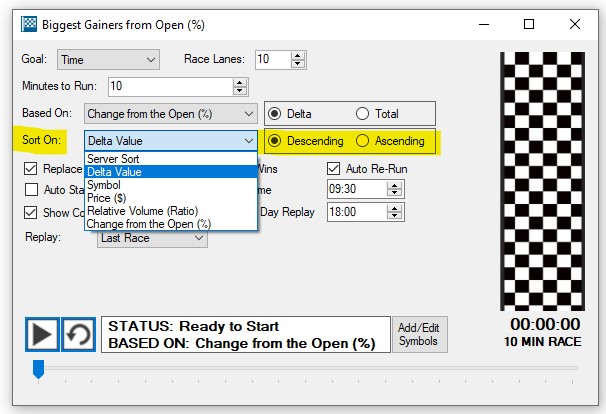
You can define the order of the stock line-up from top to bottom via the Sort On option.
If you, for example, choose Price as the sorting criterion and select descending as the direction, the most expensive stock will be at the top, whilst the least expensive one will be placed at the bottom. If you select Ascending, this order will be flipped.
If you select Delta Value - Descending, the strongest stocks will be ranked from top to bottom.
Goal
You have two options for a goal, you can define a race time or a race target.

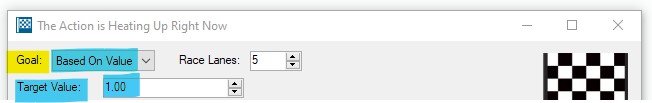
-
Time: You can set the race to end after a fixed period of time. To do so, set the Goal to Time and choose the runtime in minutes in the field below.
-
Based on Value: You can define a specific value as the race target.
To do so, set the Goal to Based on Value and enter the Target Value in the field below.
As an example, if you base your race on the filter Price (Delta) and enter 2.00 as the Goal Target Value, the race will end as soon as the first stock has gained $2.
If you base your race on Change from the Close in Percent (Total) and enter 50.00 as the Target Value, the race will end once the first stock has achieved a 50% Change from the Close.
Replace Symbols
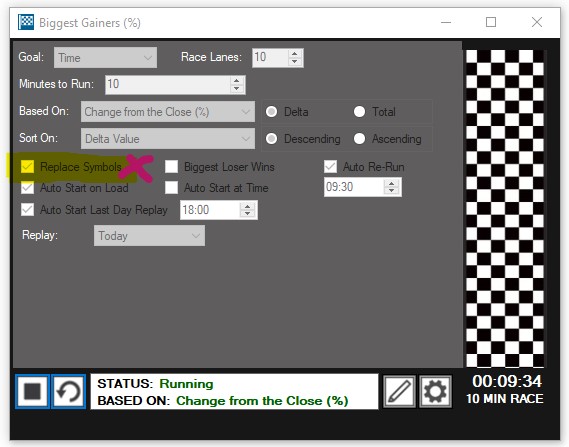
Here, you can decide whether new stocks can enter the race after it has started, or if you would like to maintain the list of stocks selected at the start of the race.
If the option Replace Symbols is enabled, new stocks that are suddenly gaining strength will replace the weakest stocks during the race.
Biggest Loser Wins
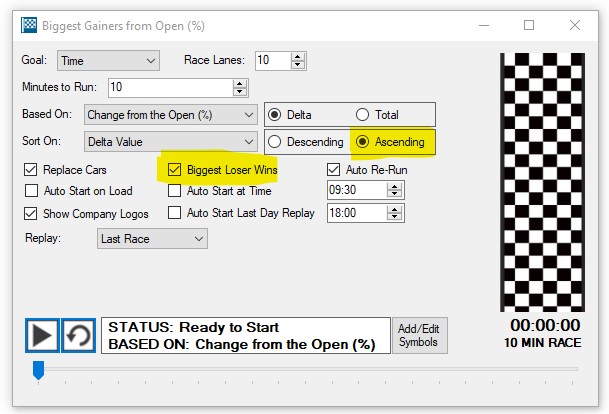
Select this option for Top Lists that scan for stocks making negative moves, e.g. Down Gappers, Top Percentage Losers etc.
If you are running any sort of Loser's race, also select Ascending instead of Descending as the Sort On option.
Auto Re-Run
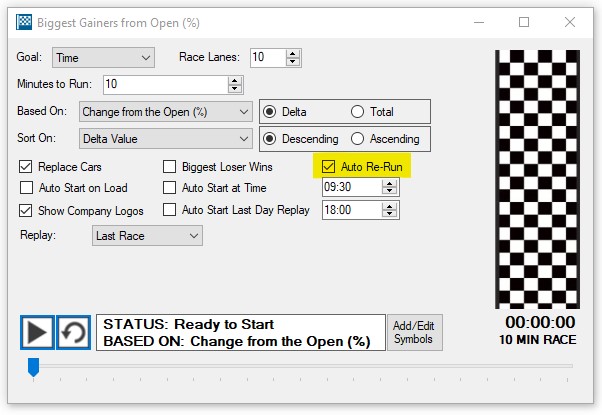
You can decide whether you would like to start a new race that's based on the same conditions as soon as the first race has ended.
If this option is enabled, the winners of each race will be listed on the right-hand side of the race window, from top to bottom.
If the race window is to narrow to show all winners, navigation arrows on top and bottom will enable you to scroll through the winner line-up.
A click on a winner tag, will reveal the second and third place as well.

To only see the top 10 Winners, right-click into the window and select Show Top 10 Winners

To see all Winners, right-click again and select Show All Winners

Use the arrows on the top and bottom of the finish line to scroll through the winners.
To clear the race winners, right-click into the race window and select Clear Race Winners.
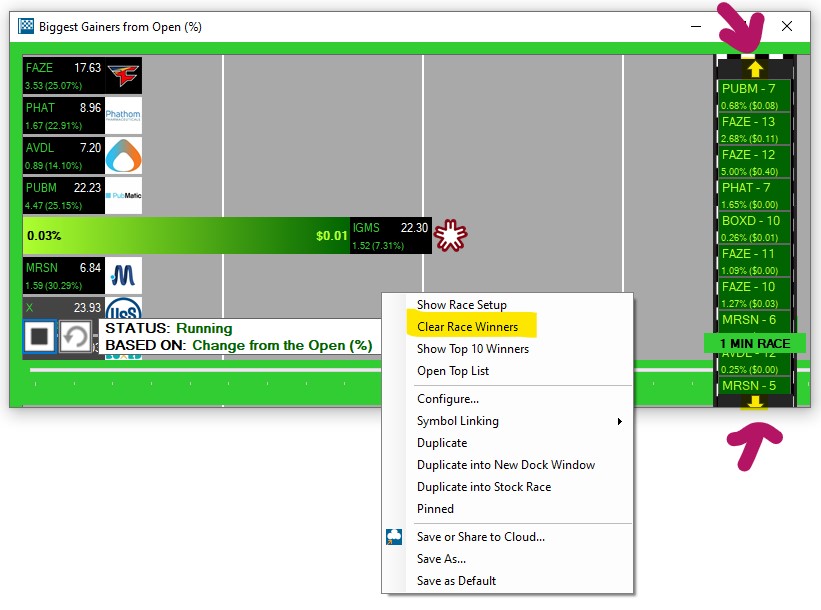
Auto Start on Load
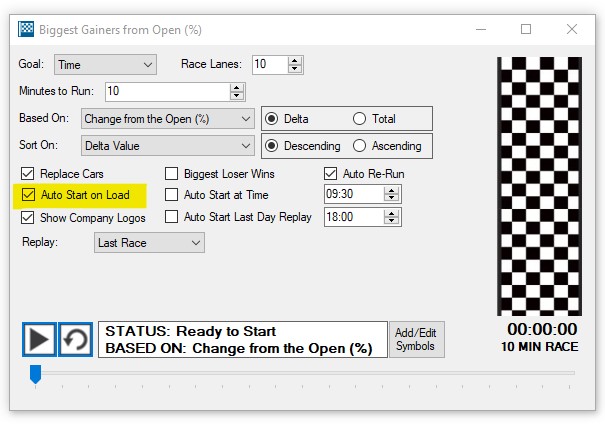
When this option is selected, your race will start automatically once you load it from the cloud or open a layout that contains this racing window.
Please note that you will need to save your race config to the cloud to retain your race setting and to enable the auto-startup.
To save your racing setup, right-click into the window and select Save or Share to Cloud.
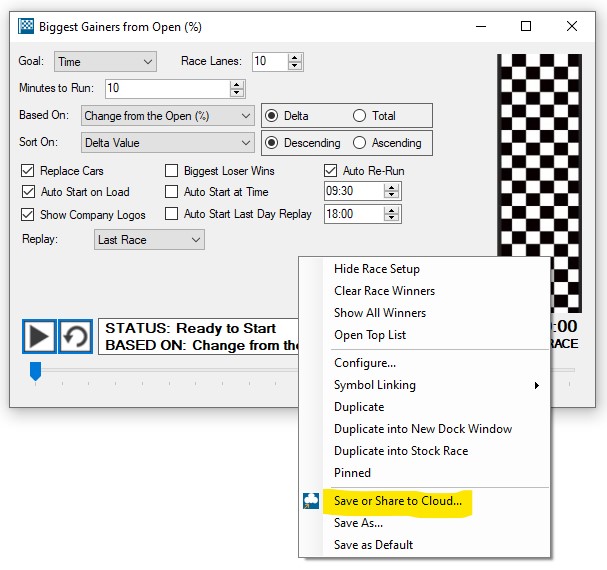
Auto Start at Time
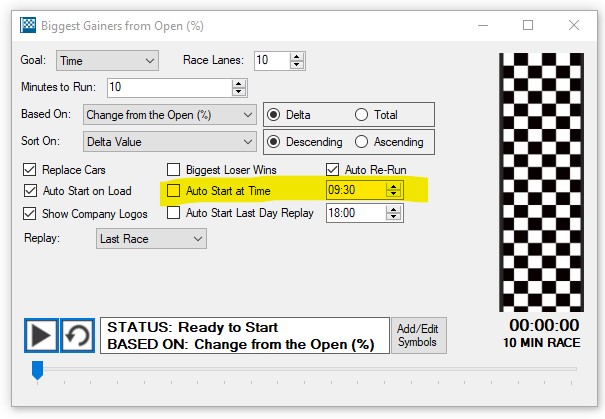
When this option is selected, your race will start automatically at the Time specified in the time field.
Please note that you will need to save your race config to the cloud to retain your race setting and to enable the timed auto-startup.
To save your racing setup, right-click into the window and select Save or Share to Cloud.
Auto Start Last Day Replay
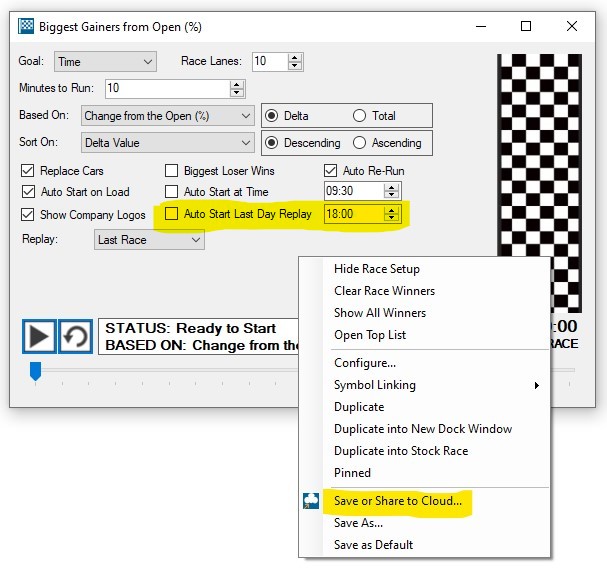
When this option is selected, the last day's action will automatically start replaying at the Time specified in the time field.
Please note that you will need to save your race config to the cloud to retain your race setting and to enable the timed auto-startup.
To save your racing setup, right-click into the window and select Save or Share to Cloud.
Replay Mode
By default, races show the winners and losers in real-time. By switching to replay mode, you can recap entire trading days effortlessly in just a few minutes. One minute of replay reflects one whole trading hour. The exact settings of the Replay Mode will depend on your Trade Ideas version.
If you're running one of our latest versions, read on and/or watch the video to set up your Race Replay.
If you are running an older version of our software, head here to see the original Race Replay Mode setup.
To review yesterday’s action, or any other time period over the past 60 odd days, right-click into the race window and select, Show Race Setup.

Choose a replay time period from the dropdown, or select the option Custom, if you have specific dates in mind.

Here, enter you dates in the Replay from, and the Replay To fields:
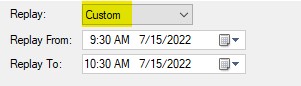
Press the dedicated Replay Button to start the replay:
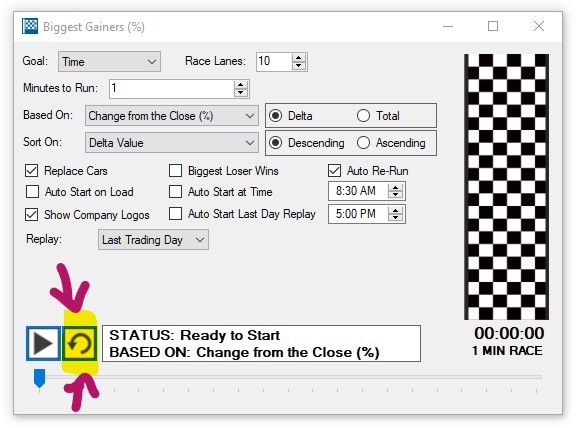
You can clearly see if a race is running in real-time or in Replay Mode.

As the race progresses in 1-hour intervals from the starting date to its end, the Status Field will display the shown time, as well as the filter, the race is based on.
On the bottom right-hand side, you can see how much time is left until the end date will be reached, as well as the total replay run-time.
Original Race Replay Mode:

When this option is selected, the race window will display historical data between the Replay From and Replay To dates.
During the replay, you will see 5 minutes of historical data every 5 seconds.
First, select a Replay From Date and Time.
Then, enter the total run time in the Minutes to Run field. One minute of run time represents one hour of historical data.
The Replay To Time and Date will automatically adjust depending on the run time specified in the Minutes to Run field.
As an example, if today is the 6th of May and you wanted to replay yesterday's entire trading day, you would do the following:
- Enter 5th of June 4:00 am in the Replay From field
- Set the run time in the Minutes to Run field to 12
- See the Replay To field automatically update to 5th June 4:00 pm
Start/Stop Button
Once you're race is set up, press the Start button on the bottom left-hand side to initiate the race.
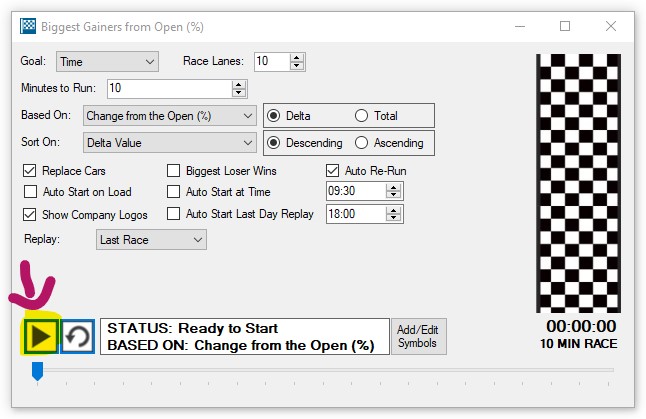
While the race is running, the race window background will be green.
To stop the race, press the Stop Button.
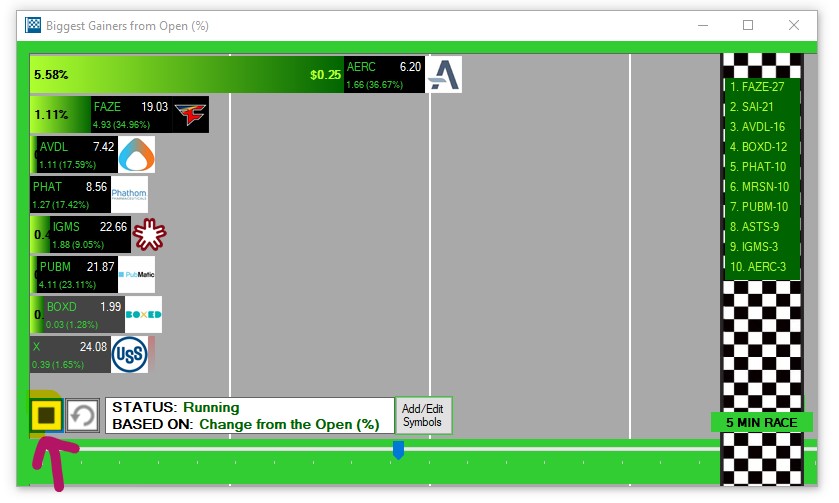
Ended and stopped races will have a red racing window background.
To switch to Dark Mode, right-click into the race window and check the option Dark Mode.
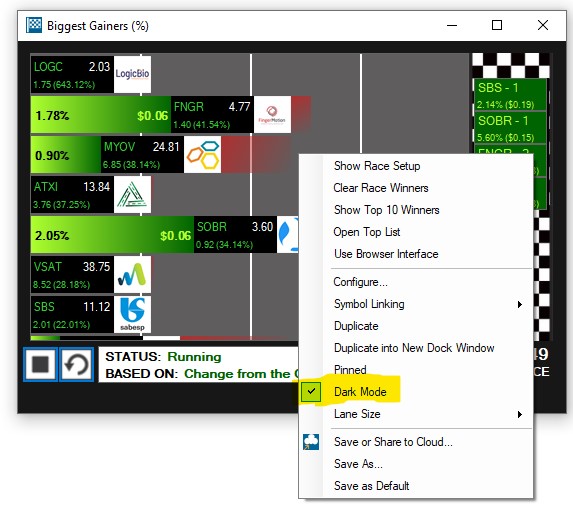
Add/Edit Symbols
The Add/Edit Symbols Button enables you to add specific tickers to your race, which aren't part of the Top List or Race. This feature allows you to compare stocks you are interested in to the stocks making moves in your race.
Press the + symbol to add a stock, then enter its ticker in the field.
To remove a stock, click the X.
To load multiple symbols from a Symbol List, choose this option, then select your Symbol List.
Please note that you might need to increase the number of race lanes first, to accommodate multiple symbols from a symbol list.
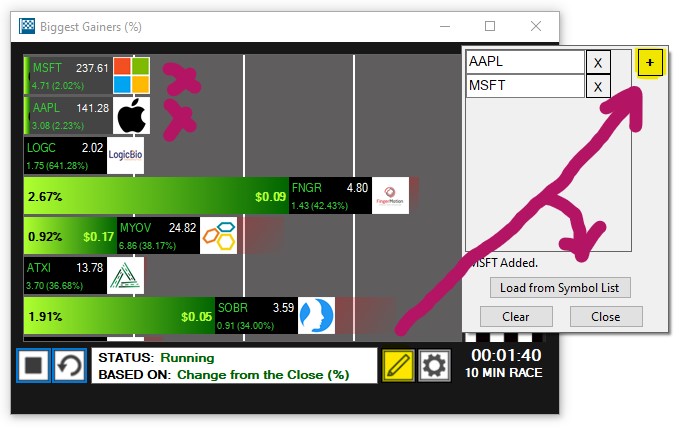
Top List Settings
The Config Button enables you to access the settings of the Top List the race is based on.
Pressing this button will stop the race and open the Quick Settings Menu. Here, you can change the minimum and maximum price of stocks, as well as Today's Volume and the Average Volume (over the last 10 days) of all stocks that will appear in your race.
To open the full Top List Config Window, select Advanced.
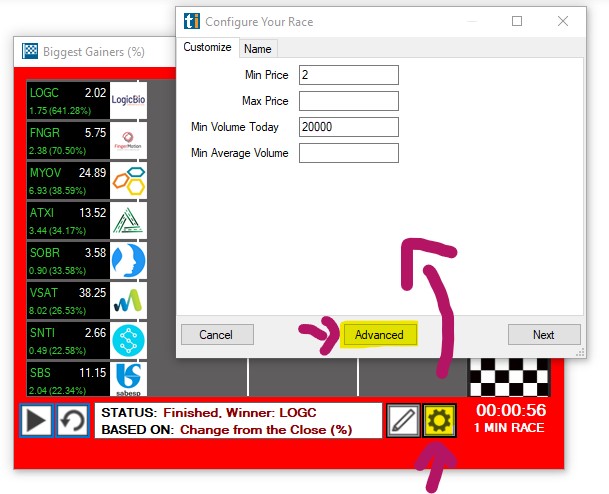
Race Right-Click
The Race Right-Click Menu contains many useful functions:
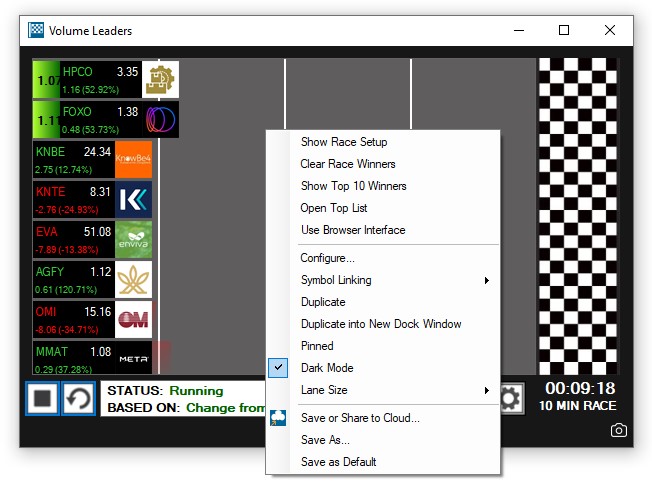
Show Race Setup
To see the race configuration, right-click into the racing window and select Show Race Setup.

To go back to the racing view, right-click again and select Hide Race Setup.
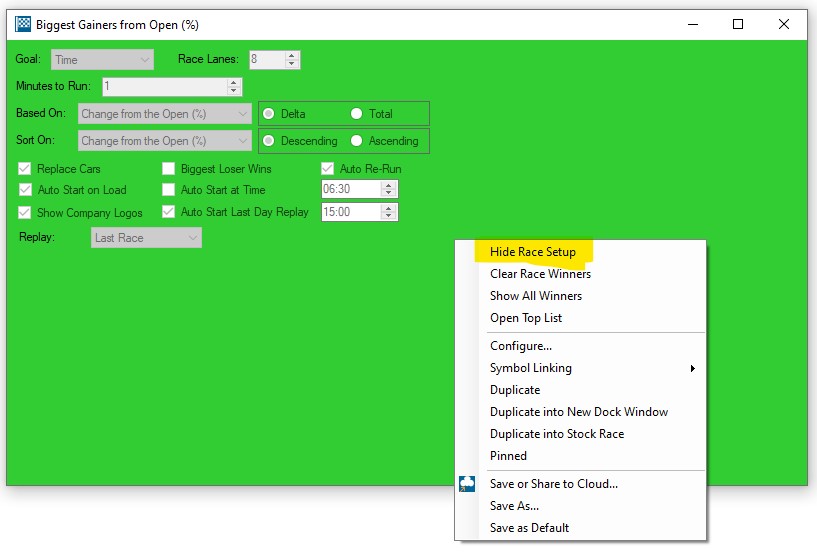
Race Winners
The Winners of each race will be listed on the finish line from top to bottom.
If the race window is to narrow to show all winners, navigation arrows on top and bottom will enable you to scroll through the winner line-up.
A click on a winner tag, will reveal the second and third place as well.
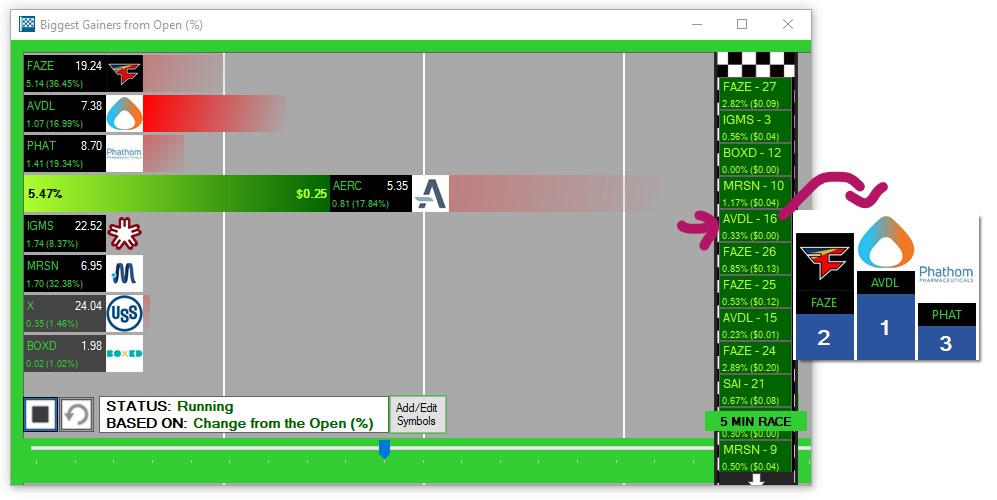
To only see the top 10 Winners, right-click into the window and select Show Top 10 Winners
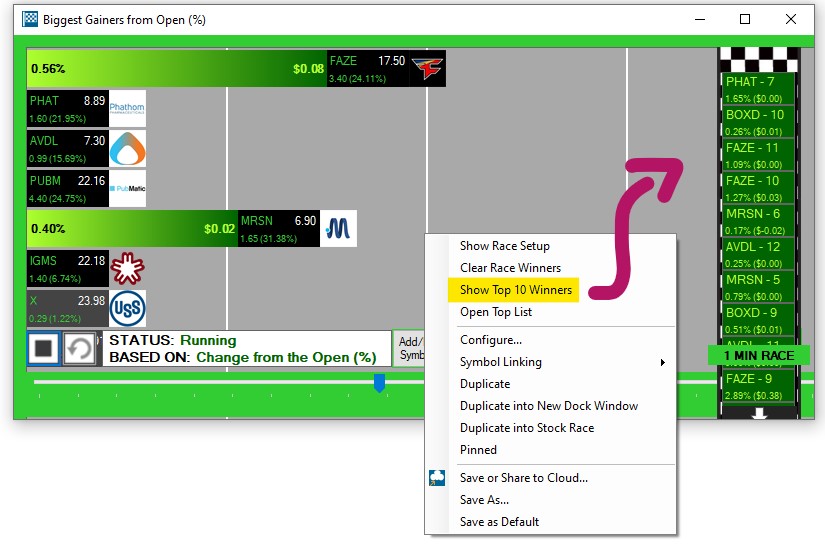
To see all Winners, right-click again and select Show All Winners
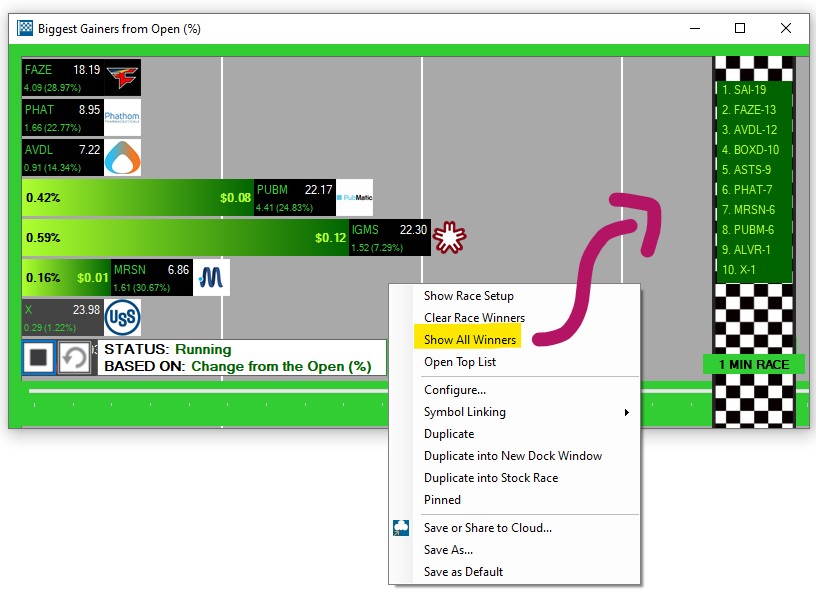
To clear the race winners, right-click into the race window and select Clear Race Winners.

Use the arrows on the top and bottom of the finish line to scroll through the winners.
Open Top List
To open the underlying Top List Window, right-click into the race window and select Open Top List:
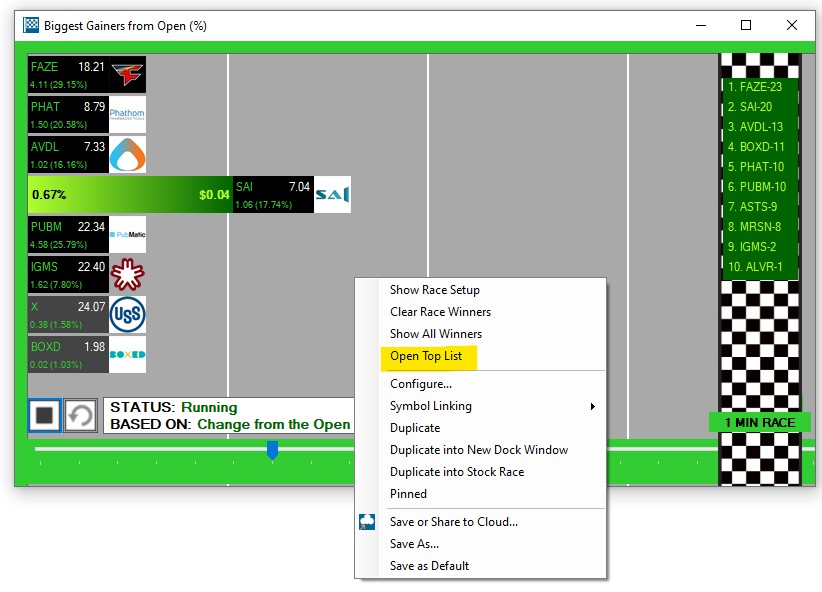
Configure
To edit the underlying Top List Window, right-click into the race window and select Configure.
This will stop the current race and open the Quick Settings Menu.
Here, you can change the minimum and maximum price of stocks, as well as Today's Volume and the Average Volume (over the last 10 days) of all stocks that will appear in your race.
To open the full Top List Config Window, select Advanced.
You can also access the Quick Settings and full Top List Config Menus by pressing the Config Button at the bottom of the race window:

Save Race Configuration
If you would like to retain your Race Configuration, save it to your cloud. To do so, right-click into the Race Window and select Save or Share to Cloud:
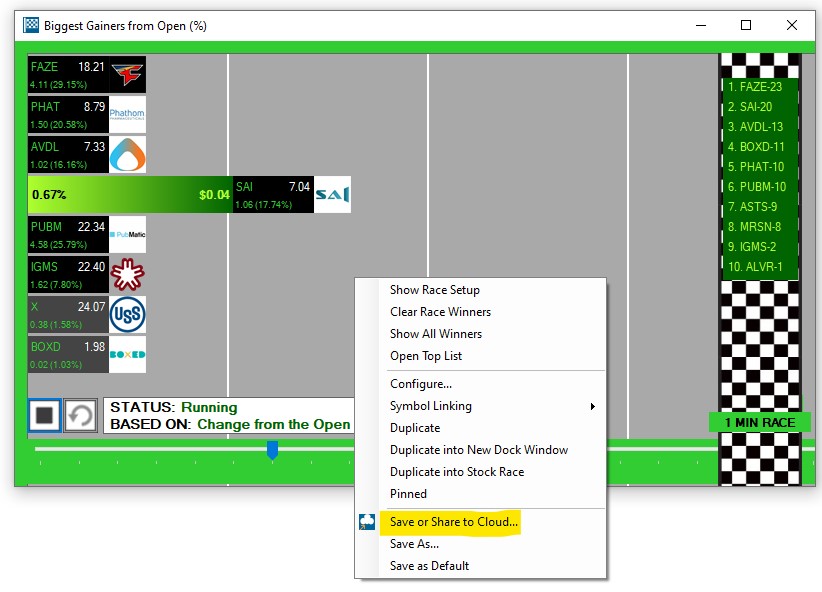
Once done, your new stock race is stored in your cloud, from where it can easily be retrieved.
Just go to the Toolbar, open the File Tab and choose Load from Cloud.
To find a saved race setup, you can enter its name in the search field, or scroll through the list.
Highlight the race, then choose Load.
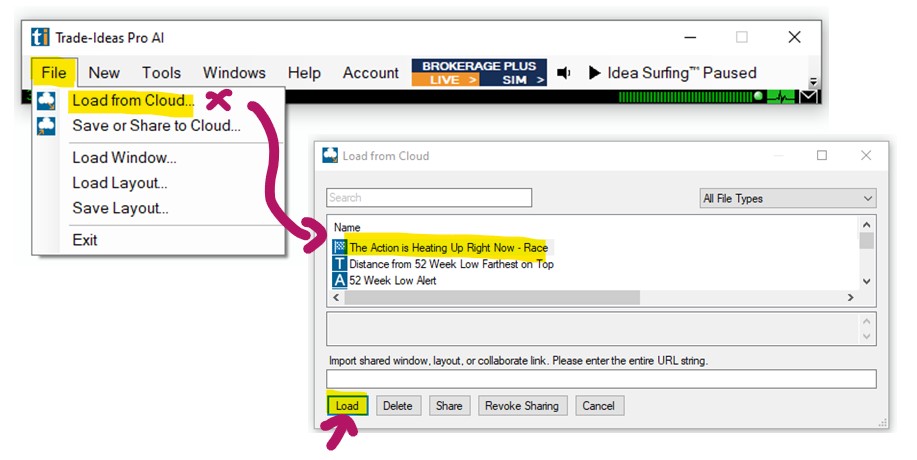
Use Browser Interface
The option Use Browser Interface is checked by default. When selected, the races will be displayed in Html5 and show much smoother transitions. This race view is in development and new functions will be added in due course.
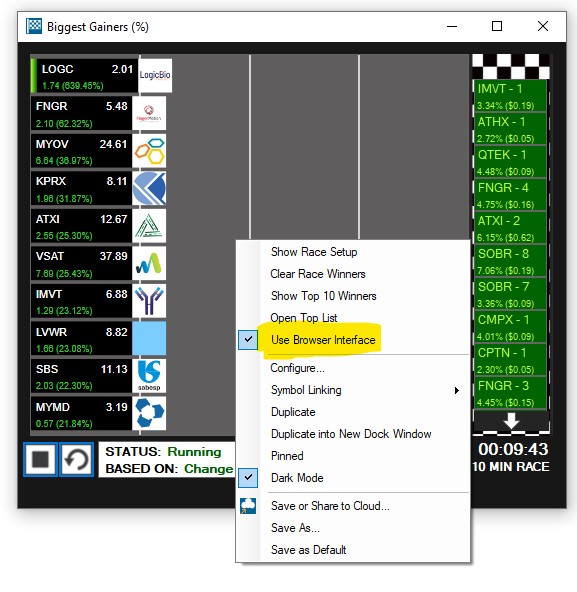
Dark Mode
To switch to Dark Mode, right-click into the race window and check the option Dark Mode.
Once enabled, the race window background and border will be dark grey instead of green/red.

Lane Size
When in HTML5-Mode (Use Browser Interface), the lane sizes adjusts dynamically.
When running the races in "normal" mode, you have three lane size options to choose from.
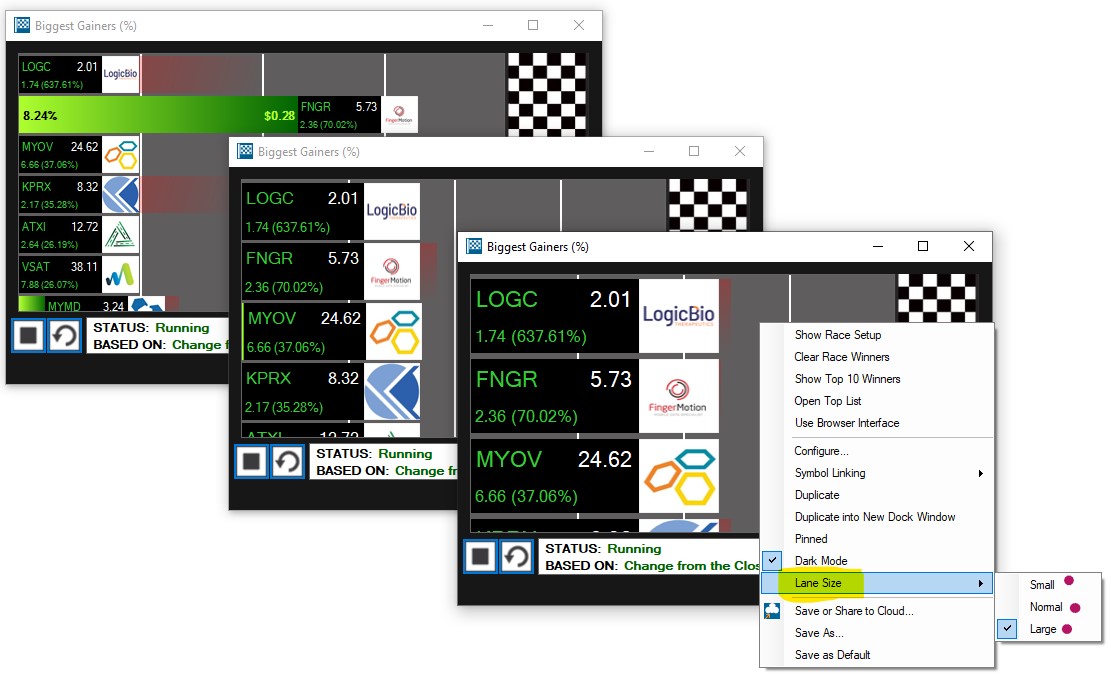
Race Replay
By default, races show the winners and losers in real-time. By switching to replay mode, you can recap entire trading days effortlessly in just a few minutes.
One minute of replay reflects one whole trading hour.
The exact settings of the Replay Mode will depend on your Trade Ideas version.
If you're running one of our latest versions, read on and/or watch the video to set up your Race Replay.
If you are running an older version of our software, head here to see the original Race Replay Mode setup.
To review yesterday’s action, or any other time period over the past 60 odd days, right-click into the race window and select, Show Race Setup.
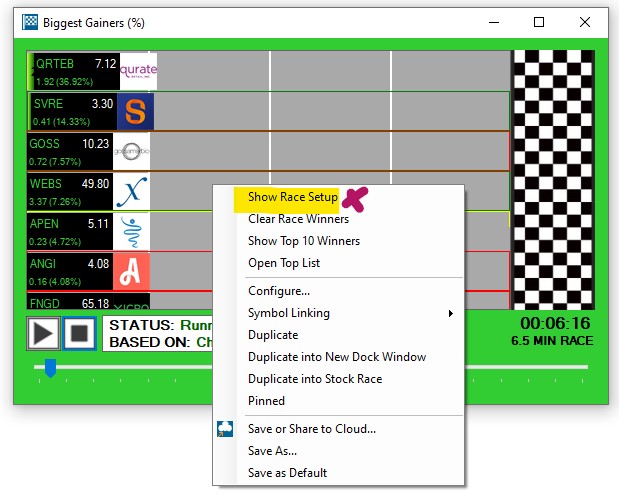
Choose a replay time period from the dropdown, or select the option Custom, if you have specific dates in mind.
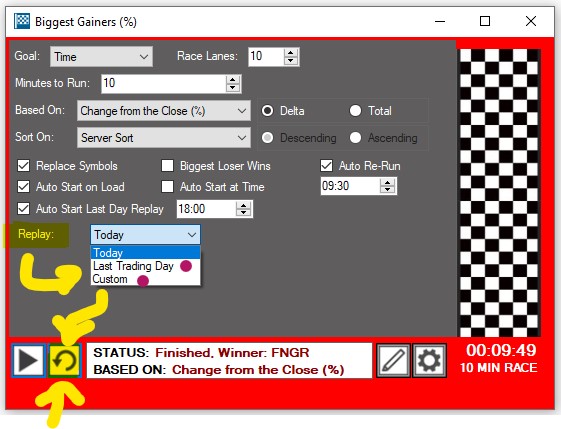
Here, enter you dates in the Replay from, and the Replay To fields:

Press the dedicated Replay Button to start the replay:

You can clearly see if a race is running in real-time or in Replay Mode.
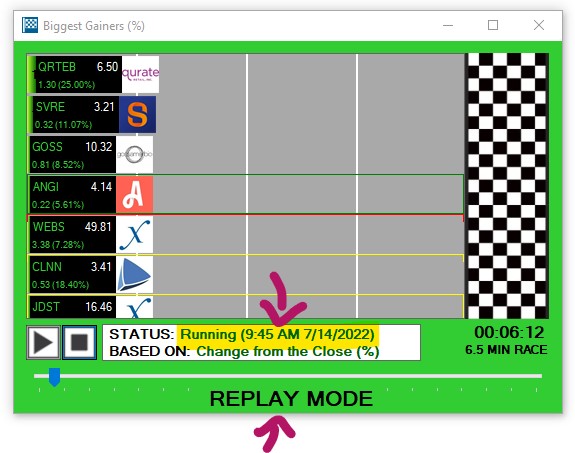
As the race progresses in 1-hour intervals from the starting date to its end, the Status Field will display the shown time, as well as the filter, the race is based on.
On the bottom right-hand side, you can see how much time is left until the end date will be reached, as well as the total replay run-time.
Original Race Replay Mode
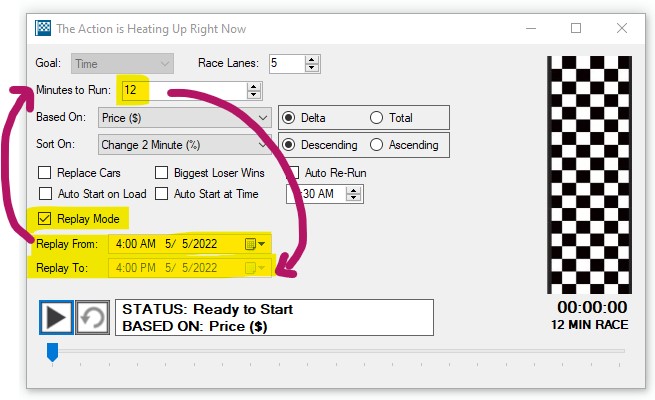
When this option is selected, the race window will display historical data between the Replay From and Replay To dates.
During the replay, you will see 5 minutes of historical data every 5 seconds.
First, select a Replay From Date and Time.
Then, enter the total run time in the Minutes to Run field. One minute of run time represents one hour of historical data.
The Replay To Time and Date will automatically adjust depending on the run time specified in the Minutes to Run field.
As an example, if today is the 6th of May and you wanted to replay yesterday's entire trading day, you would do the following:
- Enter 5th of June 4:00 am in the Replay From field
- Set the run time in the Minutes to Run field to 12
- See the Replay To field automatically update to 5th June 4:00 pm
Race Sharing
To make it as easy as possible for our Affiliates to promote Trade Ideas whilst showcasing their trades and setups, we have created a Race Sharing Feature.
To connect your Twitter account, go to the Toolbar, open the Tools Tab, select Options and then Social Networks.
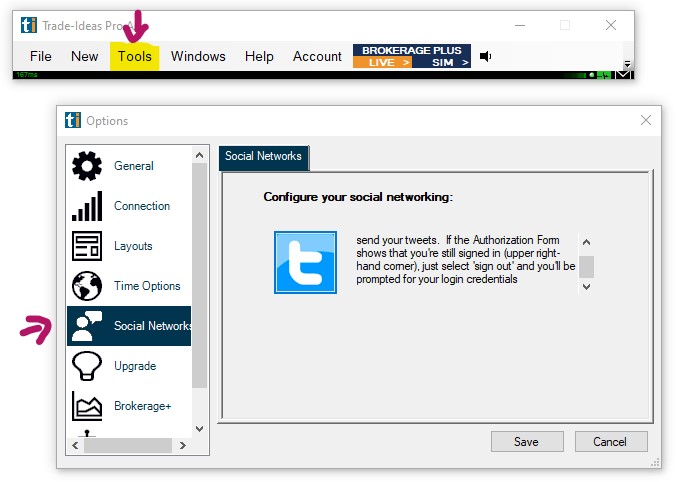
Here, click on the Twitter Icon and follow the prompts.
To share a Stock Race, simply click the Camera Icon on the bottom right-hand side of the race screen.
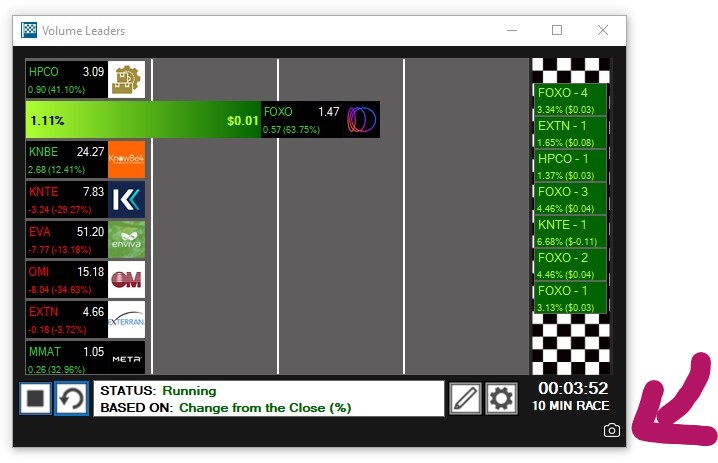
This will open the Screenshot Share Window.
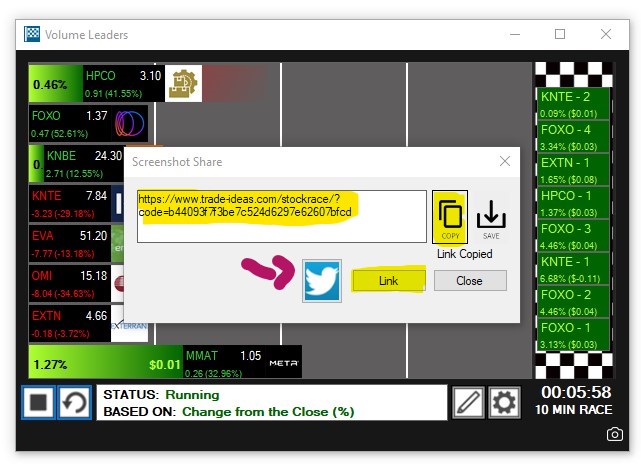
Click the Twitter Icon to share the chart on Twitter.
Click the Copy Button to copy the link and post it on social media.
Click the Save Button to download a .png image of your chart to a folder on your PC.
Click the Link Button to load your chart in your browser window.
Race Display
For each stock, the current Change in %, the current Change in $, as well as the Change from Close in %, and the Change from Close in $ are displayed in the race lane together with the ticker and the current price of the stock.
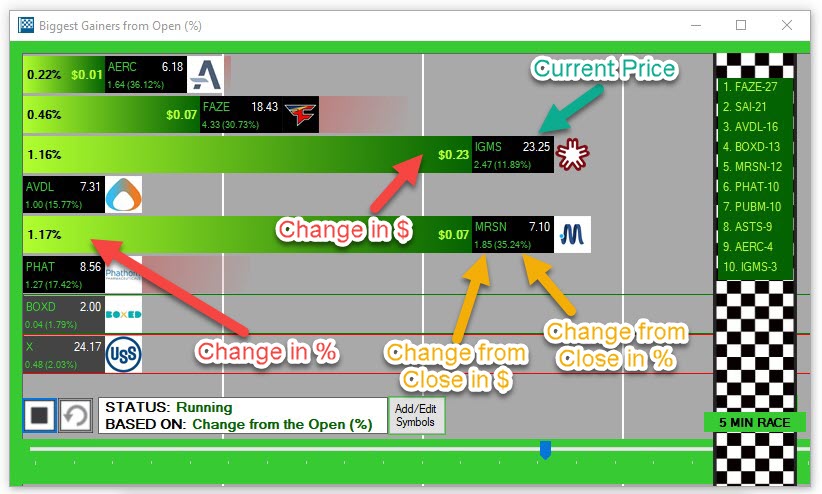
During the race, you will see stocks moving forward as well as pulling back based on the change in filter value.
A green line below a stock lane means it has moved up in position.
A red line below a stock lane means it has moved down in position.
A yellow line below a stock lane means the stock has been newly added to the race (when the option Replace Cars is enabled).
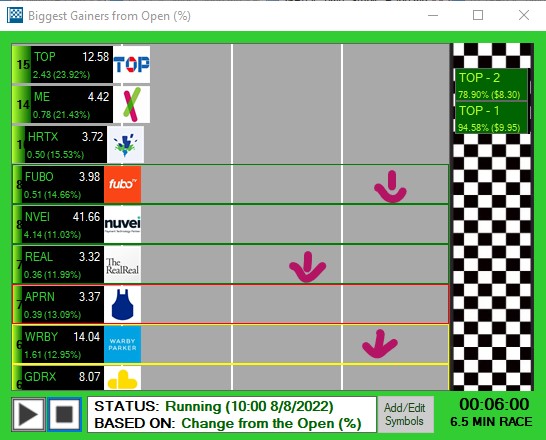
The Winners of each race will be listed on the finish line from top to bottom.
If the race window is to narrow to show all winners, navigation arrows on top and bottom will enable you to scroll through the winner line-up.
A click on a winner tag, will reveal the second and third place as well.

To only see the Top 10 Winners, right-click into the window and select Show Top 10 Winners

To see all Winners, right-click again and select Show All Winners

AI/Holly Strategy Window
The Premium AI Strategy Window will list the strategies that Holly, after a long night of backtesting and optimization, has carefully selected for the upcoming trading day.

For detailed information, head to this section of our dedicated Holly Guide!
AI/Holly Strategy Trades Window
To see Holly’s trading in action, open to the Premium AI Strategy Trades Window. All the trades that Holly enters during the day will appear here.
Whenever Holly enters a new trade, the entire entry row will flash.
You will find it in the Toolbar under New, as well as in the Trade Ideas AI Channel.
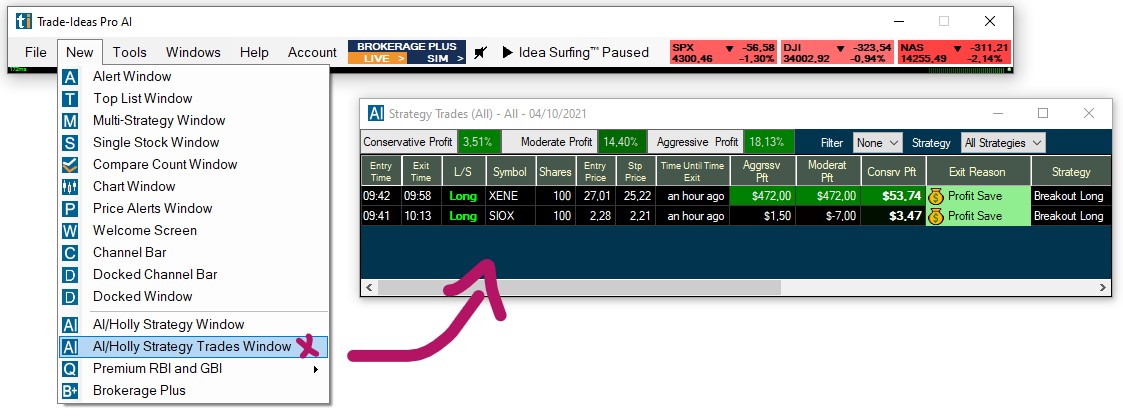
For detailed information, head to this section of our dedicated Holly Guide!
Premium AI Longterm Strategy Trades Window
Holly exits all her trades at the end of each trading day. However, the trade catalysts don’t simply expire when the stock market closes. Some of these triggers offer the potential to catapult a stock over the course of several days or weeks in the direction of the day’s trading signal.
The AI Longterm Strategy Trades Window enables you to see these trades.
Traders can now benefit from Holly’s carefully selected trades beyond the initial trading day, and easily track them.
To load this window, go to the Toolbar, open the File Tab and select Premium AI Longterm Strategy Trades Window:
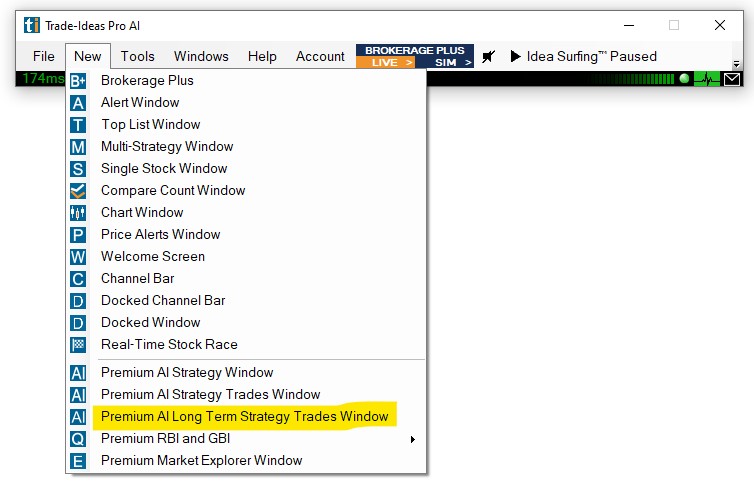
All stocks listed in the Long Term Strategy Trades Window fit one of the following criteria:
-
When the original trade was a Long Trade, they are either making new highs or are moving from red to green.
-
When the original trade was Short Trade, they are either making new lows or are moving from green to red .
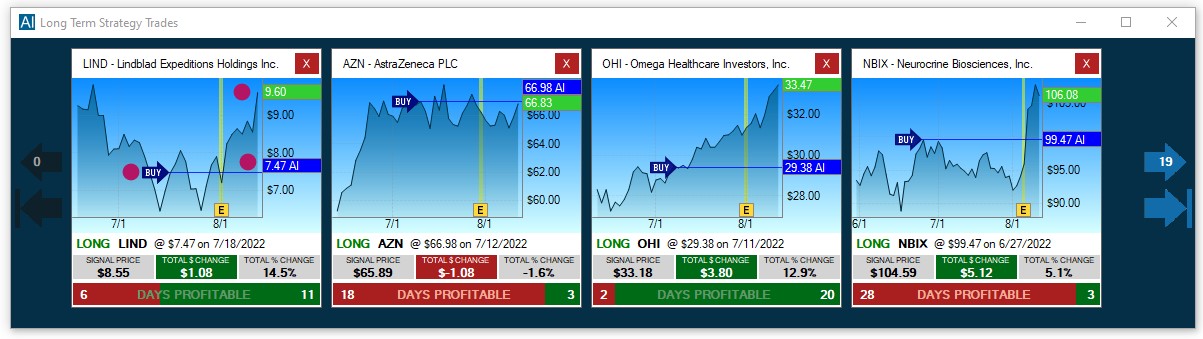
Each thumbnail chart relays the following info:
-
The Direction of the Trade (Buy/Sell)
-
The Original Entry Price
-
The Current Price of the Stock
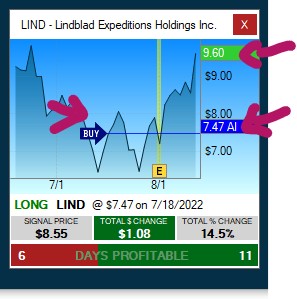
Below each thumbnail chart you will find the following info:
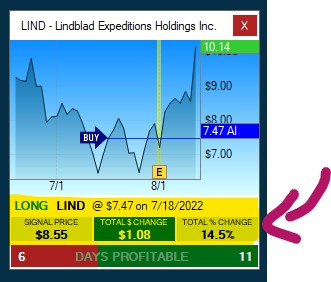
-
The Direction of the Original Holly AI Trade (Long or Short)
-
The Original Entry Price
-
The Date of the Original Trade
-
The Signal Price, which is the price that triggered the stock being added to the Longterm Holly AI Strategy Trades List
-
The Total Change in $, which is the difference in dollar between the Original Entry Price and the Signal Price
-
The Total Change in %, which is the difference in percent between the Original Entry Price and the Signal Price
-
The Total Number of Profitable Days counted from the Original Entry Date
By default, the thumbnail charts are sorted by Signal Time, from left to right.
Clicking the top arrows on the left and right-hand side enables you to move through the list.
The total number of stocks on the list as well as the current position are displayed on these arrows.
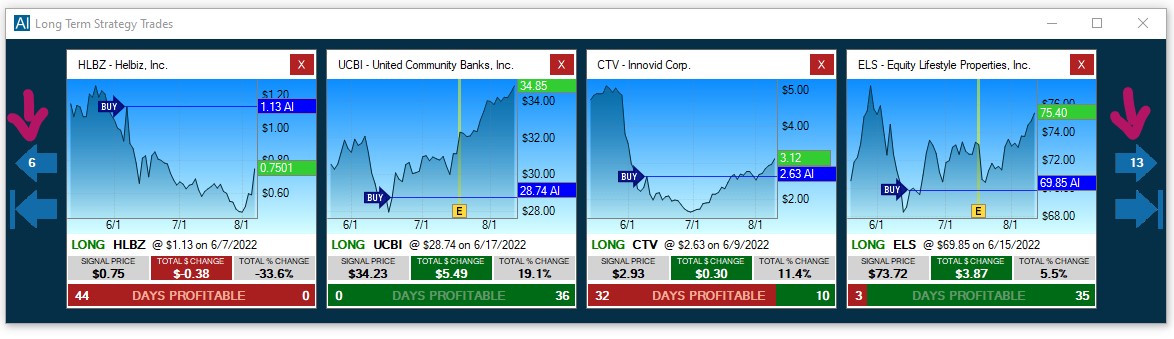
A click on the bottom arrow on the right-hand side will bring you to the last stocks on the list, a click on the bottom arrow on the left-hand side will bring you back to the first entries.
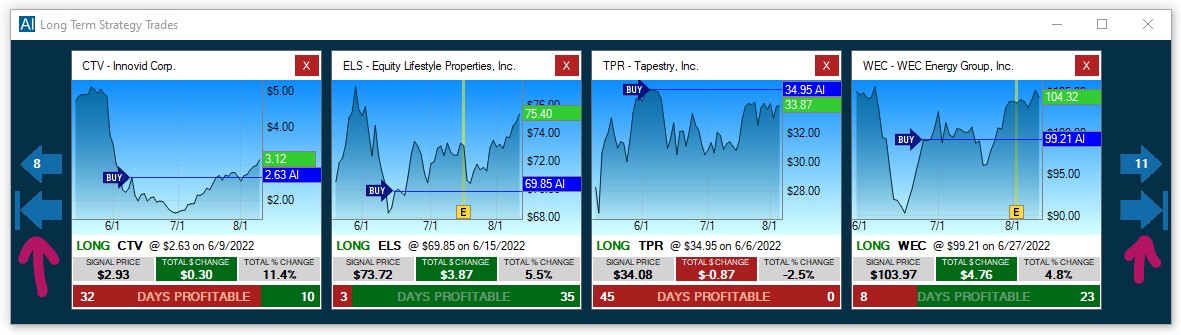
A click on the thumbnail header will load the stock in any symbol-linked chart
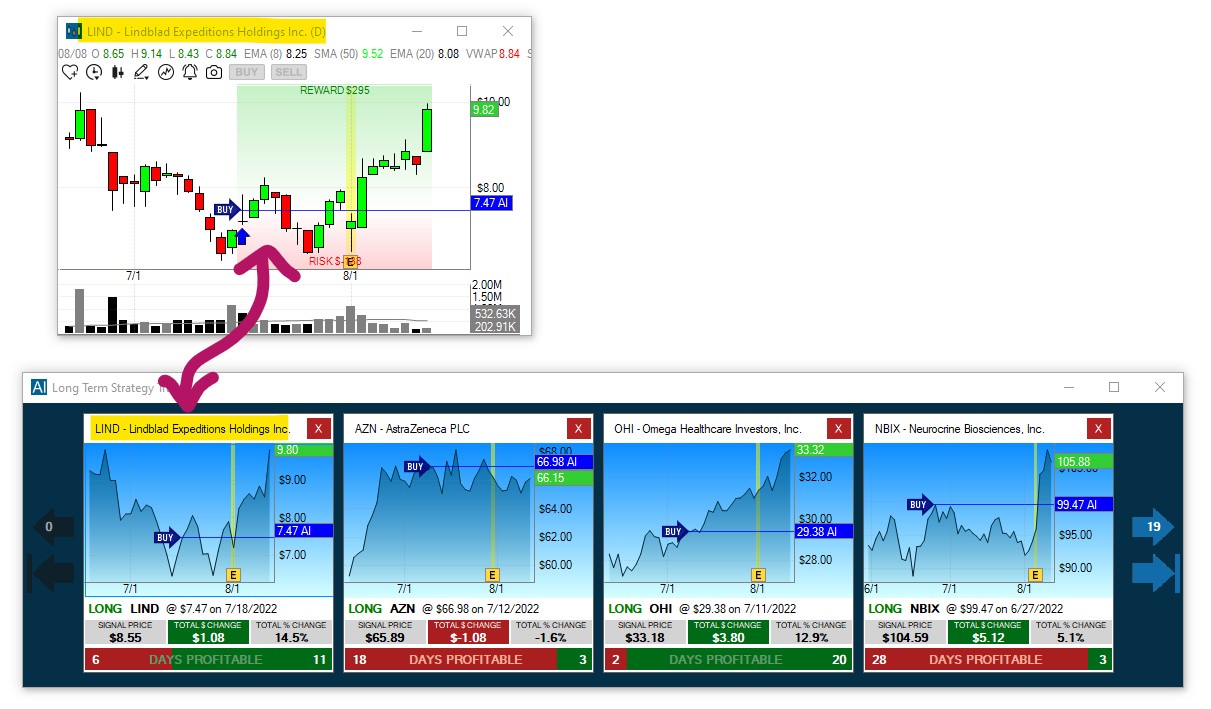
To see Holly AI Trade details in your chart, right-click into the chart, select Properties and then Show AI Trades
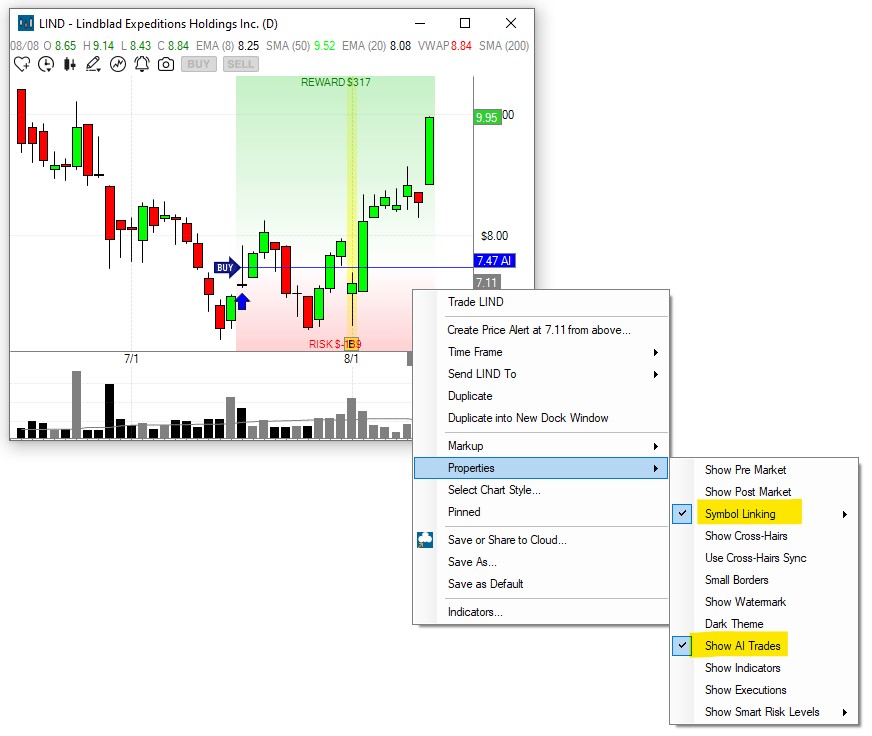
To see all longterm Holly AI trades in grid view, right-click into the Long Term Strategy Trades Window and select Show Data Grid.
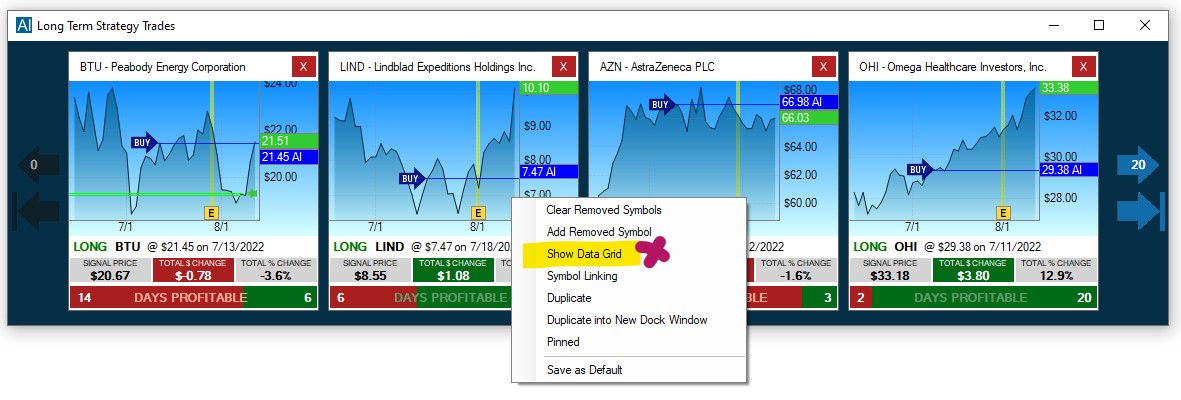
This will open the Long Term Strategy Trades Data Grid
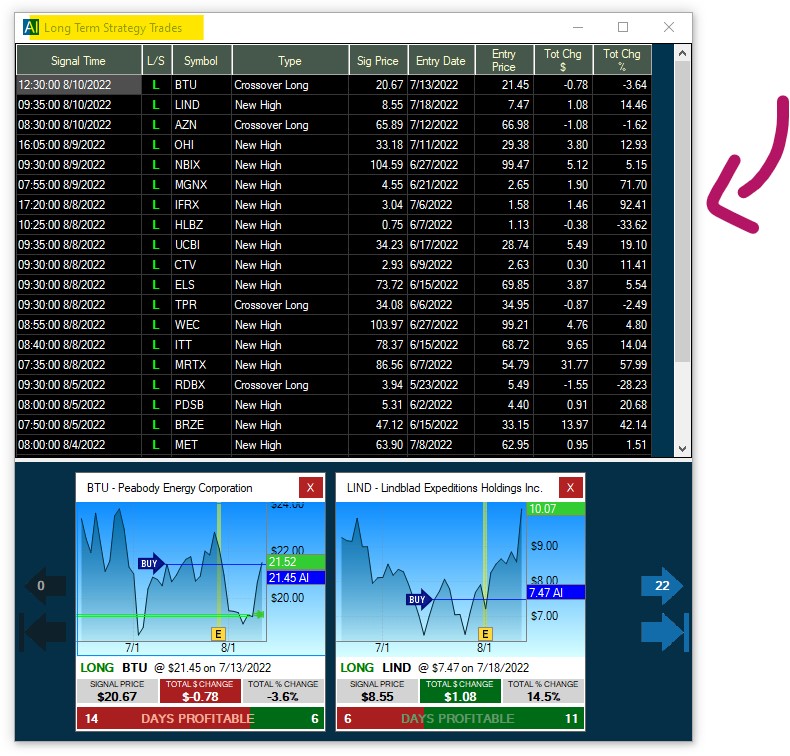
By default, the thumbnail charts are sorted by Signal Time Descending from left to right.
A double-click on a data grid colum header will change the sort order of the thumbnails accordingly.
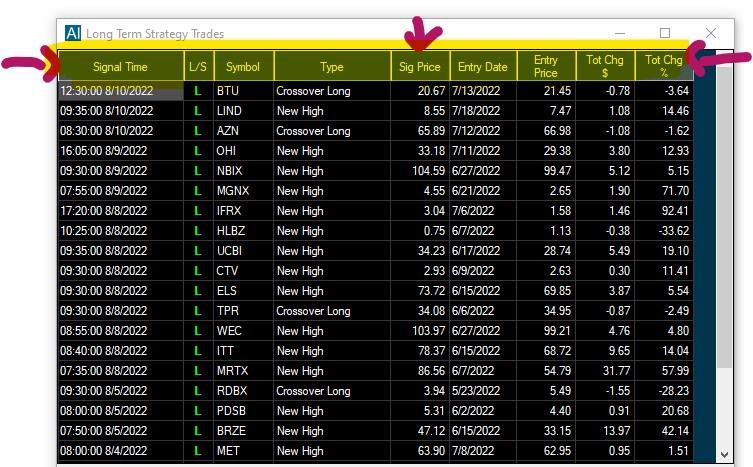
To remove stocks from the list, simply click on the X in the top right-hand corner of the thumbnail chart.
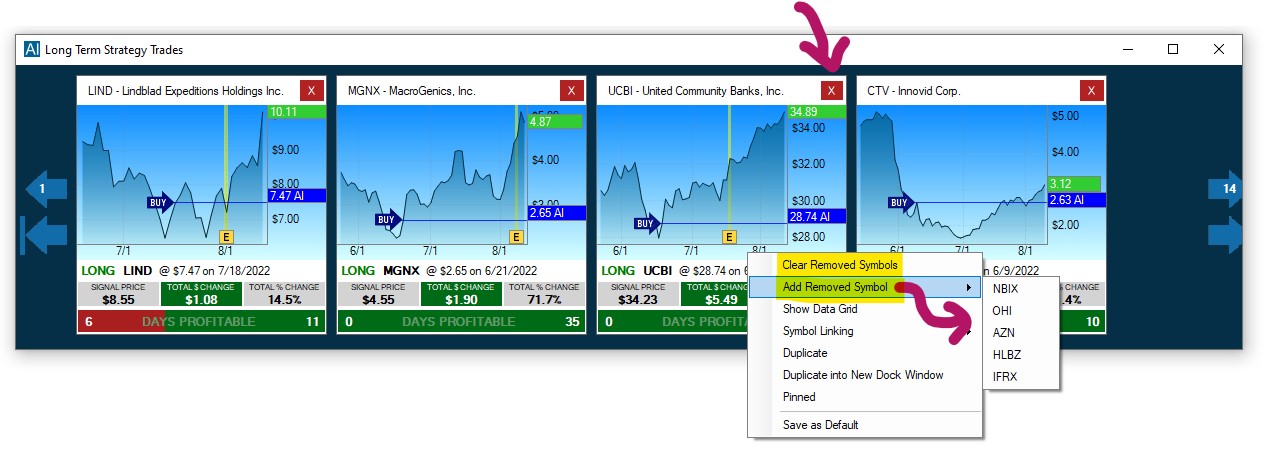
To reverse the symbol removal, right-click into the window and select, Clear Removed Symbols.
To add indivudal removed symbols back to the list, select Add Removed Symbols, then select the specific symbol(s) from the dropdown.
Premium RBI and GBI
Our Premium RBI and GBI Alerts are based on pattern recognition and indicate trend continuation. RBI stands for Red Bar Ignored and GBI stands for Green Bar Ignored.
An RBI Alert works the following way. First, we need to have a minimum of four green bars in a row, before a red bar is formed. The alert triggers once the subsequent bar moves above the RBI’s high. It suggests considering going long.
A GBI Alert works the following way. First, we need to have a minimum of four red bars in a row, before a green bar is formed. The alert triggers once the subsequent bar moves below the GBI’s low. It suggests considering going short.
These Alerts are available on the 5-, 15- and 30-Minute Timeframes.
The Confirmed version of the RBI and GBI Alerts waits for confirmation of the follow-up.
A Confirmed RBI Alert does not already trigger, when the green bar moves above the high of the red bar but waits until the green bar closes above the high of the red bar.
A Confirmed GBI Alert does not already trigger, when the red bar moves below the low of the green bar but waits until the red bar closes below the low of the green bar.
To open a new RBI or GBI Window, go to the Toolbar, open the New Tab and select Premium RBI and GBI. Then, make a choice from the dropdown menu. You can choose the direction long, RBI, or short, GBI, as well as the time frame and the level of aggression (unconfirmed versus confirmed version).
Trade XYZ
You can trade stocks right from your scans and charts via our One-Click Order Feature. Simply right-click into the scan or chart and select Trade to bring up a dropdown menu with preconfigured order templates.
How to create a custom Order Entry Template:
Customize
The Premium RBI and GBI Alerts allow for certain customizations.
To access the RBI and GBI Customization Window, right-click into the window and select Customize.
Here, you can enter the minimum and maximum Stock Price, the minimum Volume of Shares for Today, the minimum Average Daily Volume over the last five Days in Shares as well as the minimum Volume in Percent that you would like stocks to have in order for them to be scanned for the RBI or GBI pattern.
The field below the customization options enables you to give your window a Name.
Send XYZ to…
The Send To Feature enables you to look up more info for a stock or share it with others. This feature is available in most Trade Ideas Windows, namely Charts, Top Lists, Alert, and Multi-Strategy Windows as well as Price Alerts and AI Strategy Trades Windows. Simply highlight a symbol, then right-click and select, Send XYZ to... where XYZ stands for the chosen stock symbol.
You can choose to send the chosen symbol to a new Chart Window, or a new Single Stock Window.
In addition to that our Send To Feature lets you share the stock with your followers on Twitter. Enter your message, and if you would like to share the Alert as well as the Strategy, check the box, Include Strategy Config in Message. Thereafter click, Tweet Now. If you haven’t connected to Twitter yet, the Twitter Authorization Window will open. Enter your Twitter username and password, then click Authorize app. After logging in, copy the received PIN into the box on the bottom left-hand side. Then click, Confirm.
You can also send a symbol to an already externally linked target platform. If you have not established External Linking yet, the External Linking Window will open and enable you to Add a Link. With external linking enabled, any symbol you click on within Trade Ideas will automatically load in an external platform like your charting or brokerage app. This is a good way to connect to a lot of different applications. A further tutorial will discuss External Linking in more detail.
Another option is to send the stock symbol to the Web. By selecting send to Web, you can find info about the particular stock on Yahoo, Finviz, StockCharts, BigCharts, as well as other web-based platforms, and conduct further research. If you check the option, Use Symbol Linking, and leave the particular web-based platform open, it will automatically load every symbol you select in your scan on the web-based platform as well. This way, you will get an instant internet look-up for every symbol that you’re interested in. In addition to the sites in the selection menu, you can select Custom to add a different web-based platform. If this platform requires a login, log into the web-based platform first. Then, have a look at the URL when you are logged in to your web destination. Copy this URL, and split it where the symbol is mentioned. Enter the part of the URL before the symbol, into the first section, and the part after the symbol in the next section.
Lastly, you can send the stock symbol to one of your existing Symbol Lists. Or even create a New List to add the symbol to. A further tutorial will discuss how to create, edit and use Symbol Lists in more detail.
Symbol Linking
Most Trade Idea Windows, including Alert, Top List, Multi-Strategy, and Compare Count Windows as well as the Holly AI Windows, RBI, GBI, and Price Alerts can be symbol-linked to a Chart or Single Stock Window.
This means that when changing your windows stock symbol, your symbol-linked Chart or Single Stock Window will automatically change as well, and display the specific stock’s data.
By default, all symbol-linked free-floating Windows belong to the blue, Link to All, Color Group.
By default, all docked Windows are assigned to the pink, Dock Window, Linking Group. In "Pink Mode" only the menu items contained in the indiviual dock respond to symbol changes.
The assigned color group will always be displayed in the top left-hand corner of each window.
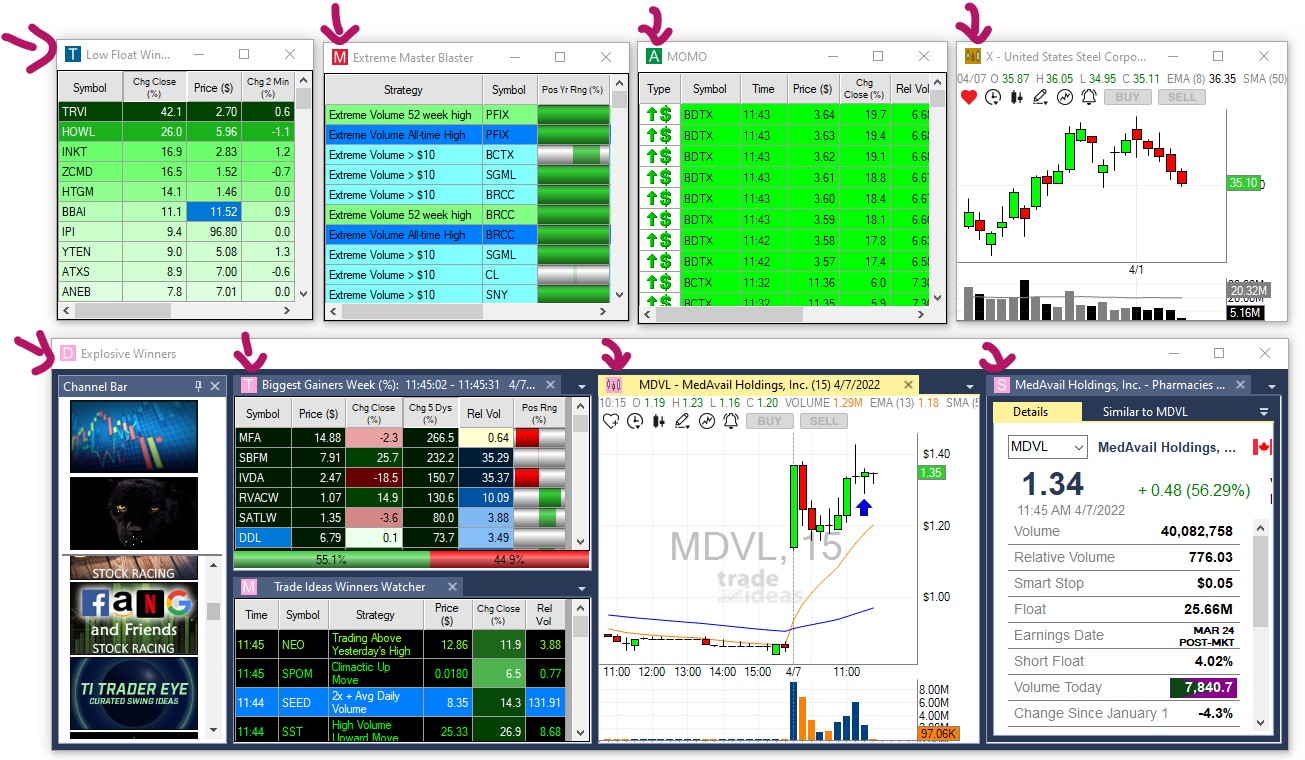
You can create up to 4 additional Linking Groups and by doing so, link selected windows to a specific Chart or Single Stock Window, which is very useful when monitoring various scans.
There are two ways to create a Linking Group:
- Option 1
You can assign windows to a specific color group individually.
To do so, right-click into your window, select Symbol Linking, and choose a color from the dropdown. The selected window will now display the Color Group in the top left-hand corner.

To enable Symbol Linking for a Single Stock Window, right-click into it, and select Symbol Linking.
Then, add a Checkmark to the left-hand side of the Symbol Linking option.

To enable Symbol Linking for a Chart, right-click into it, select Properties, and then Symbol Linking. Now, add a Checkmark to the left-hand side of the Symbol Linking option.

- Option 2
To establish a Linking Group for a number of windows at once, go to the Toolbar, open the Tools Tab, and select, Symbol Linking Groups.

The next window will display all the Trade Ideas windows currently in use.

By default, each free-floating window is assigned to the blue, Link to All, Linking Group.
By default, each docked window is assigned to the pink, Dock Window, Linking Group. In "Pink Mode" only the menu items contained in the indiviual dock respond to symbol changes.
To establish a new Linking Group, select the windows that will be part of the new Linking Group by adding a checkmark.
You can select all windows at once by choosing, Select All, at the bottom.

You can clear your selection by selecting, Clear Selected, at the bottom.
Once you have selected the windows, open the Link Groups dropdown in the top left-hand corner. Select a color for your new Linking Group, then choose, Set All Selected, to assign the windows.

All the selected windows will now display the color of the Linking Group you have assigned them to.
To see all windows that are assigned to a specific Linking Group, choose the Group Color from the Link Groups dropdown, then select, Filter By. To see all available windows, select, Clear Filter.

Once you have assigned the windows, select Close.
All the windows that you assigned to a Linking Group will now display the Group Color in the top left-hand corner.
Any Single Stock Window or Chart that has been assigned to the same Color Group will update accordingly, whenever you change a stock symbol in one of the other Linking Group windows.
Please note, that even when a Single Stock Window and Chart have been assigned to a specific color group, they will always also be linked to the Blue Color Group since this is the default Link to All Group. This means in turn that any window that is assigned to the blue linking group will be linked to all open SingleStock Windows and Charts.
Clear
Right-click into the window and select Clear, to remove all currently listed RBI or GBI alerts. New Alerts will start showing as they trigger.
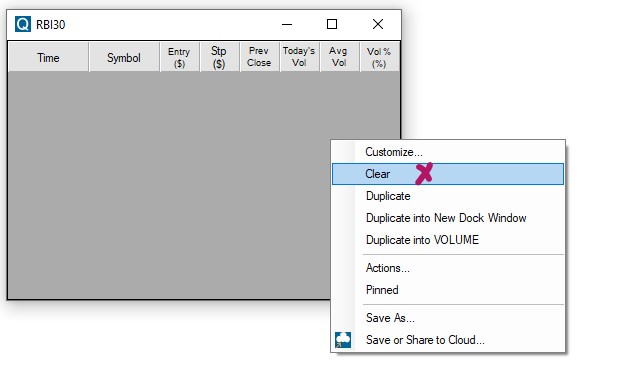
Duplicate
To create an exact copy of the current window, right-click into the window and select Duplicate.
Duplicate into New Dock Window
To open a copy of a free-floating window in a new Dock, right-click into the free-floating window and select Duplicate into New Dock Window. An exact copy of your free-floating window will now be opened in a new Dock.
Duplicate into XYZ Dock
To load a copy of a free-floating window into an already open Dock, right-click into the free-floating window and select Duplicate into XYZ Dock, where XYZ stands for the Name of that particular Dock. An exact copy of your free-floating window will now be added to the chosen Dock.
Actions
The Actions feature allows you to set up visual and sound notifications whenever an alert triggers. Right-Click into the window and select Actions.
Sound Notifications
To enable Sound Notifications, check Play Sound in the new popup window. Then click Set Up Sound.
The next window will display built-in sound options. You can choose an asterisk, a beep, exclamation, a stop, or text to speech.
If you choose the Text-To-Speech Option, a female voice will call out each stock symbol that triggers.
Further below, you can choose a custom sound from your local computer. Please note that custom files need to be in WAV format, the system isn't able to use MP3.
Once you have selected a Sound Option, click Play to test the audio. Use the Balance and Volume sliders to adjust the sound to your liking. Hit Okay when you are done.
Visual Notifications
To receive a visual notification when a new alert triggers, enable the Show Alert Window Feature.
Right-click into your window and select Actions. Here, check the option, Show Alert Window at the bottom of the Actions Window.
Once this option is enabled, the window will pop to the surface if it is hidden behind other windows. It will flash when it is already on the surface.
Use this feature with caution and in moderation, since it could put a strain on resources when used in excess. It is best applied to windows that only trigger once in a while.
Pinned
To keep a single Trade Ideas window on your screen permanently, even when switching layouts, or toggling through channels, right-click into the specific window, and select Pinned from the dropdown. The Pinned Feature, is available for all Trade Idea Windows, including Scans, Charts, Compare Count, and the Holly AI Windows.
Once a window is pinned, it does not follow the behavior of the other windows.
This is useful if you would like to include one or more windows of a channel in a custom layout, without saving the individual windows to the Cloud first.
It is important to note, that this window will stay open until you decide to unpin it. When accidentally saved within a layout, It might load multiple times, when closing and re-opening this layout. At worst, you will have multiple versions of the window all running on top of each other in the same position. This can put a strain on system resources and drastically impact software performance. The pinning option should therefore be used very carefully and consciously. A window should always be unpinned after the desired action is completed.
To do this, right-click into the window and remove the checkmark on Pinned.
To see all pinned and unpinned windows, or to close them, go to the Toolbar, select Windows, and choose, Close All Unpinned, or Close All Pinned.
Save As
Apart from saving your windows to the cloud, you can also save them to your local PC in order to create a backup. This is especially useful if you have spent a lot of time and effort customizing your scans and layouts. Just right-click into your window and select Save As from the dropdown. This will bring up the standard Save file dialog. Enter a name for the file and choose a folder to save it to. By default, it will be saved in your local TradeIdeasPro folder. Lastly, press the Save button.
To load these .WTI files, open the File Tab of the Toolbar, and select Load Window.
Save or Share to Cloud
Once you have changed the settings of an RBI or GBI window, make sure to save it to the cloud for future use.
1. Right-click into the window and select Save or Share to Cloud
2. Enter a new name into the Name field or keep the automatically added one.
3. Enter a description for your new window or leave the Description field blank.
4. If you would like to automatically close any other open layout or channel in the future, whenever you load this new window, select Clear Previous Layout.
If you would like to load this window on top of any already opened layout, leave this checkbox blank.
5. Select Save when you are done or select Save and Share to share the window with others before saving it to the cloud.
6. There are various sharing options:
-
Scan the QR code
-
Select Copy All, to save the Cloud link to your clipboard and paste it into an email or messaging app.
-
Click the Twitter icon and include a text message if you like. If you haven't connected Trade Ideas to Twitter yet, a Twitter Authorization Form will open. Log in with your Twitter username and password. Then click, Authorize App. Thereafter, copy the displayed Pin Code into the field at the bottom left-hand side of the window and select Confirm.
7. Select OK when you are done.
Your new RBI or GBI Window is now stored in your cloud, from where it can easily be retrieved. Just go to the Toolbar, open the File Tab and choose Load from Cloud. To find a saved window, you can enter its name in the search field, or scroll through the list. Just highlight your window, then choose Load.
Brokerage Plus
Brokerage Plus is the Trade Ideas Portfolio Manager. It is the control center for all your orders and positions.
In combination with an account at a participating brokerage (e.g. Interactive Brokers, ETrade, Alpaca or TradeStation), you can place orders, as well as view and manage all your current positions in one convenient place.
Our Brokerage Plus Module enables you to execute trades directly within Trade Ideas via One-Click Order Entry from charts and scanners. In addition to that, you can automate your own strategies.
Brokerage Plus includes a real-time simulator, in which seasoned pros can test new trading strategies and new traders can learn trading in real market conditions before going live.
The Brokerage Plus Module enables you to trade in:
-
our real-time simulator
-
an Interactive Brokers Live or Paper Trading account
-
an Alpaca Live or Paper account
-
a TradeStation Live or Paper Trading account
-
an ETrade Live account
The Brokerage Plus Module enables you to set up:
-
One-click Orders for scans
-
One-click Orders for charts
-
complex trading strategies based on scans
-
complex trading strategies based on custom formulas
-
automation for your personal trading strategies
To open the Brokerage Plus Module, go to the Toolbar, open the New Tab, and select Brokerage Plus.
Alternatively, click on the Brokerage Plus Live or Brokerage Plus Sim button located in the Toolbar.
If you select Brokerage Plus Sim, a connection to our in-house Trade Ideas Simulator will automatically be established.
To connect to an account at a participating brokerage further steps have to be taken.
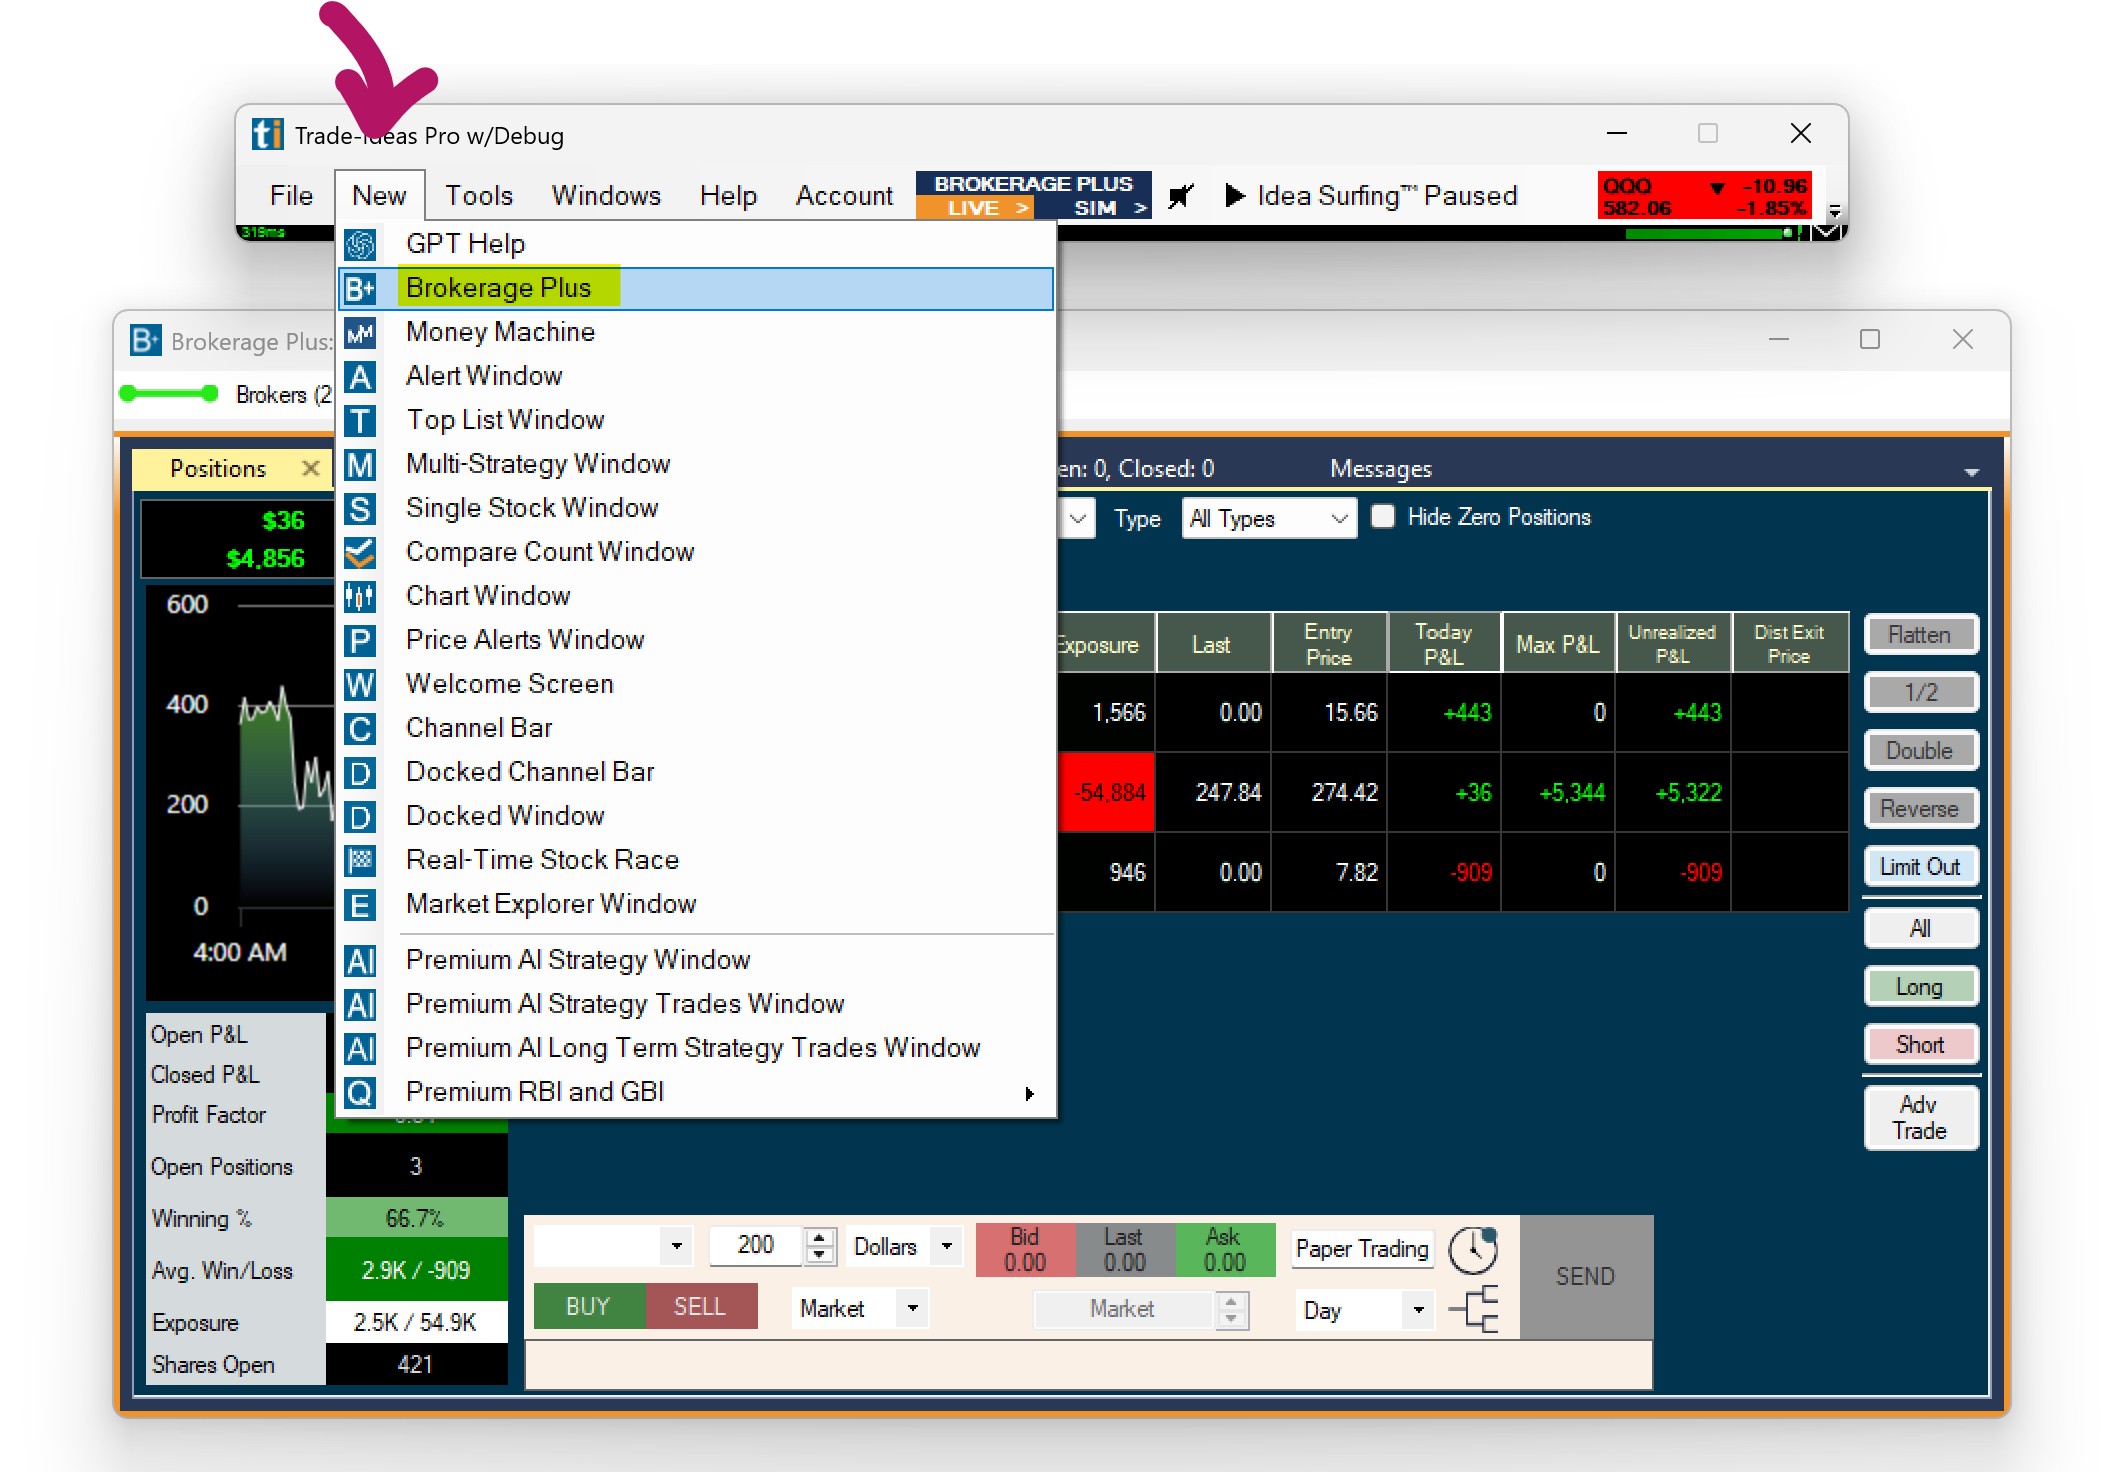

Brokers Tab
The Brokers Tab enables you to connect our Brokerage Plus Module to our in-house simulator or to an account at participating brokerages, for example IB, ETrade, Alpaca or TradeStation.
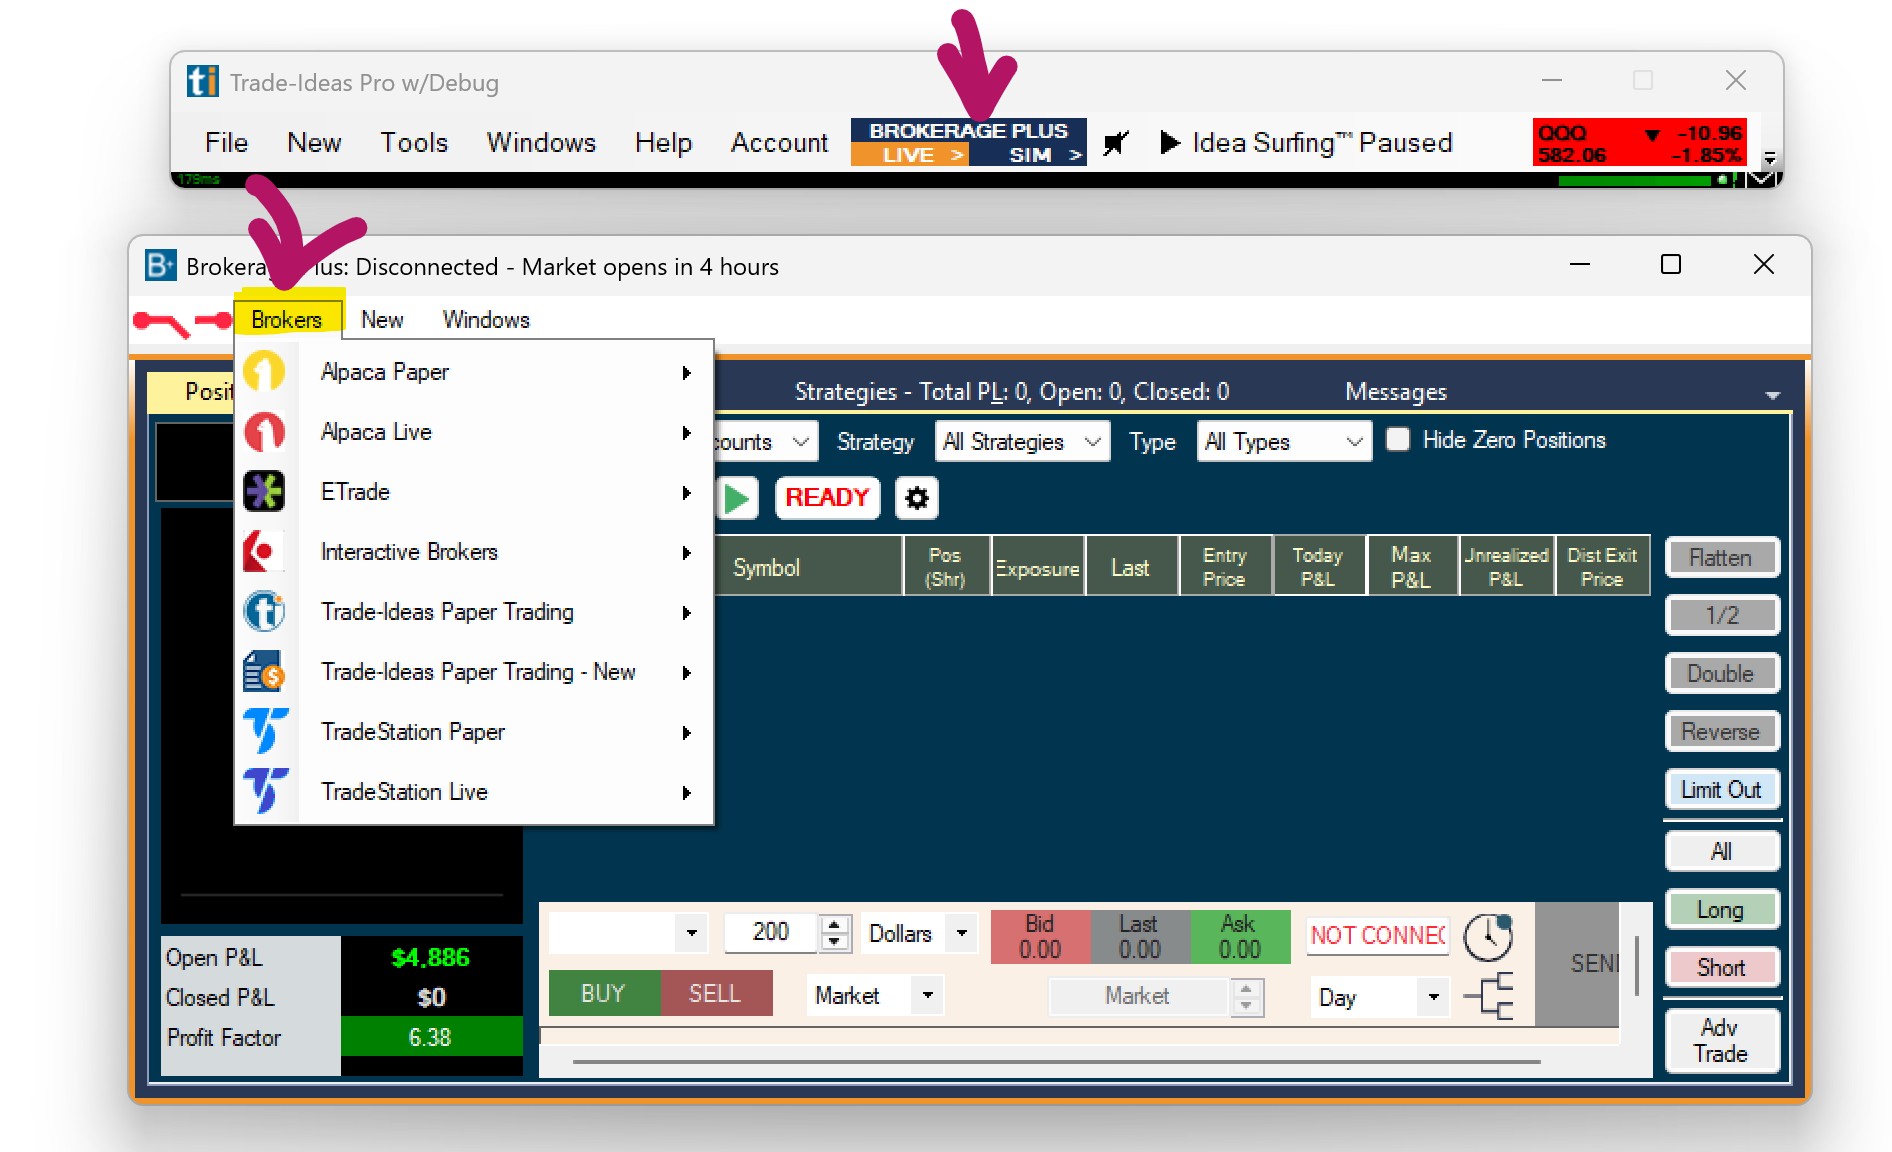
Connect to the Trade Ideas Simulator
If you click the Brokerage Plus Sim button located in the Toolbar, a connection to our in-house Trade Ideas Simulator will automatically be established.
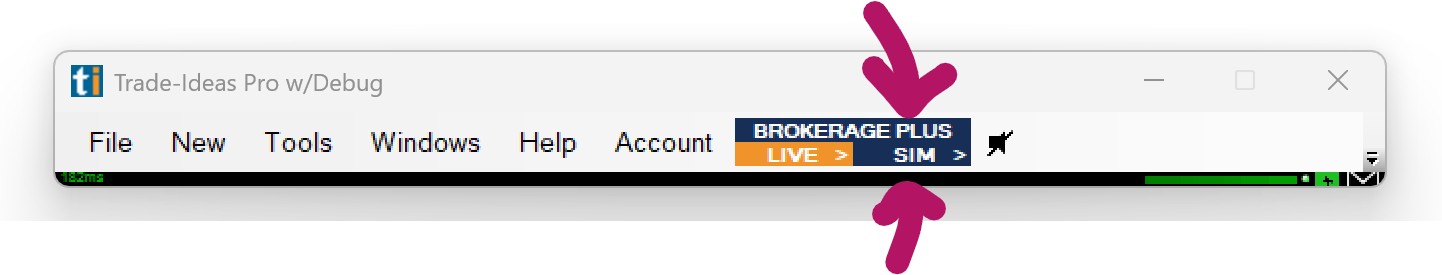
Alternatively, open the Brokers Tab of the Brokerage Plus Module and select Trade Ideas Simulated Trading - Connect from the dropdown.
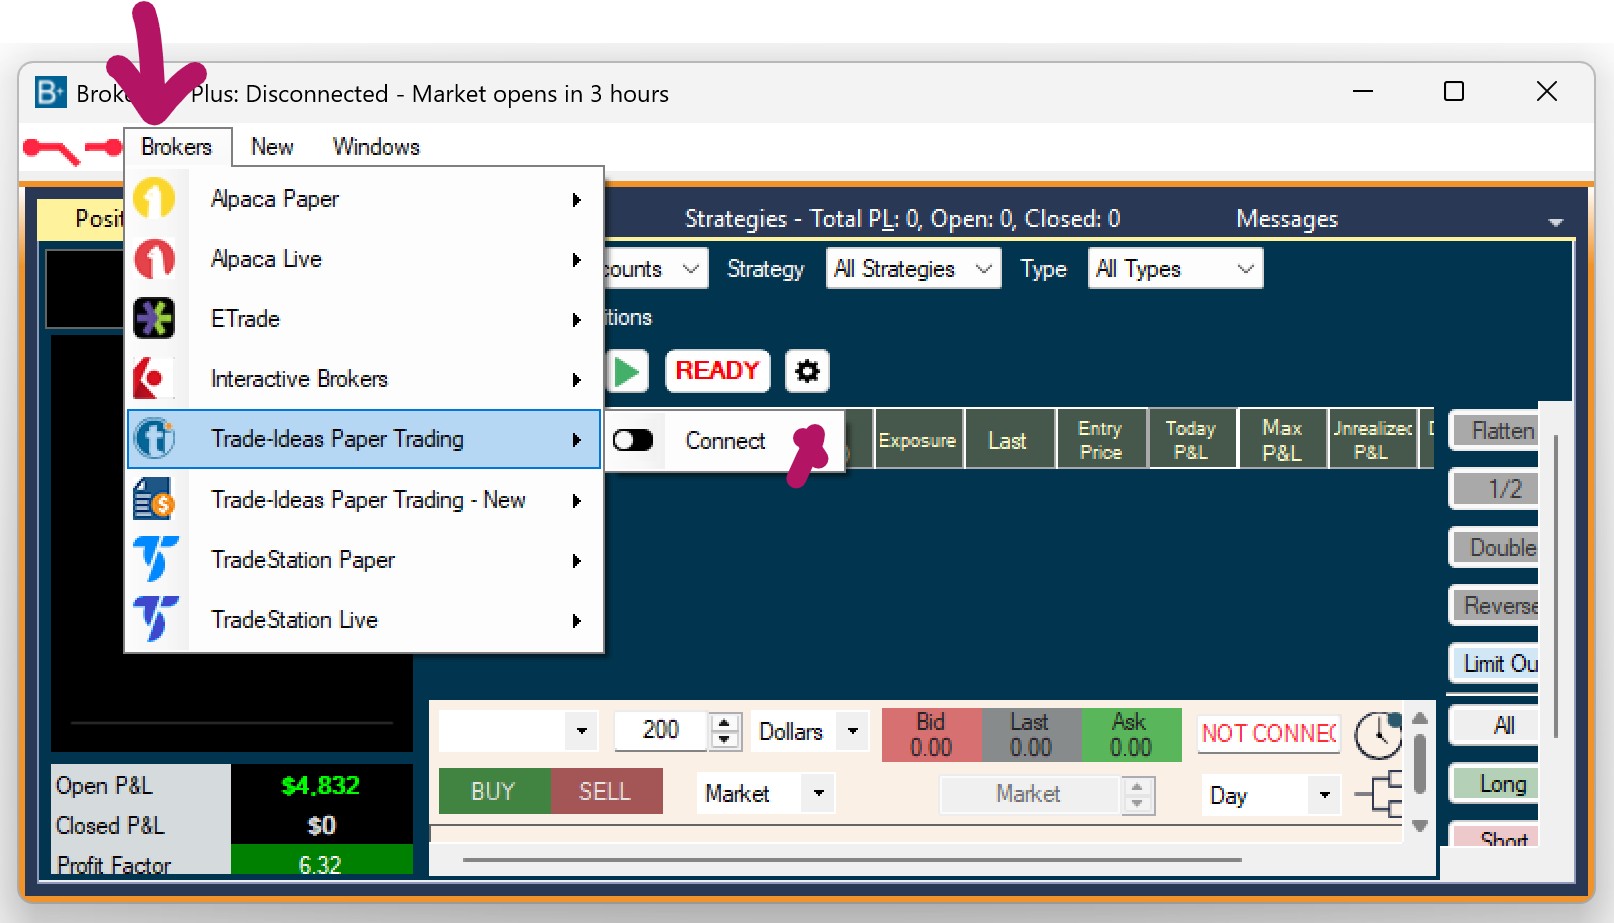
The connection bar will turn green and the Brokers Tab will display the number of established connections in brackets.
You can be connected to multiple accounts at the same time.
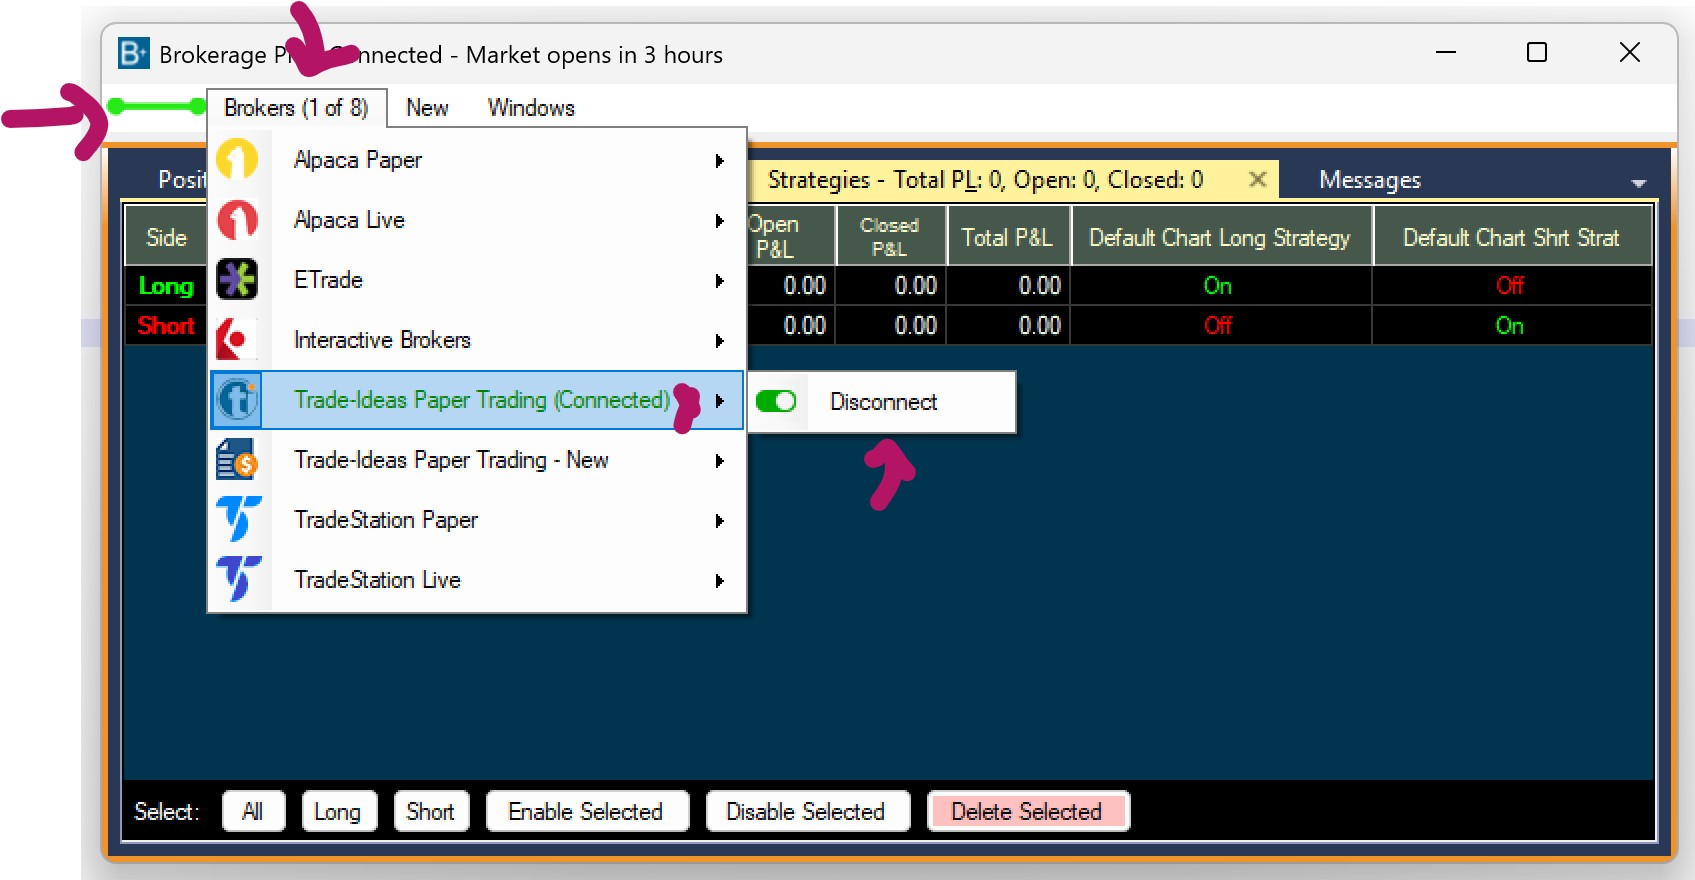
To disconnect, click the Brokers Tab, and select Trade Ideas Simulated Trading - Disconnect
Connect to Interactive Brokers
Since Interactive Brokers blocks the API connection of IB Lite Accounts, you will need to have an IB Pro Account to connect to Trade Ideas.
Before the Brokerage Plus connection can be established, you need to configure Interactive Broker’s Trader Workstation.
Open and log into Interactive Brokers Trader Workstation, choosing either Live Trading or Paper Trading.
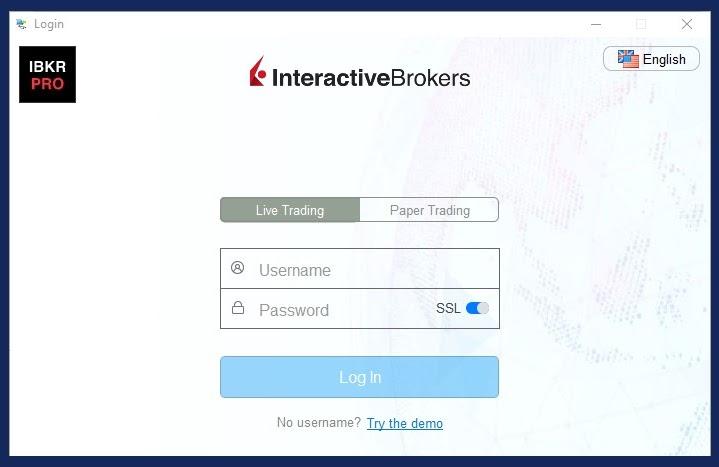
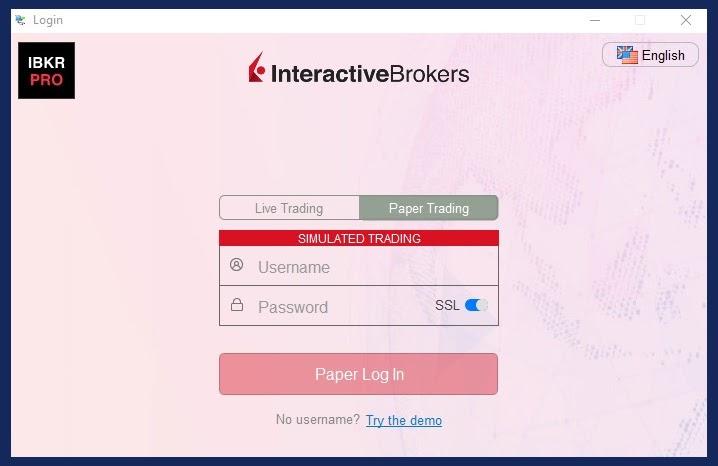
From the Trader Workstation Menu, select File, then Global Configuration.
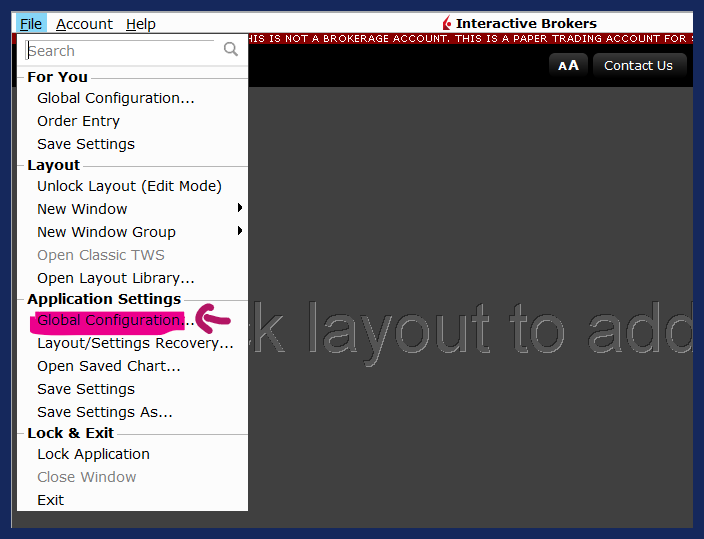
Head to the API section Settings:
Make these three adjustments:
Check: Enable ActiveX and Socket Clients
Uncheck: Read-Only API
Select Socket Port Number 7496 to connect your Interactive Brokers Live Account,
Select Socket Port Number 7497 to connect your Interactive Brokers Simulated Account.
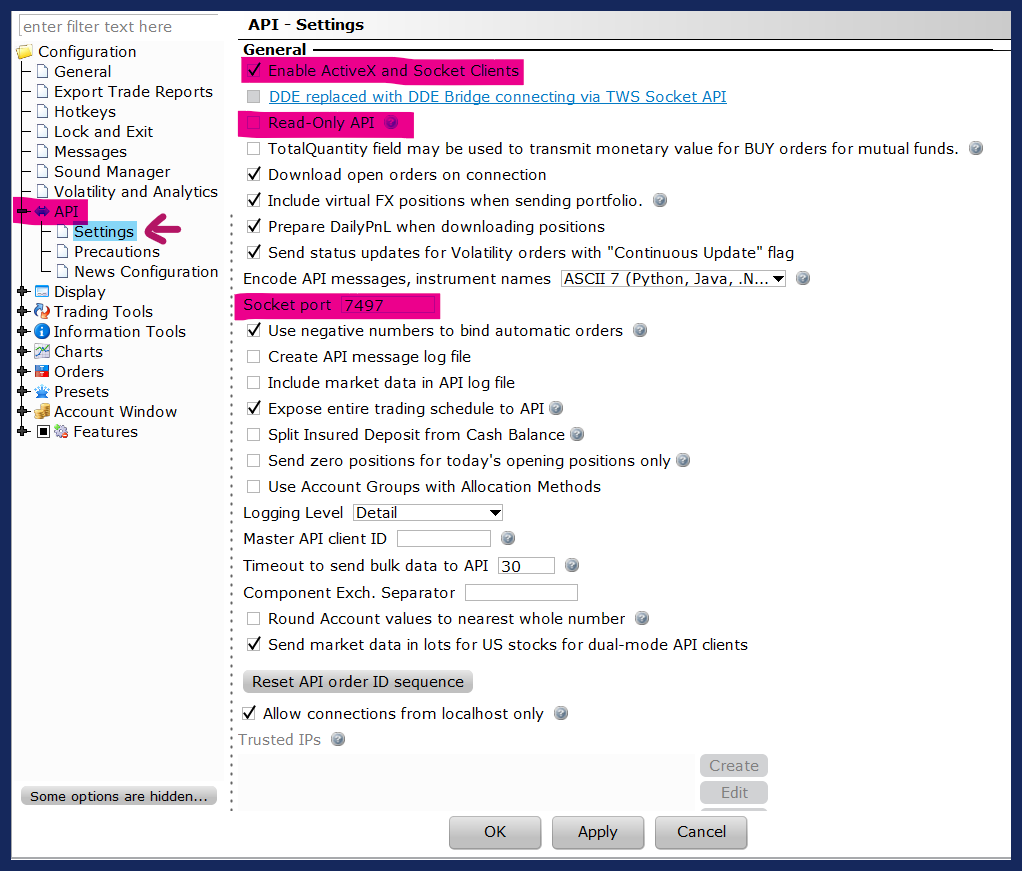
Thereafter, head to the API section Precautions:
Check all Bypass boxes to execute submitted orders immediately, without any further confirmation.
Uncheck all Bypass boxes if you would prefer to confirm the orders sent to Interactive Brokers before they are executed.
Hit Apply when you are done.
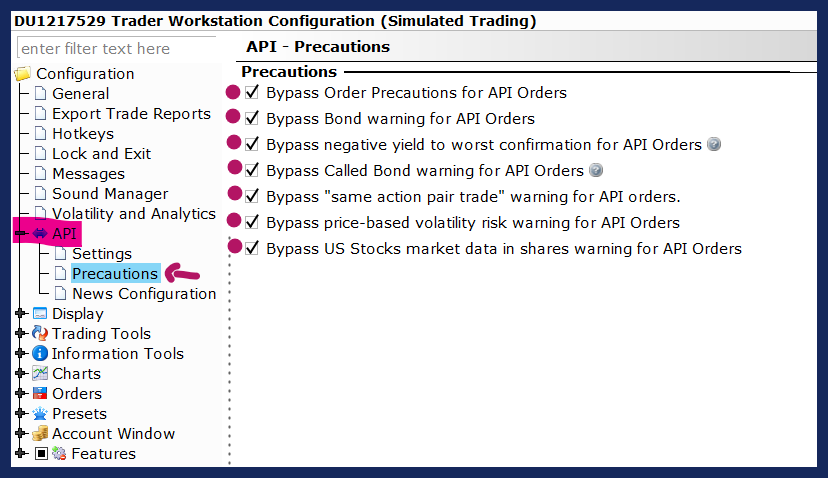
Now, open the Brokerage Plus Window from the Toolbar.
Click the Connect Tab in the upper left-hand corner of the Brokerage Plus Window.
Select Interactive Brokers - Connect from the dropdown.
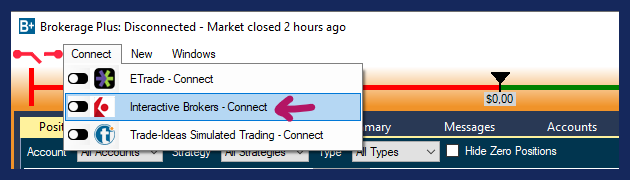
As Client ID enter 0 or 1.
As TWS Login Type, choose TWS Live to connect to your Live Account or TWS Paper to connect to your Simulated Account.
Make sure, the Socket Port in Interactive Brokers' Trader Workstation corresponds (7496 for your IB Live Account and 7497 for your IB Simulated Account).
Click Connect.
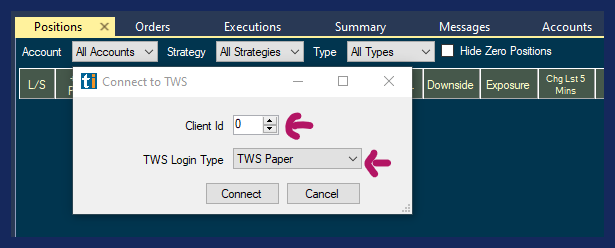
You will now see a green connection bar next to the Connect Tab of Brokerage Plus.
To disconnect, click the Connect Tab, and select Interactive Brokers - Disconnect
Lastly, make sure to have a paid data plan from Interactive Brokers for the exchanges you would like to trade.
Connect to ETrade
Click the Brokers Tab in the upper left-hand corner of the Brokerage Plus Window.
Select ETrade - Connect from the dropdown.
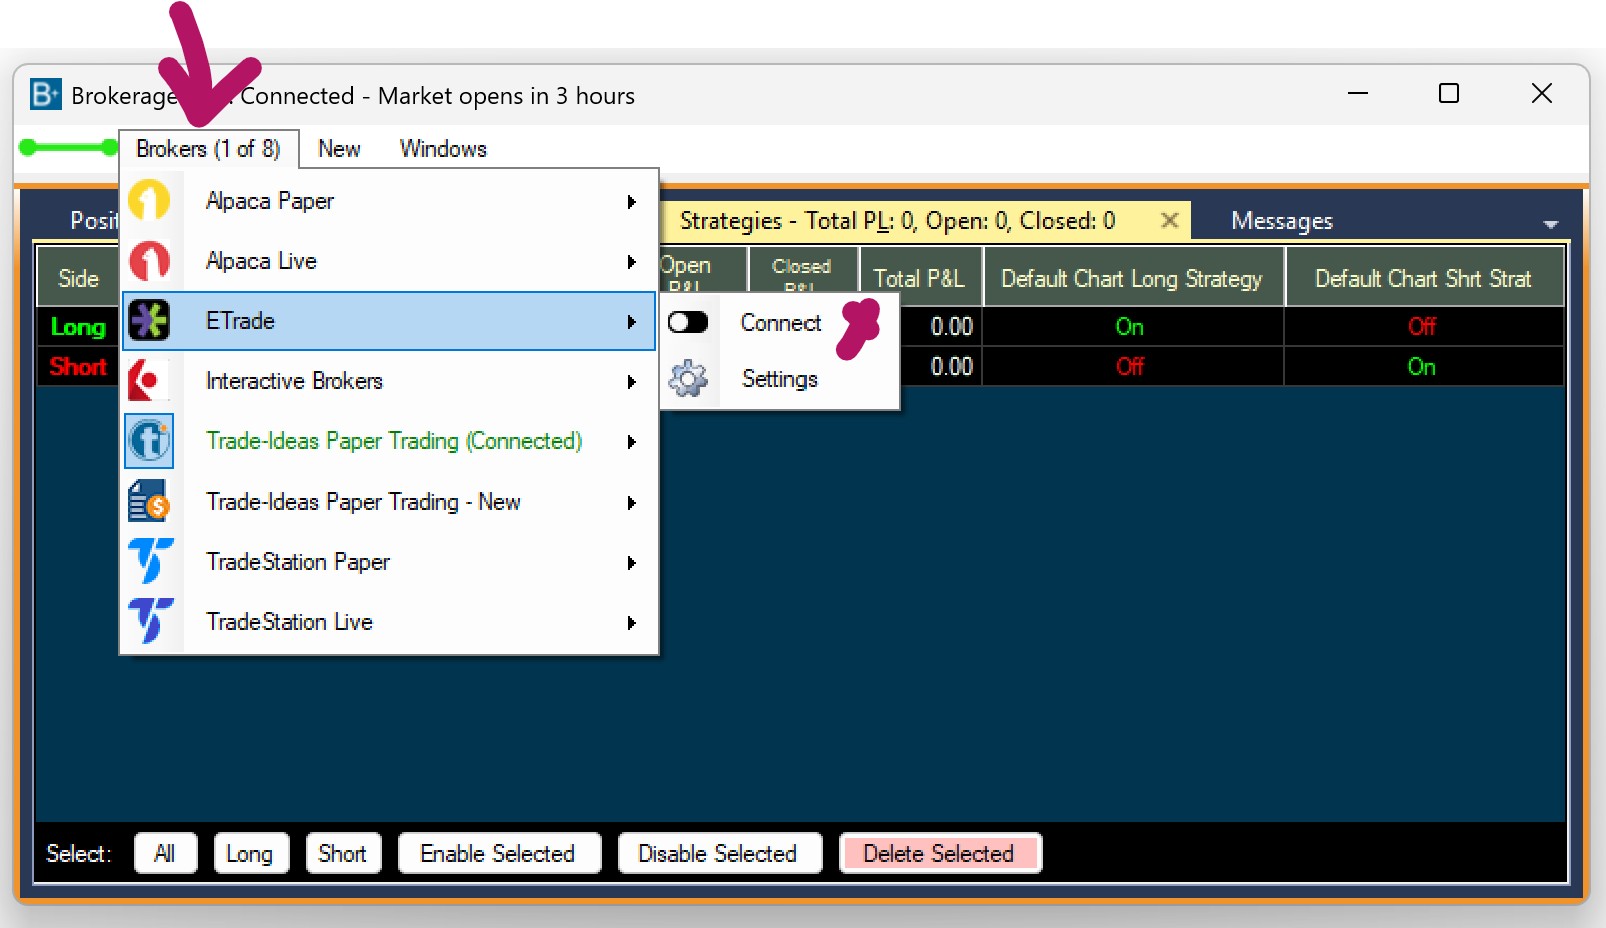
This will open the ETrade Login Page in your default web browser.
Log into your ETrade Account with your ETrade username and password.
Accept ETrade's connection to Trade Ideas.
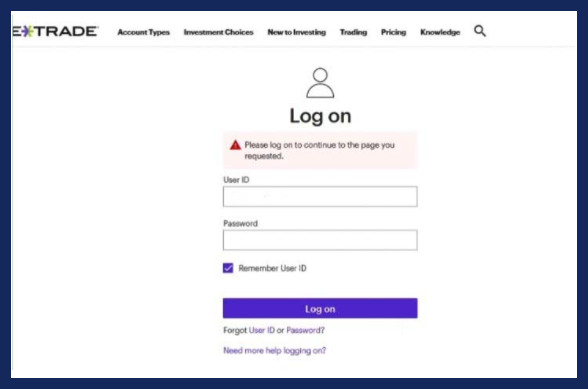
Accept ETrade's connection to Trade Ideas:
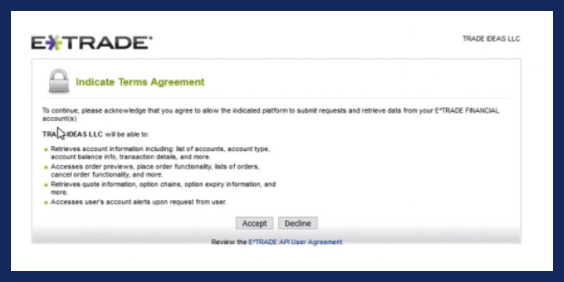
Copy the 6 digit code provided.

Minimize your browser window and paste it into the Connect to ETrade field of our software. Then, click Connect:
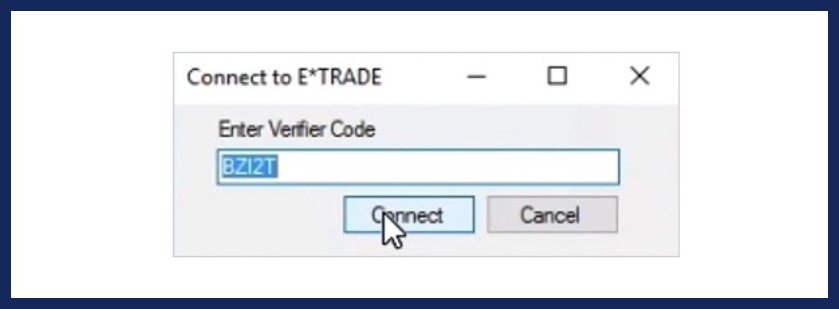
You will now see a green connection bar next to the Brokers Tab of Brokerage Plus.
To disconnect, click the Connect Tab, and select ETrade - Disconnect
Lastly, make sure to have a paid data plan from ETrade for the exchanges you would like to trade.
Connect to Alpaca Live or Paper
Alpaca Account Connection
To connect your Alpaca Live or Paper Trading account to the Brokerage Plus module of Trade Ideas Pro follow these steps:
- Firstly, navigate to the upper left-hand corner of the Brokerage Plus module. Here, you will see an option labeled 'Brokers'. Click on it and a dropdown menu will appear. From this list, select 'Alpaca Paper or Alpaca Live' and proceed by clicking 'Connect'.
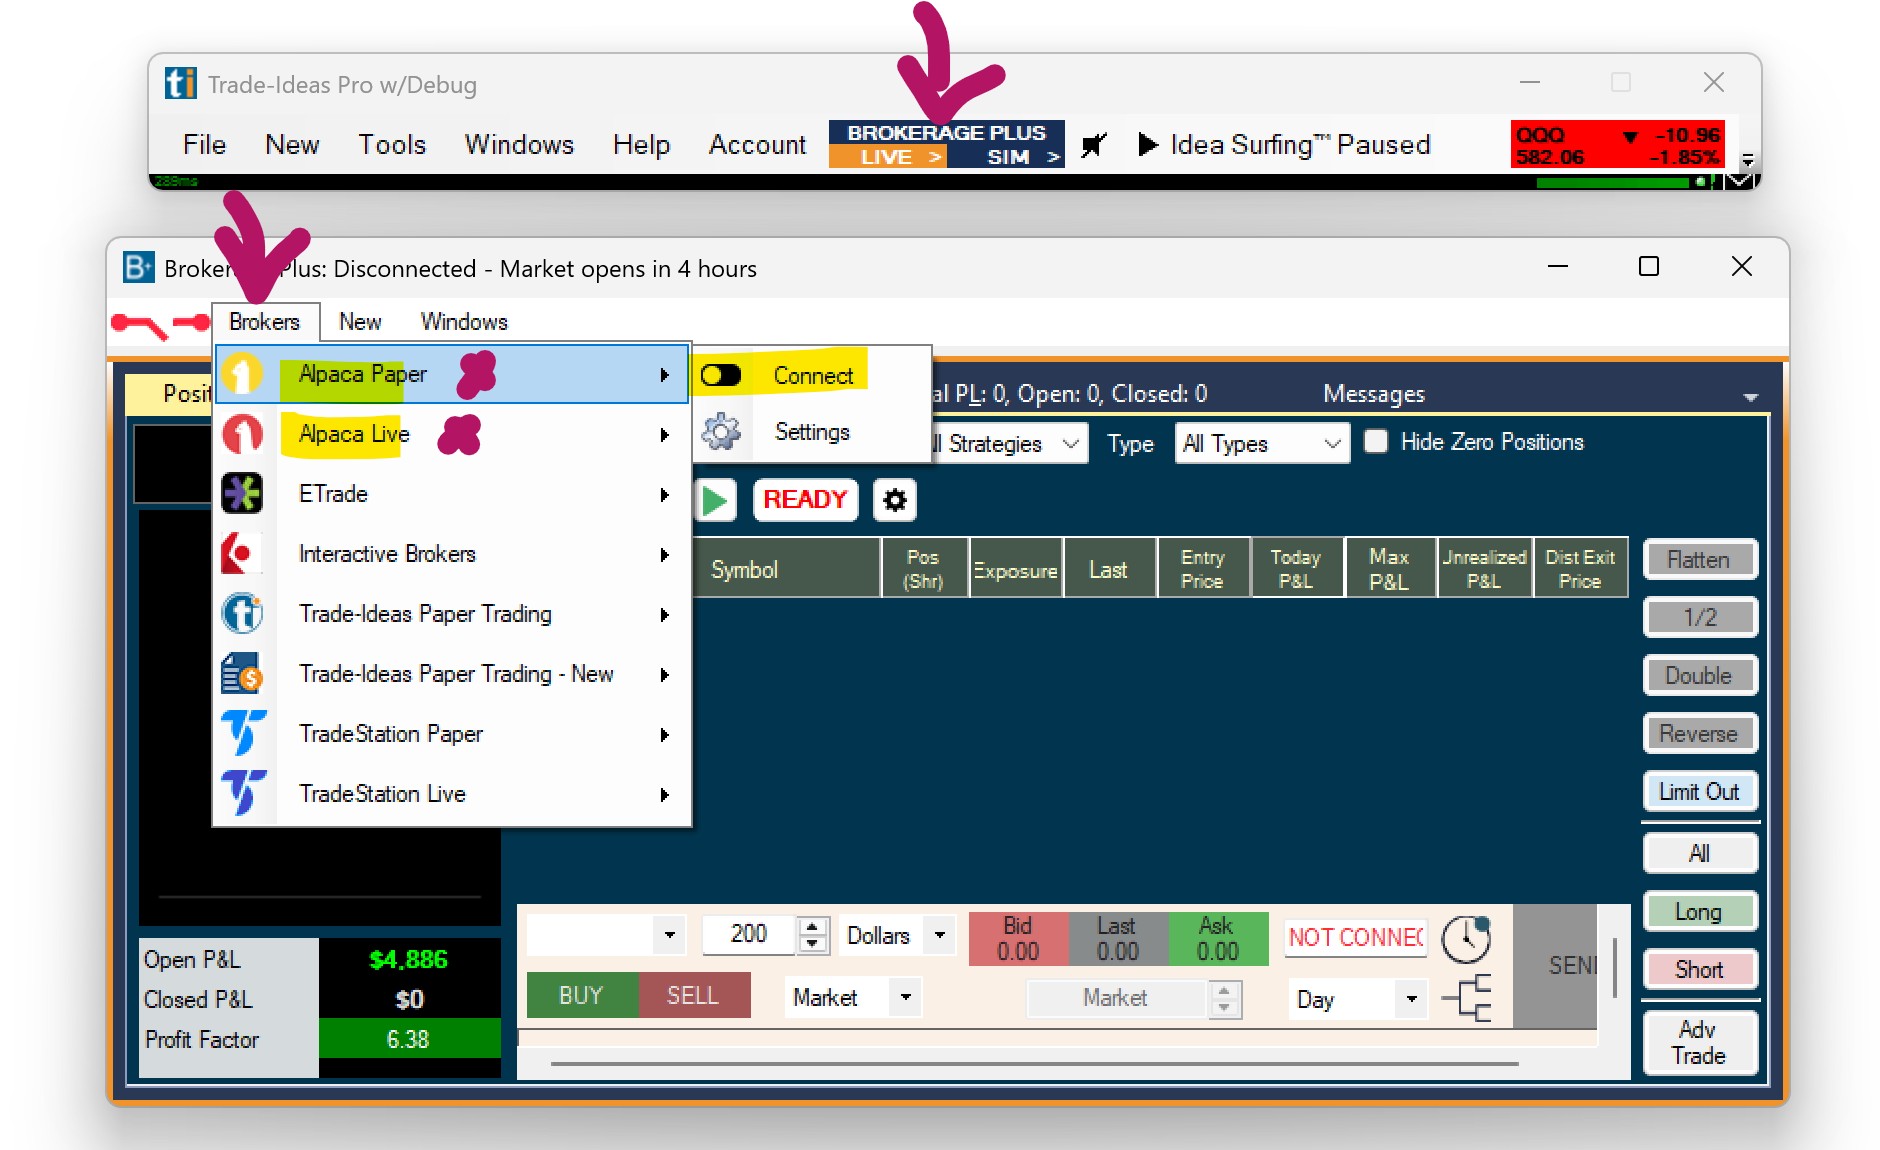
-
Upon clicking 'Connect', you will be prompted to input your Alpaca login credentials. Please input these details as requested.
-
After entering your credentials, the system will prompt you to click 'Allow'. Go ahead and click 'Allow'.
-
You will now see that your Alpaca Live or Paper account has successfully been connected to the Brokerage Plus module.
Following this, click on 'Account' in the Manual Order Entry Panel, and select your Alpaca Account from the dropdown.
You're now set up and ready for paper trading via the Manual Order Entry Panel.
If you are using One-Click-Trading or Chart Trading, make sure to select your Alpaca Account in your trading strategy after following the above steps.
Alpaca Manual Orders
In this video tutorial, we are going to guide you on how to execute orders using the Brokerage Plus Manual Order Entry panel with your Alpaca Account.
Alpaca Chart Trading
In this video tutorial, we will guide you on how to quickly create a strategy within Brokerage Plus. This allows you to execute trades directly from the chart whilst being connected to your Alpaca account.
Connect to TradeStation
How to Link Your TradeStation Account to Trade Idea's Brokerage Plus
Before You Begin
Tip: Whether linking to TradeStation Paper or TradeStation Live, the steps are identical. It's recommended to try the Paper trading connection first to get familiar with the process before going live.
Account Connection Requirements
- An active, funded TradeStation account
- Your TradeStation username and password
Account Connection Steps
Click the Brokers Tab in the upper left-hand corner of the Brokerage Plus Window.
Select TradeStation Paper or TradeStation Live from the dropdown, and select Connect.
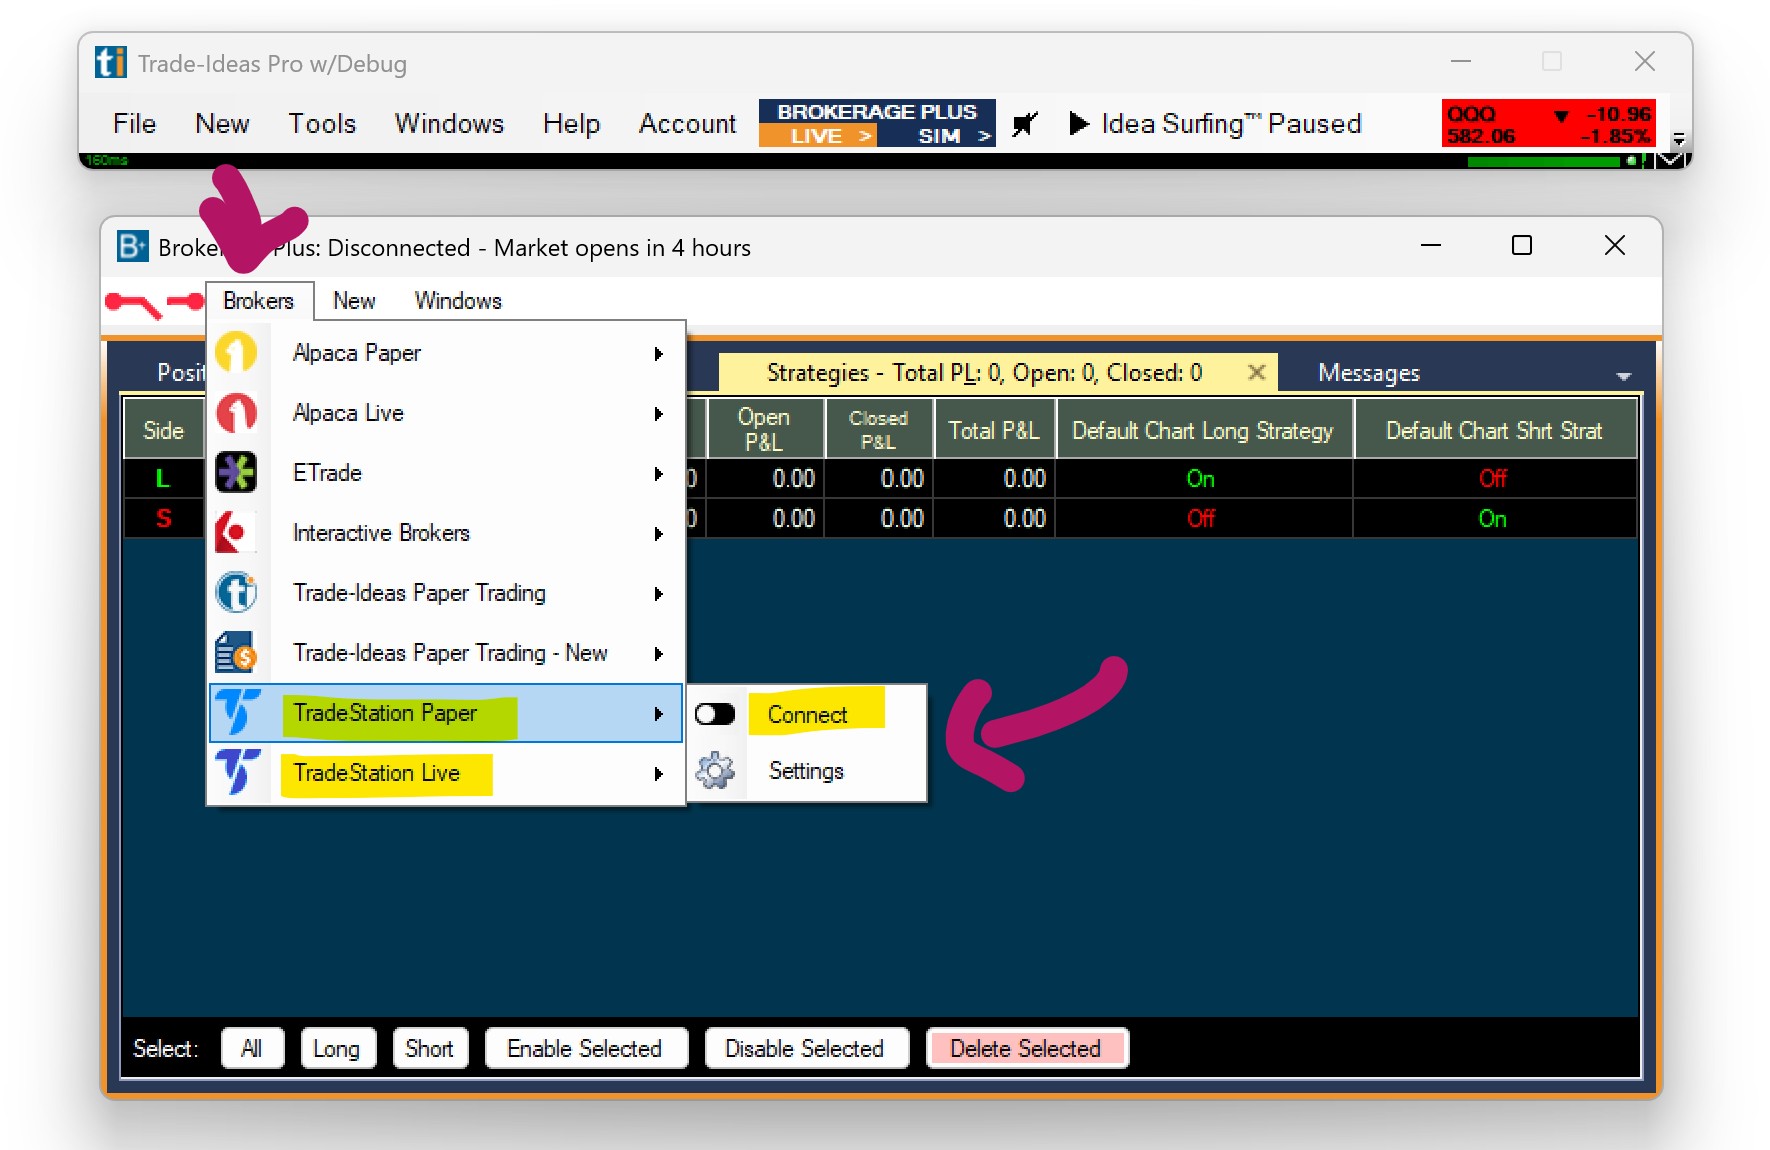
This will open the TradeStation Login Page in your default web browser.
Here, log into your TradeStation Account with your TradeStation username and password, and click Login.
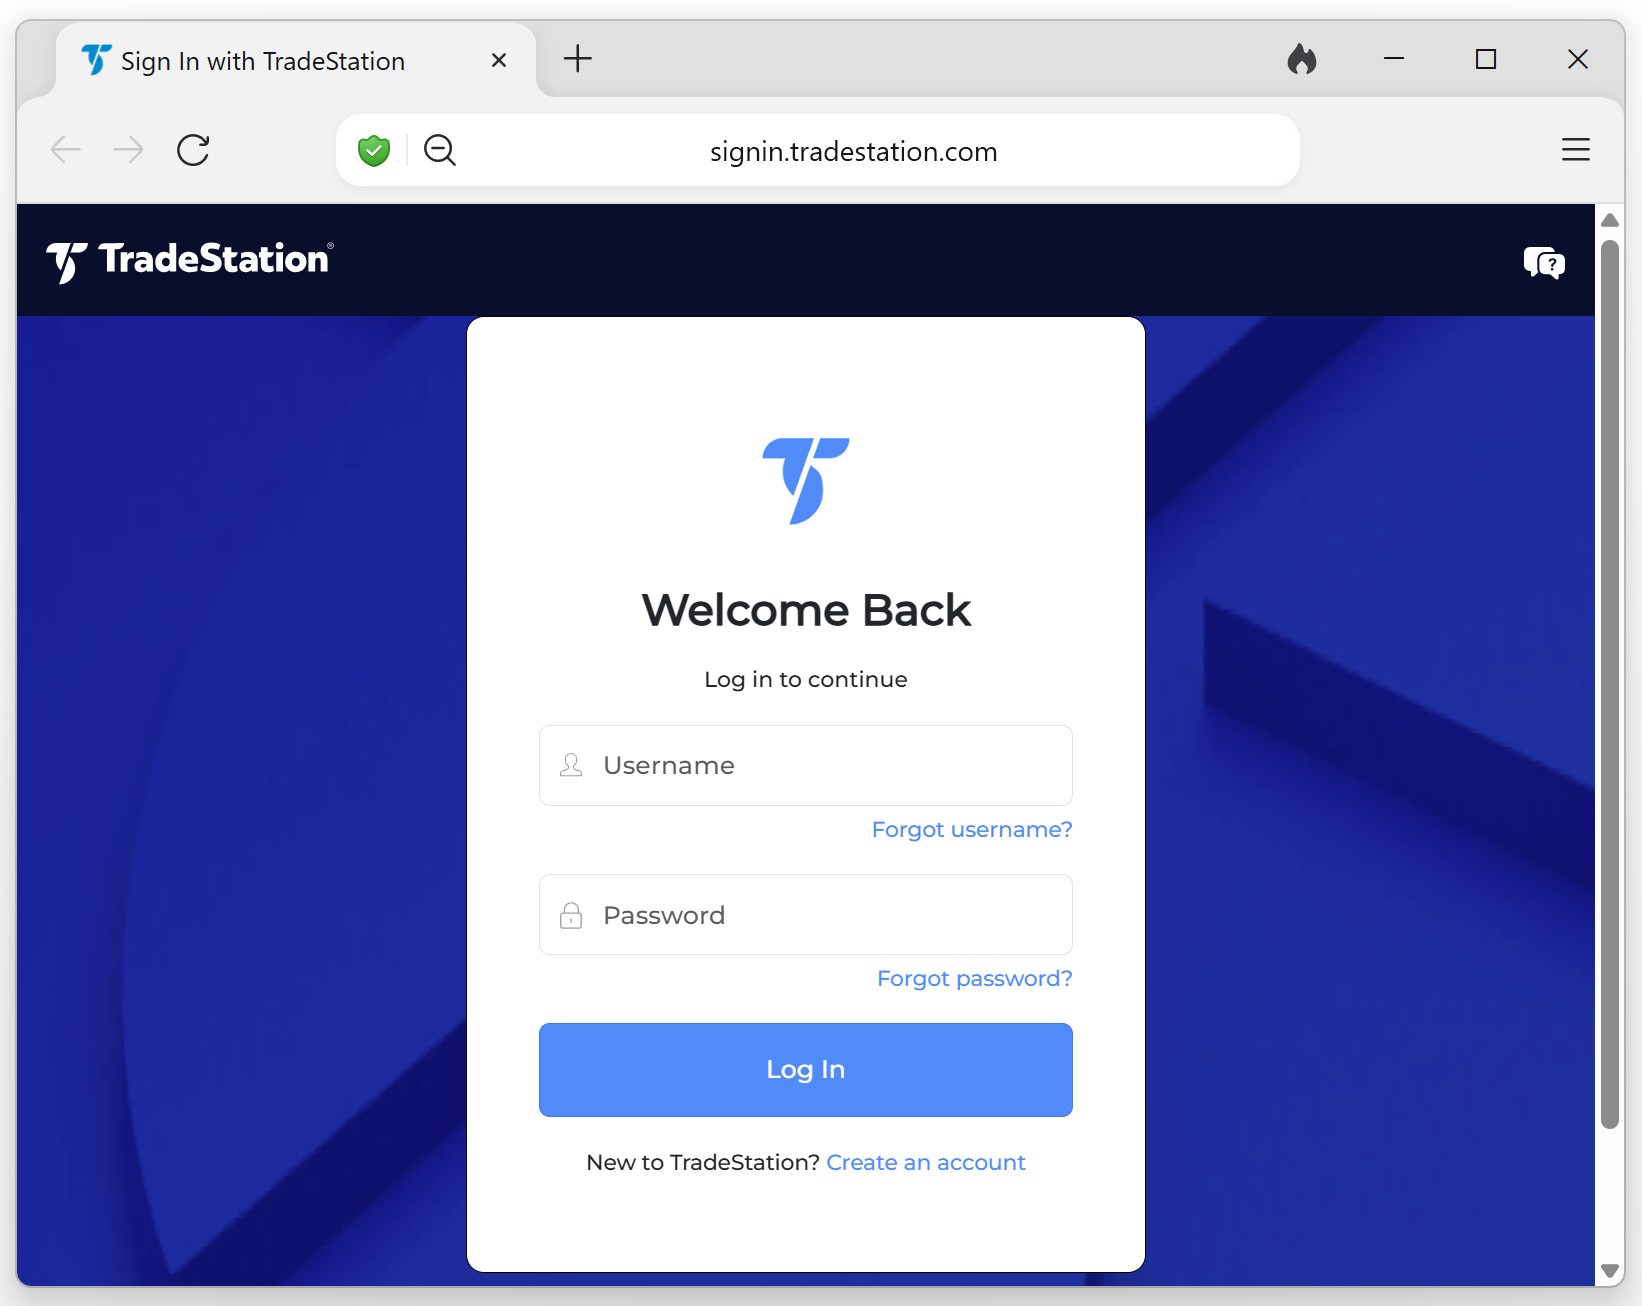
Now You're Linked!
Once logged in, the connection is established. Your portfolio data will sync automatically — no additional setup needed.
Good to Know
- No need to keep TradeStation open — once the web pass-through is complete, your portfolio will be visible directly within Trade Ideas.
- Re-authorization — the connection will remain active for a period of time before asking you to log in again.

New Tab
The Brokerage Plus New Tab enables you to load new tabs of the different Brokerage Plus windows.
Alternatively, you can open them in separate Windows, by opening the Windows dropdown at the bottom of the New Tab menu and selecting the Grid version.
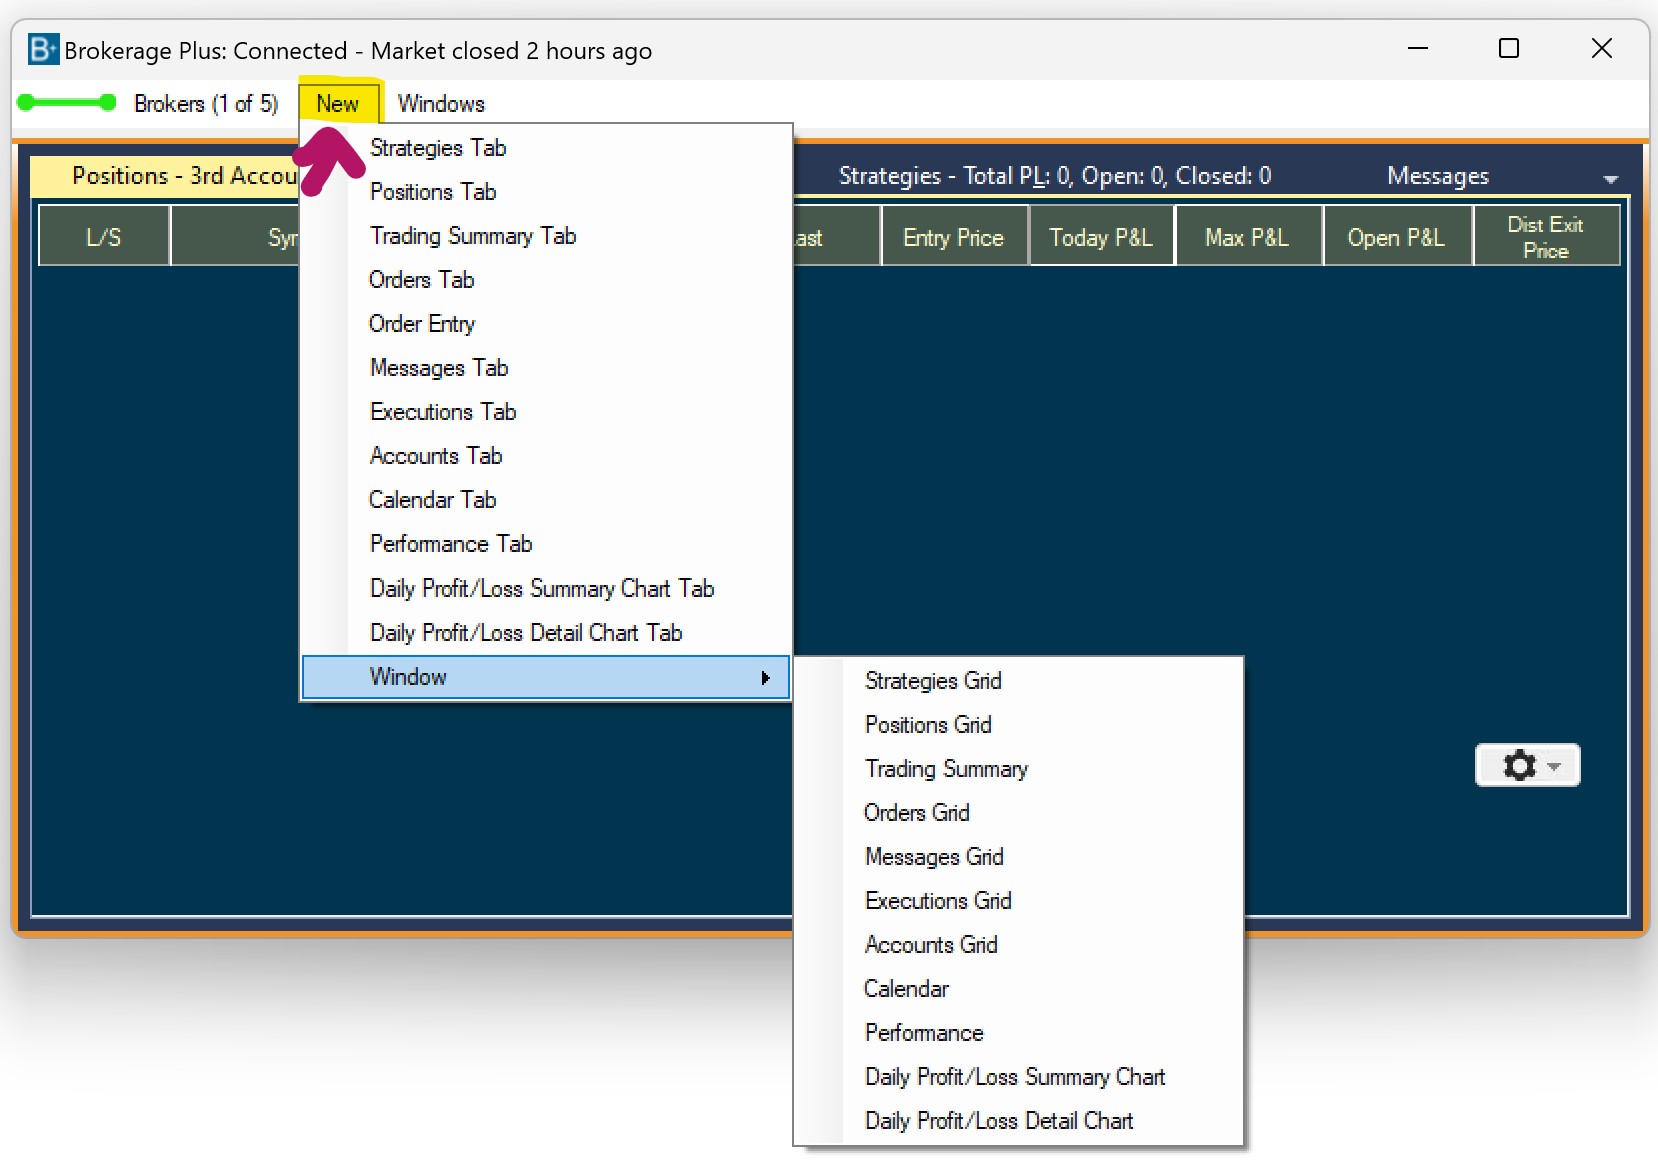
Windows Tab
The Brokerage Plus Windows Tab enables you to control the Brokerage Plus Grid Windows. In addition to that, you can turn the Privacy Mode as well as the Profit Continuum on and off.
Show Brokerage Plus Windows
If you have the various Brokerage Plus Windows open as Grids, the function Show Brokerage Plus Windows will bring them all to the top of the program or open them if they’re minimized in the Taskbar.
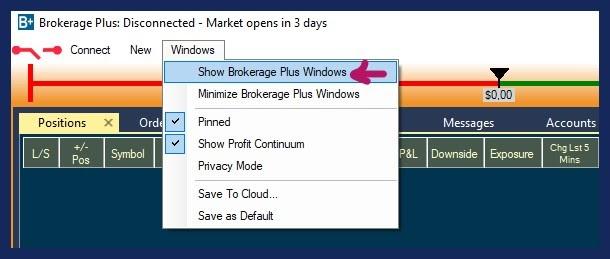
Minimize Brokerage Plus Windows
If you have the various Brokerage Plus Windows open as Grids, the function Minimize Brokerage Plus Windows will minimize them in the Taskbar.
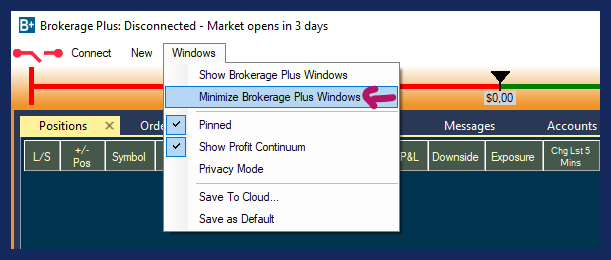
Symbol Linking
Brokerage Plus is symbol-linked, which means that when changing the stock symbol in one of your Brokerage Plus Tabs or Windows (e.g. the Positions Tab), your symbol-linked Single Stock Window and Chart will automatically change as well and display the specific stock’s data. By default, all symbol-linked Windows belong to the blue Color Group. The assigned color will always display in the top left-hand corner of each window.
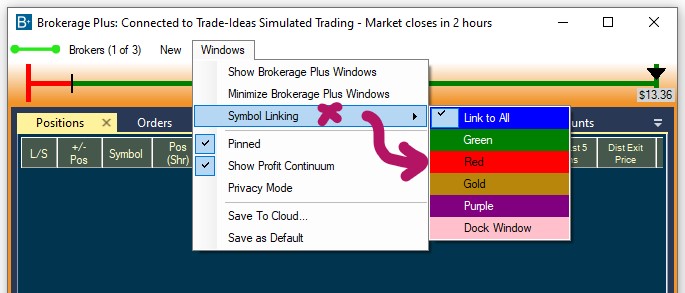
You can create additional Linking Color Groups and by doing so, link selected windows to a specific Chart or Single Stock Window.
To learn all about Symbol Linking, head to this section
Grid Windows List
If you have the various Brokerage Plus Windows open as Grids, you will see each grid window listed in the Windows Tab. A click on it will bring the Grid window to the front when it's hidden behind other windows or minimized in the Taskbar.
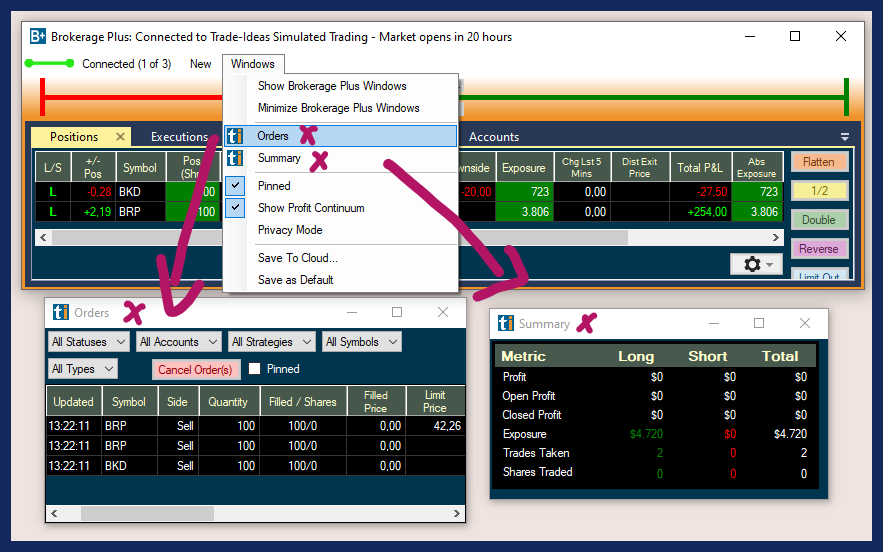
Pinned
Unlike the other Trade Ideas Windows, the Brokerage Plus Window is Pinned by default. This ensures that your Portfolio Manager stays open, even when switching layouts, or toggling through channels. Learn more about Pinning here.
Show Profit Continuum
You can enable or disable to show the Profit Continuum, which will provide an overview of the traded stock symbols and their profitability.
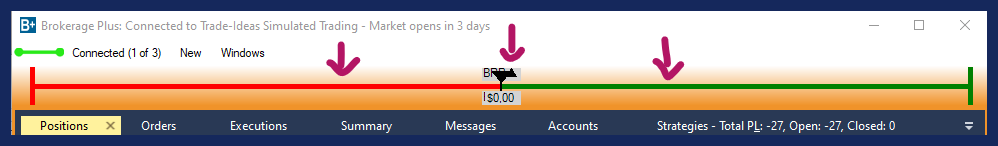
Privacy Mode
When Privacy Mode is enabled, your Account Number, as well as your Account value, will be hidden, which protects you when sharing your screen with others.
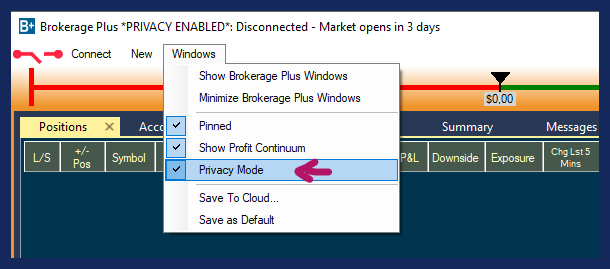
Save to Cloud
Once you have made adjustments to your Brokerage Plus Window, arranged its layout, rearranged columns, and set up Trading Strategies or Entry Order Templates, make sure to save it to the Cloud for future use.
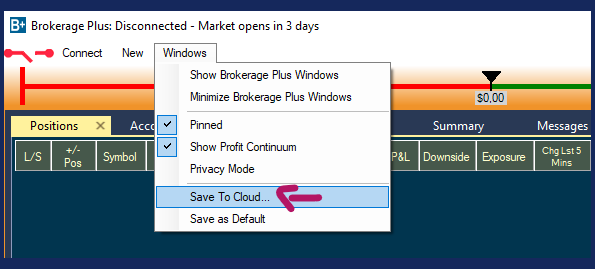
Enter a new name into the Title field or keep the automatically added one.
Enter a description for your Brokerage Plus Window or leave the Description field blank.
If you would like to automatically close any other open layout or channel in the future, whenever you load the Window, select Clear Previous Layout.
If you would like to load this scan on top of any already opened layout, leave this checkbox blank.
Select Save when you are done or select Save and Share to share the Brokerage Plus Window with others before saving it to the cloud.
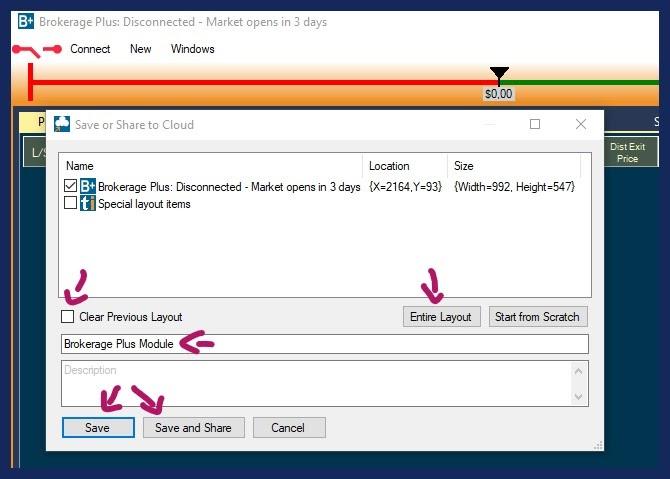
When you choose the option Save and Share the Share This Link Window will open, which offers various sharing options:
Scan the QR code
You can scan the displayed code with any QR reader app available on your phone. Thereafter, you can share it with other users of our desktop program.
Select Copy All, to save the Cloud link to your clipboard and paste it into an email or messaging app.
Click the Twitter icon to share the window’s Cloud Link on Twitter and include a text message if you like. If you haven't connected Trade Ideas to Twitter yet, a Twitter Authorization Form will open. Log in with your Twitter username and password. Then click, Authorize App. Thereafter, copy the displayed Pin Code into the field at the bottom left-hand side of the window and select Confirm.
Select OK when you are done.
Your Brokerage Plus Window is now stored in your cloud, from where it can easily be retrieved. Just go to the Toolbar, open the File Tab and choose Load from Cloud. To find a saved Brokerage Plus Window, you can enter its name in the search field, or scroll through the list. Just highlight it, then choose Load.
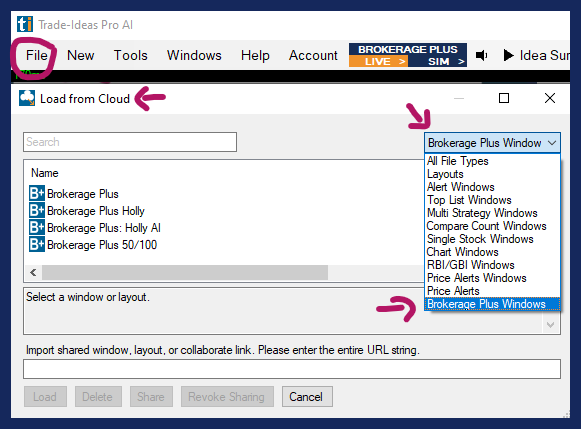
Save as Default
Once you have configured the Brokerage Plus Window, you should save its configuration as the default version.
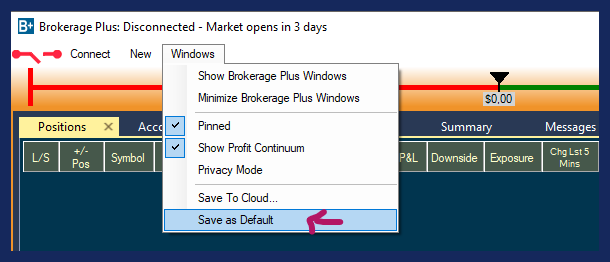
The Load Window option, which you can find in the File Tab of the Toolbar, provides access to all the default versions of your Trade Ideas windows. The default layouts of your Chart, Single Stock, Brokerage Plus, and AI Windows are saved in the TradeIdeasPro folder on your local computer. In addition to saving your Brokerage Plus Window as default, you should also save it as part of your Default Layout. To do so, go to the Toolbar, open the File Tab and select Save Layout.
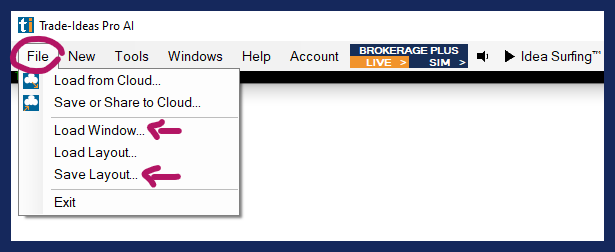
Strategies Tab
The Strategies Tab of the Brokerage Plus Module enables you to create simple One-Click Order Entry Templates as well as complex Trading Strategies that can be executed via One-Click or Automation.
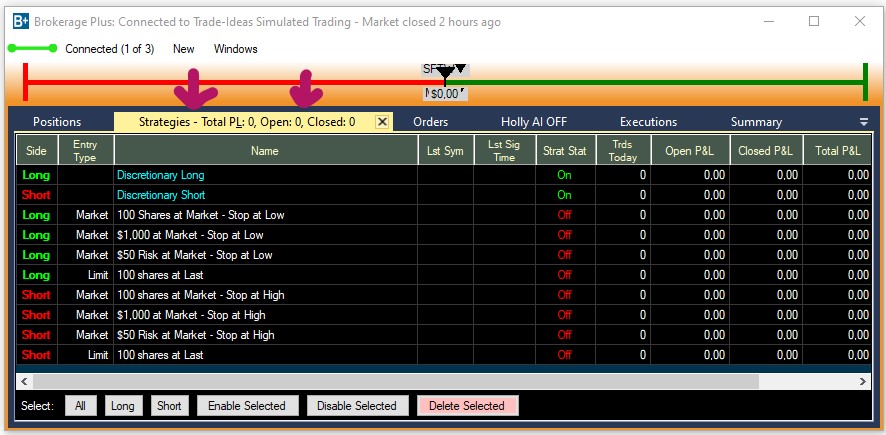
Preset One-Click Order Entry Templates
The Strategies Tab of the Brokerage Plus Module contains 8 preconfigured Order Entry Templates enabling you to get started with trading right away. There are 4 Templates to buy shares and 4 Templates to short.
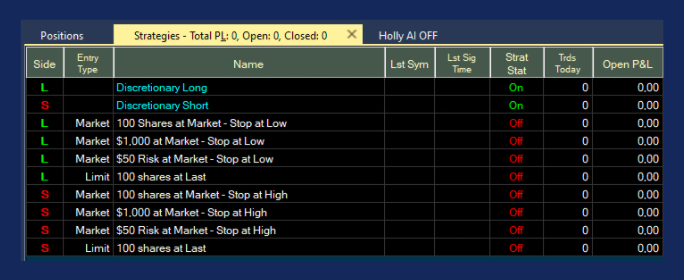
4 Long/Buy Templates:
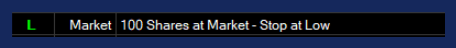
100 Shares at Market - Stop at Low
When selected via right-click, this one-click order buys 100 shares of the chosen stock by submitting a Market Order. A Stop Loss is placed at the Low of the Day.
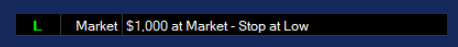
1000 Shares at Market - Stop at Low
When selected via right-click, this one-click order buys 1000 shares of the chosen stock by submitting a Market Order. A Stop Loss is placed at the Low of the Day.

$50 Risk at Market - Stop at Low
When selected via right-click, this one-click order bases the number of shares to buy on the Distance of the Price to the Stop Loss. Assuming the Stop Loss is 20 cents per share, it will buy 250 shares (Total Amount at Risk $50/0.20). A Stop Loss is placed at the Low of the Day.

100 Shares at Last
When selected via right-click, this one-click order buys 100 shares of the chosen stock by submitting a Limit Order at the price of the stock at that time. No Stop Loss is placed.
4 Short/Sell Templates:

100 Shares at Market - Stop at High
When selected via right-click, this one-click order shorts 100 shares of the chosen stock by submitting a Market Order. A Stop Loss is placed at the High of the Day.
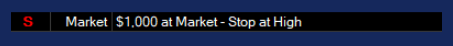
1000 Shares at Market - Stop at High
When selected via right-click, this one-click order shorts 1000 shares of the chosen stock by submitting a Market Order. A Stop Loss is placed at the High of the Day.

$50 Risk at Market - Stop at High
When selected via right-click, this one-click order bases the number of shares to short on the Distance of the Price to the Stop Loss. Assuming the Stop Loss is 20 cents per share, it will buy 250 shares (Total Amount at Risk $50/0.20). A Stop Loss is placed at the High of the Day.

100 Shares at Last
When selected via right-click, this one-click order shorts 100 shares of the chosen stock by submitting a Limit Order at the price of the stock at that time. No Stop Loss is placed.
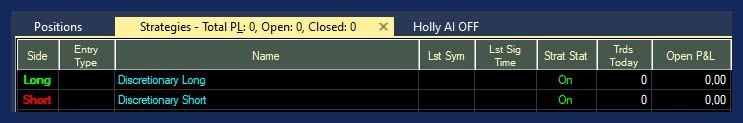
The Discretionary Long/Short Strategies aren’t strategies to place trades, they are necessary for the system and are used to list any trades that you have entered manually via the Manual Order Entry Panel without using the Strategies Tab.
New Trading Strategy
To create a new One-Click Order Template or an Auto-Trading Strategy, right-click into the Strategies Tab and choose New Trading Strategy.
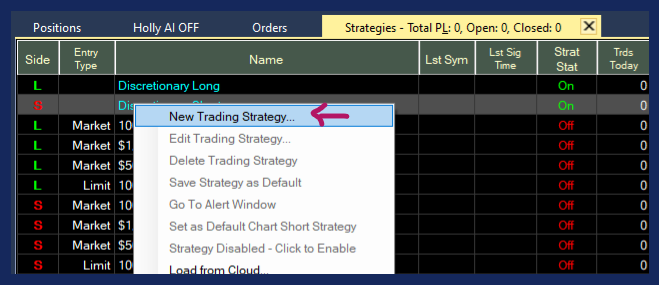
Create a Custom One-Click Order Entry Template
Our One-Click Order Feature enables you to trade stocks right from your scans and charts. Simply right-click into the scan or chart and select Trade XYZ to bring up a dropdown menu with preset order templates.
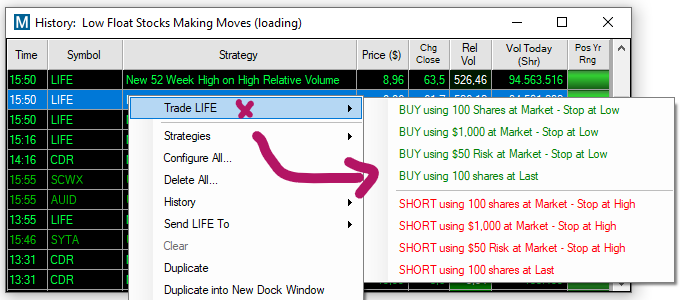
To create a custom Order Template defining Share Size, Stop Loss, and Target for our One-click Trading Feature, open the Strategies Tab within Brokerage Plus by selecting New and then Strategies Tab.

Alternatively, you can open the Strategies Tab or any other tab in separate Windows, by opening the Windows dropdown at the bottom of the New Tab menu and selecting the Grid version.
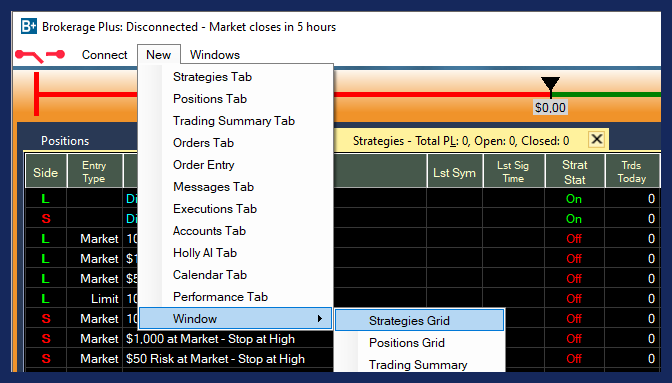
Right-click in the Strategies Tab and choose New Trading Strategy.
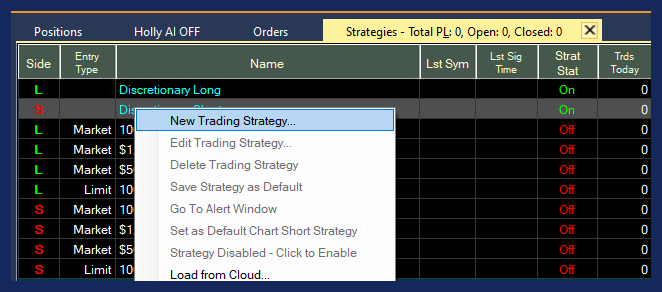
Configuration Tab
Please note, this Configuration Menu is also used to create trading instructions in order to automate strategies. The menu options that aren’t relevant for a simple One-Click Order Template will not be outlined in this section.
Give your Order Template a Name and choose its Direction. If you would like to buy stocks using the template, select Long, if you would like to borrow stocks to sell, choose Short.
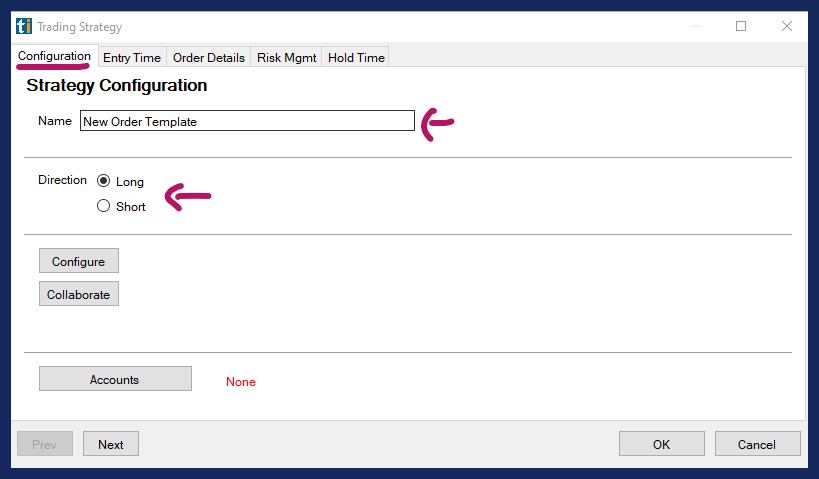
Next, select Accounts and choose Accounts as Allocation Type. Then, select your trading account. This will either be our in-house simulator or your account at a participating brokerage. Please note, that you have to connect to this account via the Connect Tab first for it to be displayed and ready to use.

After choosing your account, hit Save.
Entry Time Tab
Now, head to the Entry Time Tab. These settings are more relevant for the automation of strategies. For a One-Click Order Entry Template set the Start Time to 9:30 am and the End Time to 4 pm.
Uncheck all the options, except Send orders even when holdings exist for symbols, which we recommend to leave checked.
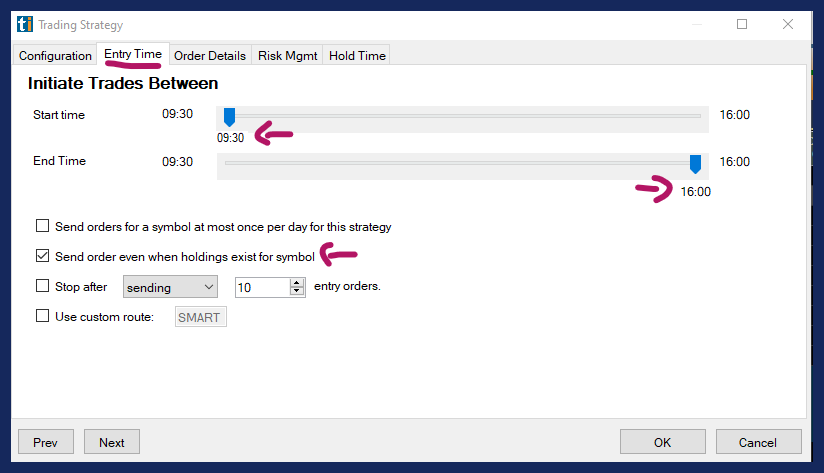
The option Use Custom Route is only relevant if you wish to execute your order on a specific route, like the ARCA or BATS. Leave it unchecked unless you have a reason to change the exchange route.
Order Details Tab
In the Order Details Tab, you can define your position sizing. You can base your position size on Fixed Dollars, Fixed Shares, or the total amount you would like to risk in terms of a Stop Loss. Our software will automatically calculate the other parameters, saving you time and effort.
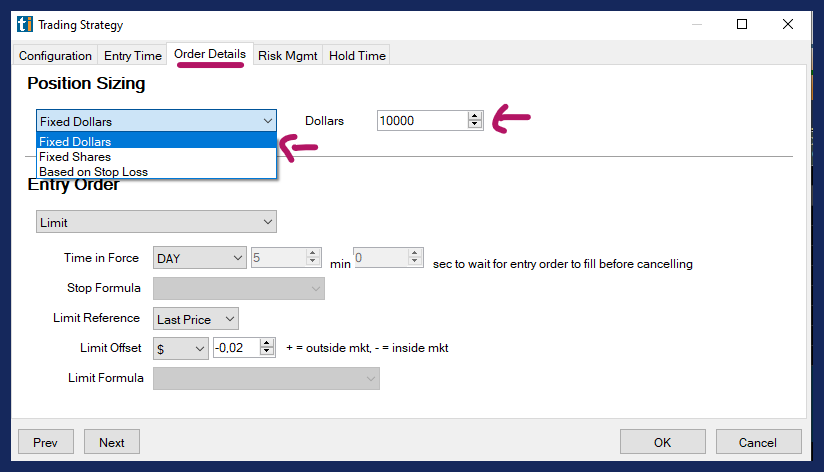
Next, you can select the Entry Order type.
In B+ Basics we recommend using either a Limit or a Market Order as your Entry Order type.
The options Stop Limit or Stop Entry Order will be discussed in B+ Intermediate. Only choose these entry order types if you are familiar with the use of filters and custom formulas in order execution.
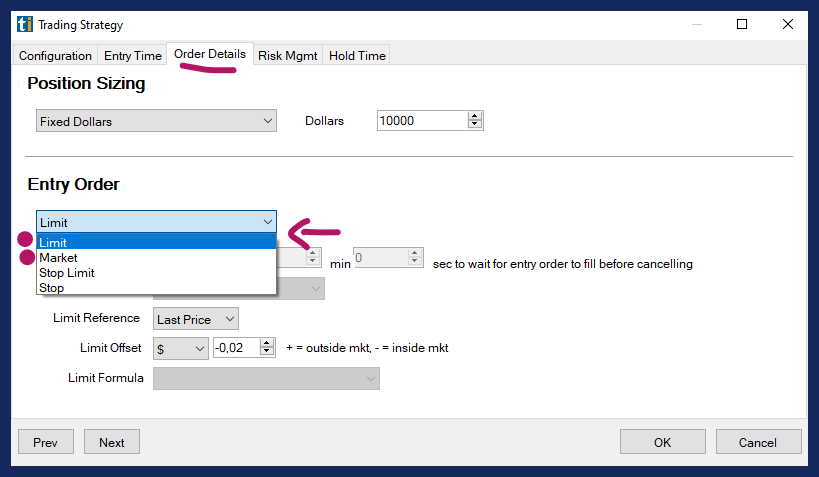
Choose a Limit Order, if you would like to keep tight control over the entry price, which is advisable, especially for new traders. Choose a Market Order, if getting into the trade is more important to you than the exact entry price.
A Limit Order is an order to buy or sell a stock at a specific price or better.
A Buy Limit Order can only be executed at the Limit Price or lower.
A Sell Limit Order can only be executed at the Limit Price or higher.
While limit orders do not guarantee execution, they help ensure that you do not pay more than the predetermined price for a stock.
A Market Order is an order to buy or sell a stock immediately at whichever price is available at this moment. Generally, this type of order will be executed immediately. Learn about Market Orders before making this choice and be particularly careful using this order type when trading fast-moving stocks and stocks with large spreads.
Time in Force defines when your open order gets canceled if it hasn’t been filled.
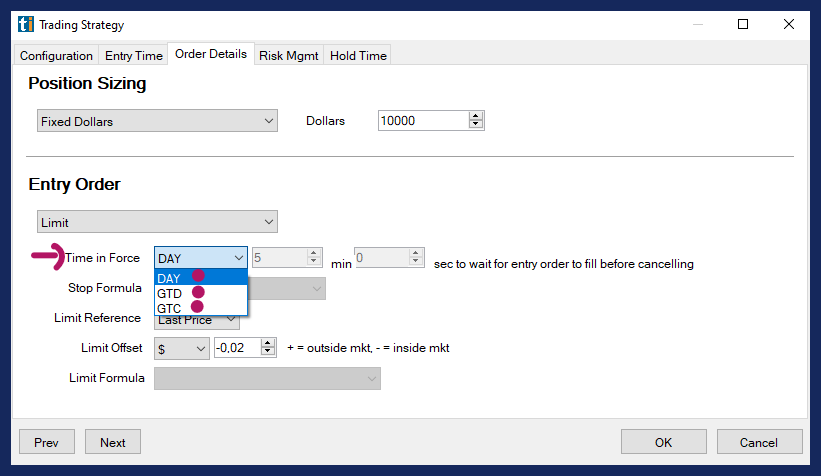
DAY means the order will stay open until the close of market on the given day.
GTD means Good Till Day. Select the number of minutes and seconds, you would like your order to stay open.
GTC which means Good Till Cancelled. If selected, your order will remain open, until you manually cancel it.
In B+ Basics we recommend using Last Price as Limit Reference. This means that your Limit Order will be submitted at the current price of the stock.
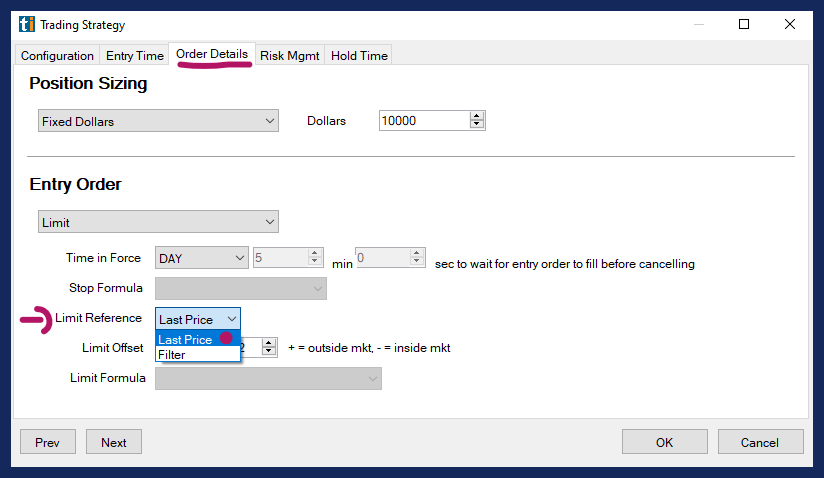
The Limit Offset gives you the ability to control how aggressive or passive your Entry Order will be, it simply allows a bit of wiggle room. If you set the Limit Offset to 0, you are stating that your limit price for the order will be the exact price of the alert.
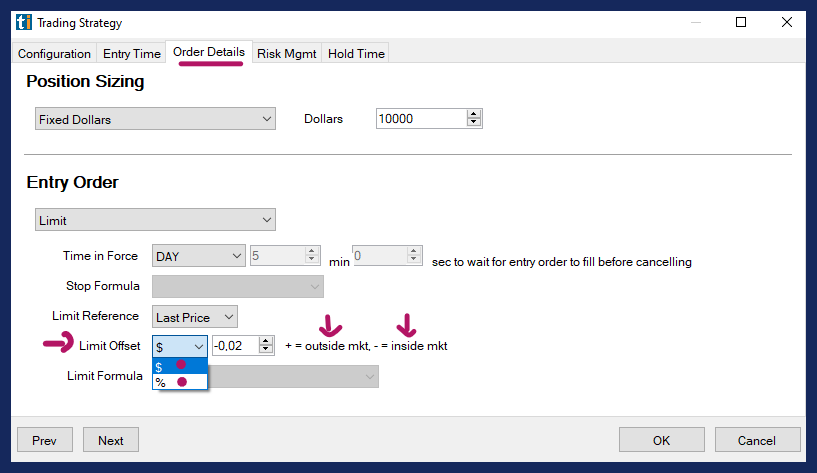
If you enter a negative Limit Offset, like - $0.02, you are prepared to pay up to 2 cents more per share (long) or 2 cents less (short). This approach is best for prioritizing the likelihood of being filled over a rigid price level.
If you enter a positive Limit Offset, like $ 0.01, you are waiting for the price of the stock to become 1 cent “cheaper” (long) or 1 cent higher (short). You are stating that you are prepared to wait for the stock price to move in your direction, rather than to pay a little extra to get in easier or quicker.
Please note, these rules are the same for long and short orders.
Risk Management Tab
The Risk Management Tab lets you define a Stop Loss or Trailing Stop and a Profit Target.
In B+ Basics we’ll discuss defining Stop Loss and Target Price in Dollars and in Percent.
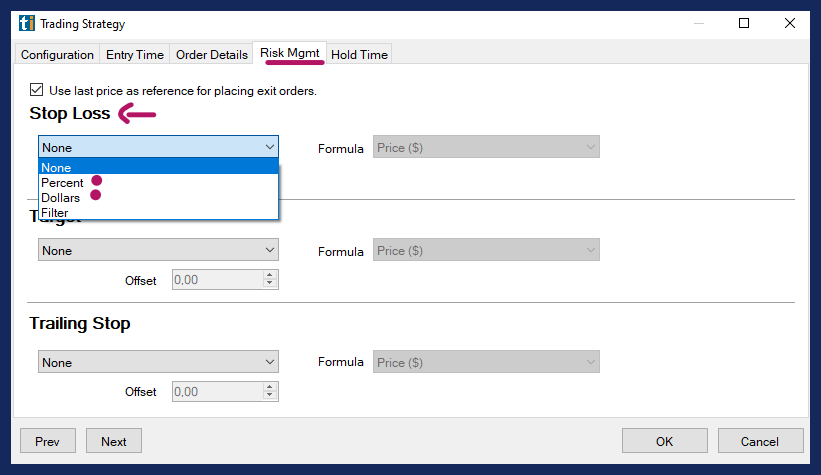
If you choose Dollars/per Share use the Offset to define the number. As an example, if you would like to use a 20 cent per share Stop Loss, enter 0.20 as the Offset.
If you choose Percent/per Share use the Offset to define the number. As an example, if you would like to use a 2% Trailing Stop, enter 2.00 as the Offset.
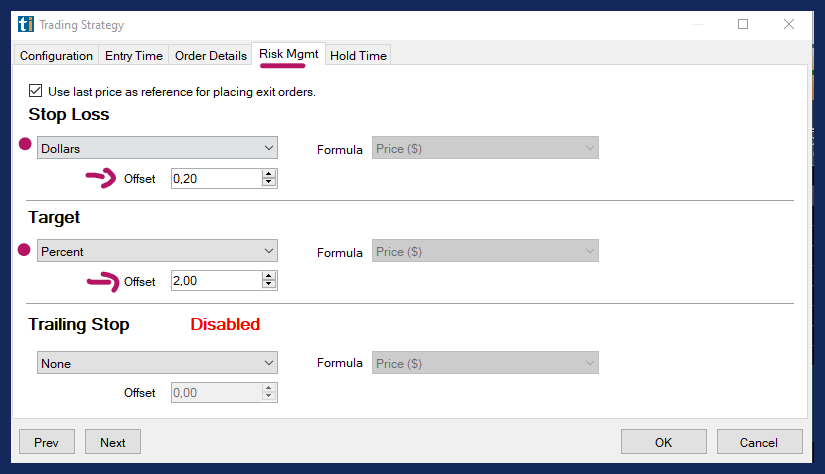
Within Brokerage Plus, you have to choose between placing a Stop Loss or a Trailing Stop, the other option will automatically be disabled. Having more than one stop can create various issues, e.g. double filling, that outweigh any potential benefits.
When the option “Use last price as reference for placing exit orders” is selected, your exit orders will be placed relative to the Last Price. The program will attempt to base the exit order on the Last Price at placement of the order. The actual fill price cannot be part of the calculation since exit orders are submitted as brackets orders together with the entry order.
When this option is unchecked, your exit orders will be placed relative to the order price or price that triggered the alert including the Offset. In B+ Basics we recommend leaving the option checked.
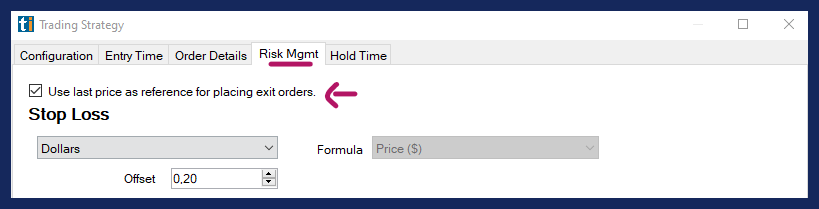
Hold Time Tab
The Hold Time Tab enables you to set a Timed Exit. Disable any Time Stop by choosing None or select an Intraday or a Multi-Day Time Stop.
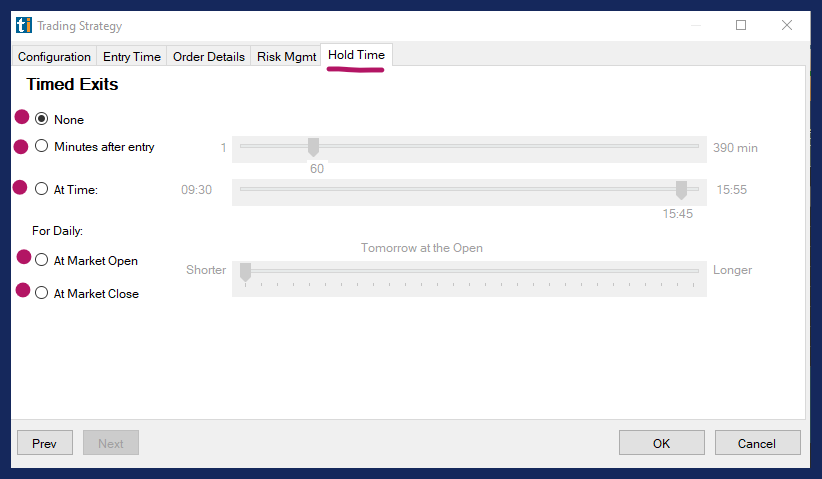
To close the trade and exit your position after a certain time period in minutes, select the option Minutes after entry and set your time.

Alternatively, you can define a specific time of day for your exit.

You can also choose an exit in relation to the open or close of the market. This option is particularly useful for swing traders who like to hold their position for longer periods of time.
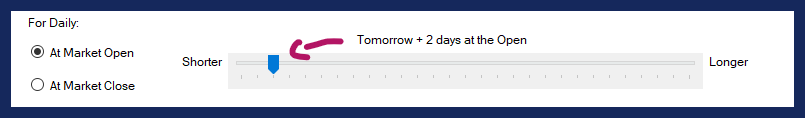
Select OK once you have adjusted all your settings.
You will now see the newly created Order Template listed in the Strategies Tab of Brokerage Plus.
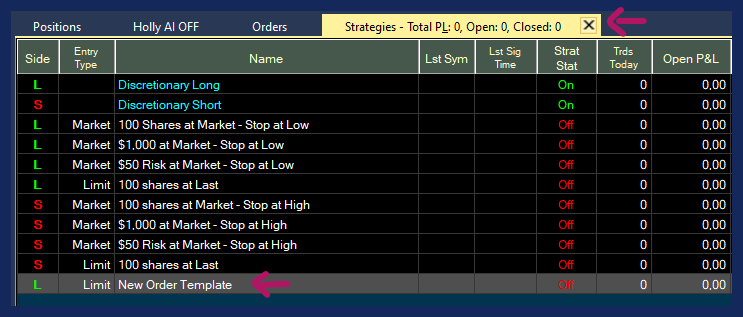
If you right-click into your scan or chart and select Trade, your newly created Order Template will be listed as an option in the dropdown menu.
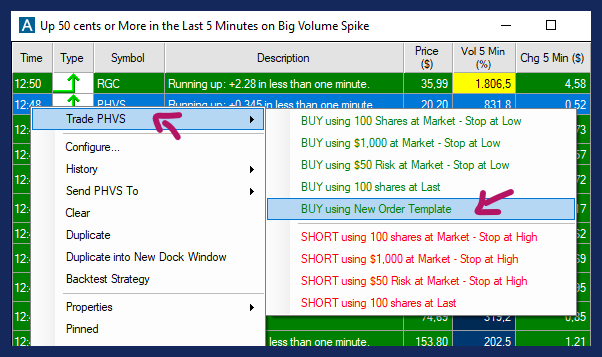
Once selected, your entry order will be sent directly to your brokerage with the configured Entry and Exit parameters.
Once executed, your trade will be displayed in the Positions Tab of Brokerage Plus.
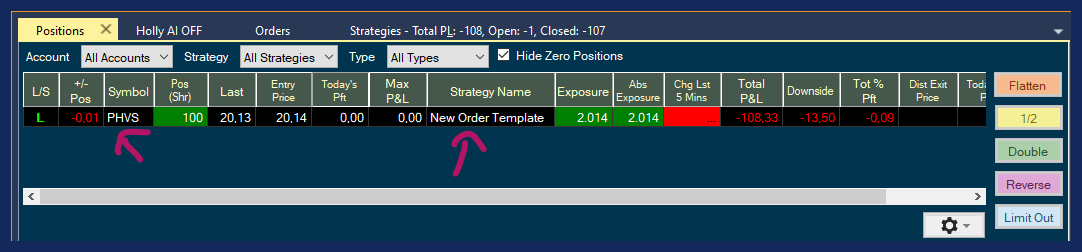
A right-click on any of your positions in the Positions Tab of Brokerage Plus will bring up a menu enabling you to adjust your Stops and Targets.
Sample One-Click Order Template
A Sample One-Click Order Template for a Long Strategy could be set up as follows:
Name: Risk $100
Direction: Long
Account: Trade Ideas Simulated Trading
Start Time: 9:30
End Time: 16:00
Position Sizing based on Stop Loss, Dollars $100
Entry Order: Limit
Limit Reference: Last Price
Time in Force: GTD 3 minutes
Limit Offset: -0.02
Stop Loss: Dollars, Offset: 0.20
Target: Dollars, Offset: 0.40
Hold Time: None
Create an Auto-Trading Strategy based on an Alert Window
Please read the previous section on how to create One-Click Order Entry Templates first!
Once you have created and successfully backtested an Alert Window, you can load it into our Brokerage Plus Module for automation. We heartily recommend testing any automated trading strategy in the simulator first.
Please note that trade automation is capped at 100 trades per day.
First, save your Alert Window to the cloud (right-click > Save or Share to Cloud). Then, open the Strategies Tab within Brokerage Plus by selecting New and then Strategies Tab.
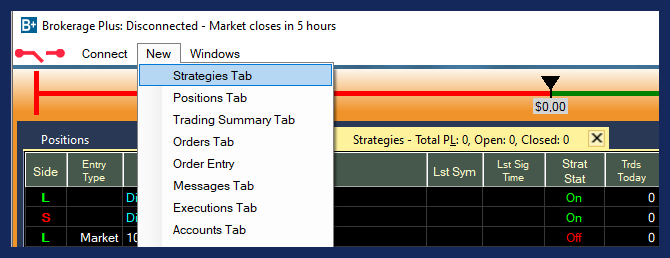
Right-click into the Strategies Tab Window and select Load from Cloud.
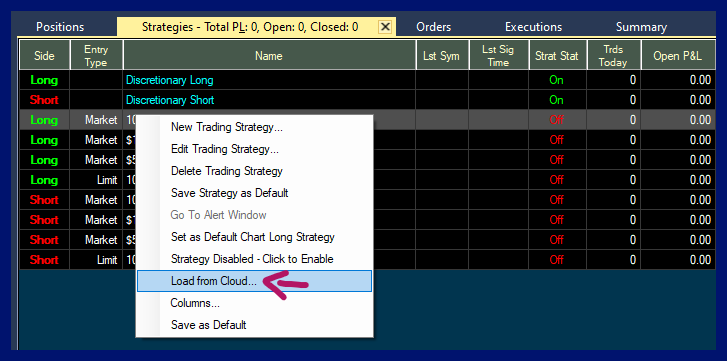
To find your saved Alert Window, enter its name in the search field, or scroll through the list. Then, highlight it and choose Load.

If you would like to add this Trading Strategy to an already existing list of strategies, select Add to Existing in the next window. To remove all other strategies, select Replace All Existing. To replace another strategy with this one, select Replace By Name. For this to work, you need to have an existing Trading Strategy that carries the exact same name.

Once your Alert Window is listed in the Strategies Tab of Brokerage Plus, highlight it, then right-click and select Edit Trading Strategy. This will open the Trading Strategy Configuration Window where you can make adjustments.
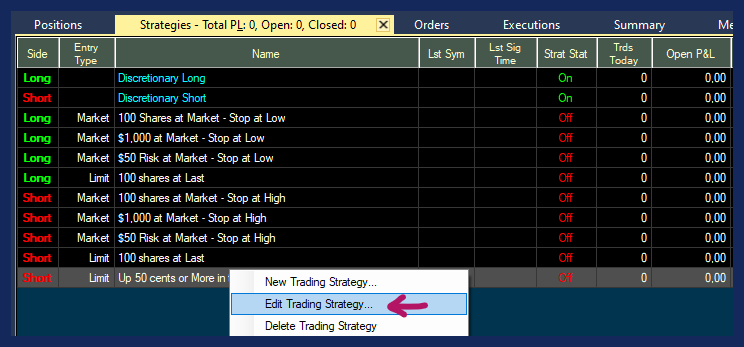
Configuration Tab
Give your Trading Strategy a new Name if you like and choose its Direction. If you would like to buy stocks using the template, select Long, if you would like to borrow stocks to sell, choose Short.
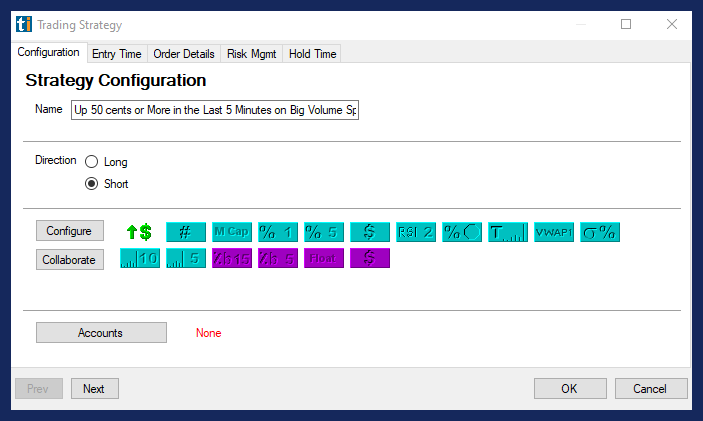
The field below displays icons of the alerts and filters that your Alert Window contains. To edit its setting, select Configure. This will open the Alert Config Window, where you can make your adjustments.

To replace the existing Alert Window with another one, use the Collaborate option. First, open the Alert Window you would like to use. Right-click into it, select Collaborate and then Copy All. Now you can use this Collaborate link in the Configuration Tab of your Trading Strategy. Simply press the Collaborate button, then paste the Collaboration Link into the field at the top and select OK. The icons will now display the alerts and filters of the newly added Alert Window. To make adjustments to its setting, press the Configure button.

Next, select Accounts and choose Accounts as Allocation Type. Then, select your trading account. This will either be our in-house simulator or your account at a participating brokerage. Please note, that you will have to connect to this account via the Connect Tab first for it to be displayed and ready to use.
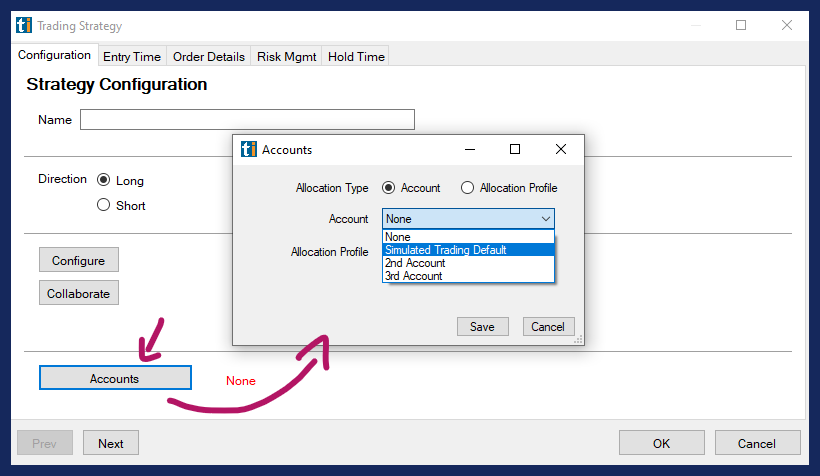
After choosing your account, hit Save.
The next steps follow the same process as outlined in B+ Basics. Some of the settings will automatically be imported from your backtest, but you can adjust them as you please.
Select OK once you have adjusted all your settings.
Enable Automation
To automate your Trading Strategy you will have to enable it every morning.
Highlight the strategy or strategies that you would like to enable for auto-trading then right-click and press the Enable Selected button at the bottom.

Please note, as a precaution, your Trading Strategies have to be newly enabled for automation every day, they will not stay enabled for longer than the current trading day and will also disable when the program is closed during the day.
Once executed, every trade will be displayed in the Positions Tab of Brokerage Plus
Any automation should always start with a test phase in a simulator. Our Brokerage Plus Module allows you to connect to our Trade Ideas Simulator, a participating Broker's Simulator, or a Live Account.
How to use Stop Limit and Stop Market Orders as Entry Orders
In B+ Basics we recommended using either a Limit or a Market Order as your Entry Order type, but there are two more options, a Stop Limit and a Stop Market Order.
The B+ Intermediate section will discuss these additional Entry Order options for One-Click Order Templates.
Stop Limit Orders Explained:
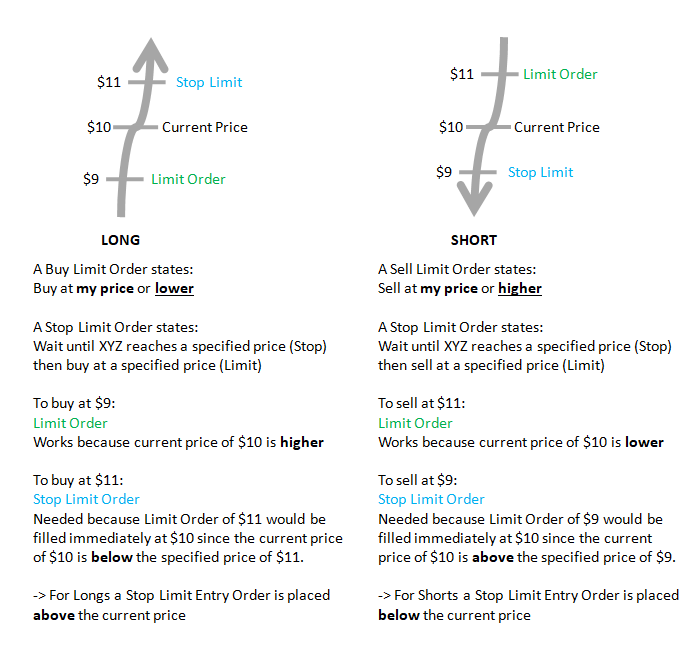
To use a Stop Limit or a Stop Market Order as One-Click Order Entry or a Custom Trading Strategy, right-click in the Strategies Tab of Brokerage Plus and choose New/Edit Trading Strategy. Then, head to the Entry Order Section of the Order Details Tab.
Order Details Tab
Here, you’ll have the option to choose your Entry Order Type.
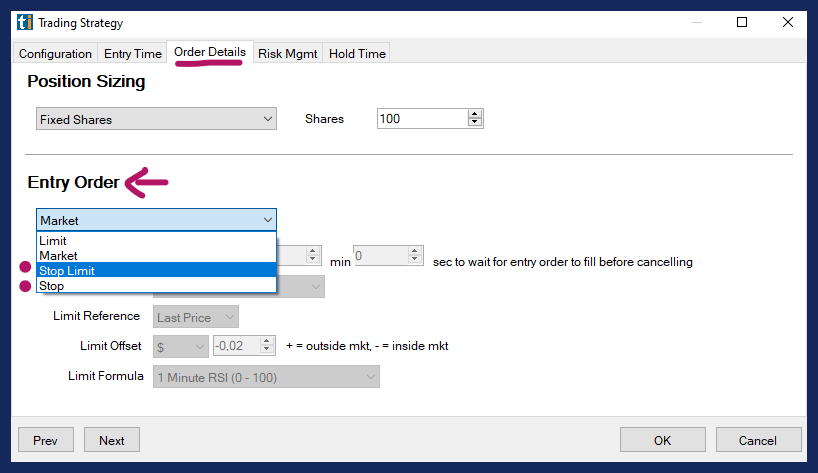
A Stop Limit Order is an order to buy or sell a stock that combines the features of a stop order and a limit order. Once the Stop Price is reached, a Stop Limit Order becomes a Limit Order that will be executed at a specified price or better.
A Stop Order is an order to buy or sell a stock once it reaches a specified price. When the Stop Price is reached, a Stop Order becomes a Market Order.
Stop Formula
When choosing a Stop Limit Order or Stop Order, you need to define the Stop Price at which the attached Limit Order or Market Order gets submitted.
To define the Stop Price, select a Trade Ideas Filter or your own Custom Formula from the Stop Formula dropdown.
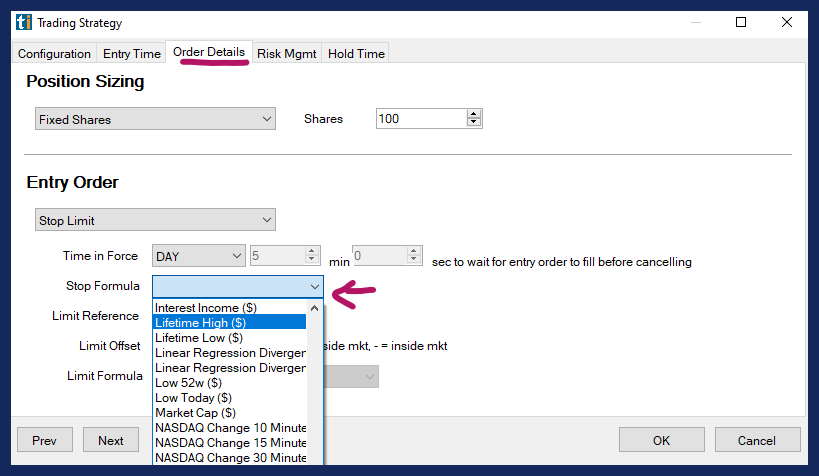
Please note, that the filter calculation needs to result in a static Dollar or Percentage Value.
Trade Ideas does not hold any orders, all orders are immediately sent to the brokerage. For this reason, orders cannot be based on a value that requires constant monitoring and recalculation like a moving average or a bar stop.
Limit Reference
When choosing a Limit or a Stop Limit Order, you have the option to either use the Last Price as Limit Reference or to use the Trade Ideas Filter or your own Custom Formula to define the Limit Price.
When Last Price is selected as Limit Reference, the system will use the price of the stock at the time of placement of the Stop Order.
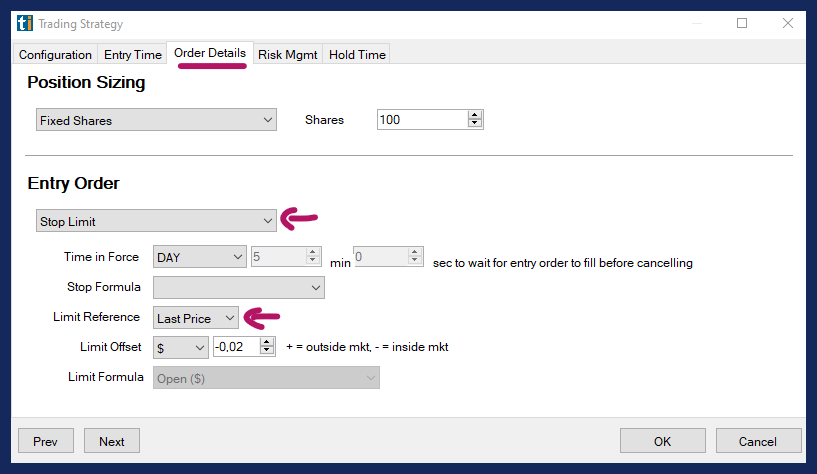
When using the Trade Ideas Filter or your own Custom Formula from the Limit Formula dropdown, please note that the filter calculation needs to result in a static Dollar or Percentage Value.
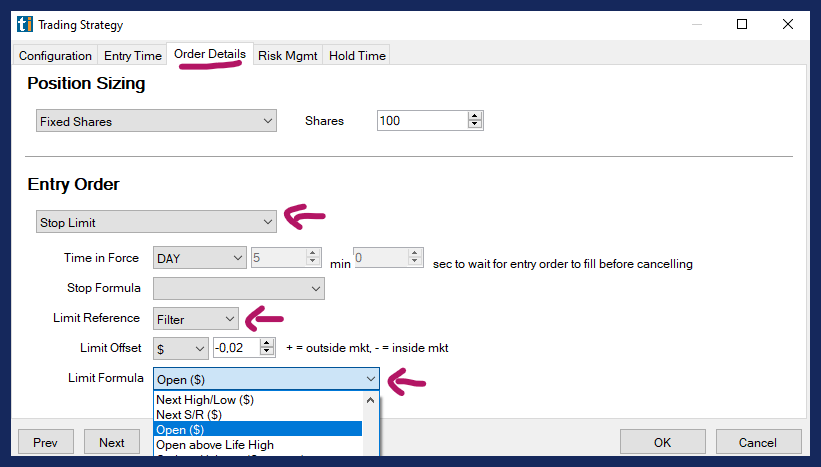
Trade Ideas does not hold any orders, all orders are immediately sent to the brokerage. For this reason, orders cannot be based on a value that requires constant monitoring and recalculation like a moving average or a bar stop.
Limit Offset
When placing a Limit Order or a Stop Limit Order, the Limit Offset gives you the ability to control how aggressive or passive your Limit Order will be, it simply allows a bit of wiggle room. If you set the Limit Offset to 0, you are stating that your limit price for the order will be the exact price.

If you enter a negative Limit Offset, like - $0.02, you are prepared to pay up to 2 cents more per share (long) or 2 cents less (short). This approach is best for prioritizing the likelihood of being filled over a rigid price level.
If you enter a positive Limit Offset, like $0.01, you are waiting for the price of the stock to become 1 cent “cheaper” (long) or 1 cent higher (short). You are stating that you are prepared to wait for the stock price to move in your direction, rather than to pay a little extra to get in easier or quicker.
Please note, these rules are the same for long and short orders. With a negative Limit Offset you are willing to lose some profit potential in an effort to get filled, with a positive Offset you are stating that you'll wait for the price to come to you, even if that means a lower possibility of being filled.
Please note, if you have chosen a Filter as your Limit Reference, the Limit Offset will be disabled.
Overview Use of Filters in Orders
As Entry Orders (Limit/Stop Limit)
| L/S | Order Type | Filter Reference | Filter Example | Filter Application | Result |
| Long | Stop Limit | Stop Formula | Today’s High $8 | Exact Filter Value in $ | Stop is placed at $8 |
| Long | Stop Limit | Limit Formula | Today’s High $8 | Price - Filter | If Price is $10 and Filter is $8 Limit = $2 |
| Short | Stop Limit | Stop Formula | Today’s Low $5 | Exact Filter Value in $ | Stop is placed at $5 |
| Short | Stop Limit | Limit Formula | Today’s Low $5 | Price + Filter | If Price is $10 and Filter is $8 Limit = $18 |
As Exit Orders (Stop Loss/Target/Trailing Stop)
| L/S | Order Type | Exit Type | Filter Example | Filter Application | Result |
| Long | Limit | Target | Today’s High $8 | Price + Filter | If Price is $6 and Filter is $8 Target = $14 |
| Long | Stop Market | Stop Loss | Today’s Low $4 | Price - Filter | If Price is $6 and Filter is $4 Stop Loss = $2 |
| Long | Stop Market | Trailing Stop | Today’s Low $6 | Price - Filter |
If Price is $10 and Filter is $6 Trailing Stop = $4 |
| Short | Limit | Target | Today’s Low $6 | Price - Filter | If Price is $10 and Filter is $6 Target = $4 |
| Short | Stop Market | Stop Loss | Today’s High $12 | Price + Filter | If Price is $10 and Filter is $8 Stop Loss = $18 |
| Short | Stop Market | Trailing Stop | Today’s High $8 | Price + Filter | If Price is $10 and Filter is $8 Trailing Stop = $18 |
How to use Filters & Custom Formulas for Exit Orders
To use Trade Ideas Filters and Custom Formulas for Exit Orders, right-click in the Strategies Tab of Brokerage Plus and choose New/Edit Trading Strategy. Then, head to the Risk Management Section.
Risk Management Tab
Here, you’ll have the option to choose a Stop Loss or Trailing Stop and a Target.
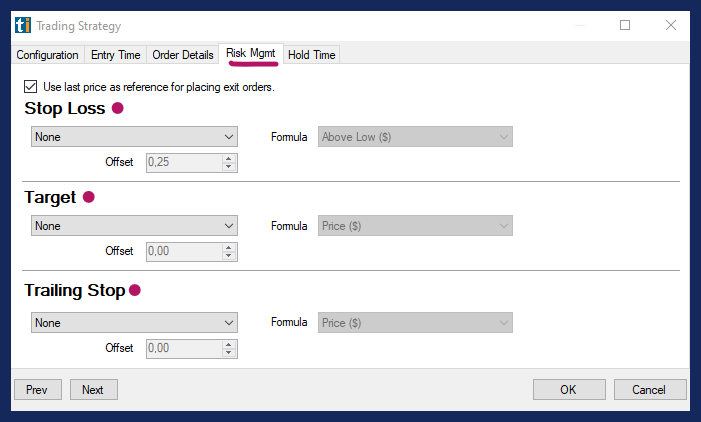
Your options are to define your Stop and Target in Dollars, in Percent, or with the help of a Filter.
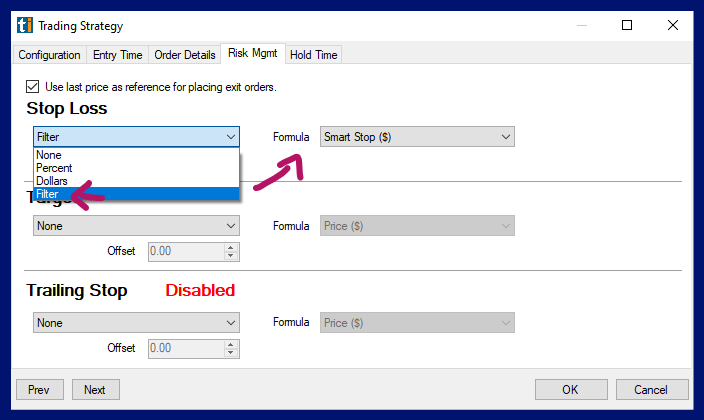
Trade Ideas does not hold any orders, all orders are immediately sent to the brokerage. For this reason, orders cannot be based on a value that requires constant monitoring and recalculation like a moving average or a bar stop.
Filter as Stop Loss
When using a Filter or Custom Formula as a Stop Loss, please note the following:
The calculation needs to result in a static Dollar/Percent Value
The filter value will be subtracted from the Price for Long Trades
Stop Loss = Price - Filter
The filter value will be added to the Price for Short Trades
Stop Loss = Price + Filter
Filter as Target
When using a Filter or Custom Formula as a Target, please note the following:
The calculation needs to result in a static Dollar/Percent Value
The filter value will be added to the Price for Long Trades:
Target = Price + Filter
The filter value will be subtracted from the Price for Short Trades:
Target = Price - Filter
Overview Use of Filters in Orders
As Entry Orders (Limit/Stop Limit)
| L/S | Order Type | Filter Reference | Filter Example | Filter Application | Result |
| Long | Stop Limit | Stop Formula | Today’s High $8 | Exact Filter Value in $ | Stop is placed at $8 |
| Long | Stop Limit | Limit Formula | Today’s High $8 | Price - Filter | If Price is $10 and Filter is $8 Limit = $2 |
| Short | Stop Limit | Stop Formula | Today’s Low $5 | Exact Filter Value in $ | Stop is placed at $5 |
| Short | Stop Limit | Limit Formula | Today’s Low $5 | Price + Filter | If Price is $10 and Filter is $8 Limit = $18 |
As Exit Orders (Stop Loss/Target/Trailing Stop)
| L/S | Order Type | Exit Type | Filter Example | Filter Application | Result |
| Long | Limit | Target | Today’s High $8 | Price + Filter | If Price is $6 and Filter is $8 Target = $14 |
| Long | Stop Market | Stop Loss | Today’s Low $4 | Price - Filter | If Price is $6 and Filter is $4 Stop Loss = $2 |
| Long | Stop Market | Trailing Stop | Today’s Low $6 | Price - Filter |
If Price is $10 and Filter is $6 Trailing Stop = $4 |
| Short | Limit | Target | Today’s Low $6 | Price - Filter | If Price is $10 and Filter is $6 Target = $4 |
| Short | Stop Market | Stop Loss | Today’s High $12 | Price + Filter | If Price is $10 and Filter is $8 Stop Loss = $18 |
| Short | Stop Market | Trailing Stop | Today’s High $8 | Price + Filter | If Price is $10 and Filter is $8 Trailing Stop = $18 |
Edit Trading Strategy
To edit an existing Trading Strategy, highlight it, then right-click and select Edit Trading Strategy. This will bring up the Trading Strategy Configuration Menu where you can make adjustments.
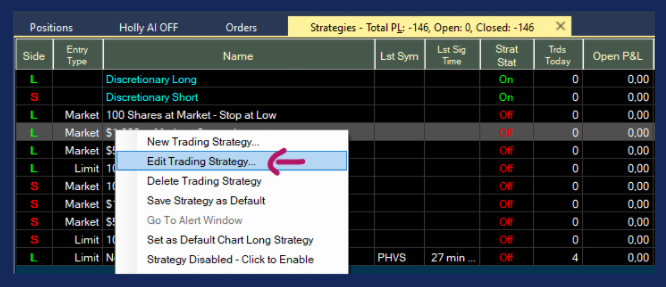
Delete Trading Strategy
To delete an existing Trading Strategy/Entry Order Template, highlight it, then right-click and select Delete Trading Strategy.
This will bring up the Delete Strategy Confirmation Window. Select Yes to delete and No to cancel the deletion.
Alternatively, highlight a Strategy, then select the Delete Selected button at the bottom of the Strategies Tab.
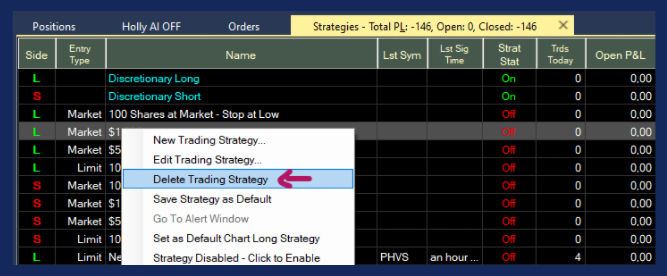
Save Strategy as Default
You can save a strategy as the default version by right-clicking and choosing Save As Default.
Whenever you now create a new One-Click Order Template or Trading Strategy via right-click into the Strategies Tab and selecting New Trading Strategy, the configuration of your default strategy will load.
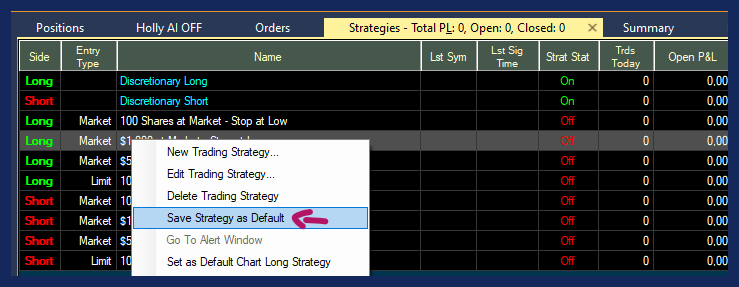
Go To Alert Window
If your Trading Strategy is based on an Alert Window, you can open the underlying Alert Window by right-clicking on the Trading Strategy and selecting Go to Alert Window.
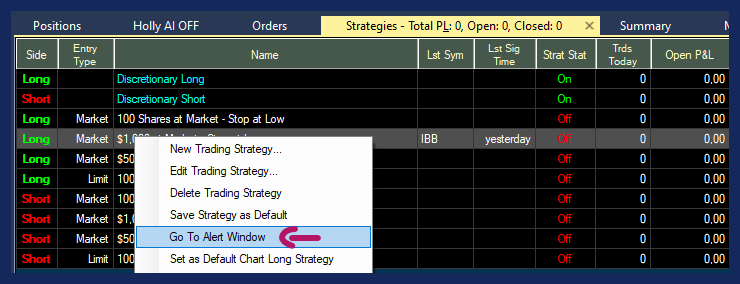
Set as Default Chart Long/Short Strategy
In addition to the One-Click Trading Feature, you can also trade directly from a chart by using the Buy & Sell Icons in the top left-hand corner of the Chart Window.
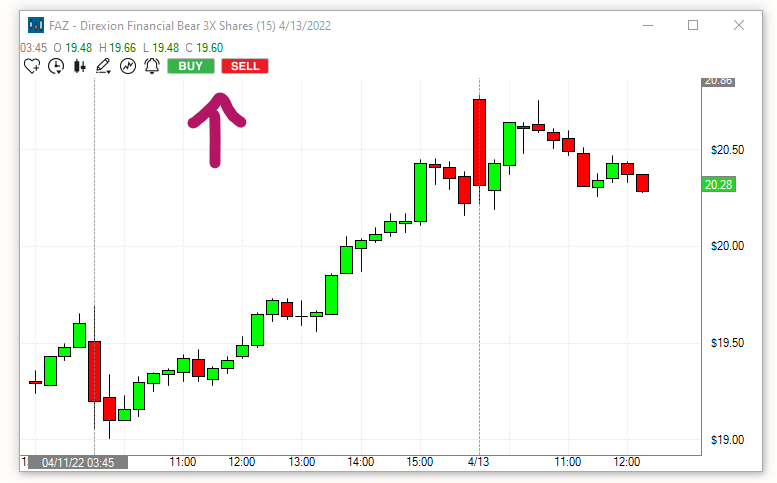
In order to use these icons, you first have to set up your Default Chart Long Strategy and your Default Chart Short Strategy in the Brokerage Plus Module.
If you have already set up a One-Click Order Entry Template or would like to use one of the Preset One-Click Order Entry Templates as your default Chart Trading Strategy, follow these steps.
-
Open the Brokerage Plus Module Learn More
-
Connect to your Brokerage Account or Simulator Learn more
-
Head to the Strategies Tab
-
Highlight the Trading Strategy you would like to use
-
Right-click and check Default Chart Long Strategy or Default Chart Short Strategy.

If you would like to apply personalized Stops and Targets to your Chart Order and have not yet set up a One-Click Order Entry Template, follow the steps in this section first.
To trade via the Chart Buy and Sell Icons, follow these simple steps:
-
Click once on either the Buy or the Sell Icon
-
Your cursor will now show a cross
-
Move your cursor cross to the price level in the chart at which you would like to buy/short the stock
-
Click into the chart
Your Default Chart Long Strategy or Default Chart Short Strategy will now automatically be applied.
Your order will be sent directly to your brokerage/simulator with the configured Entry and Exit parameters.
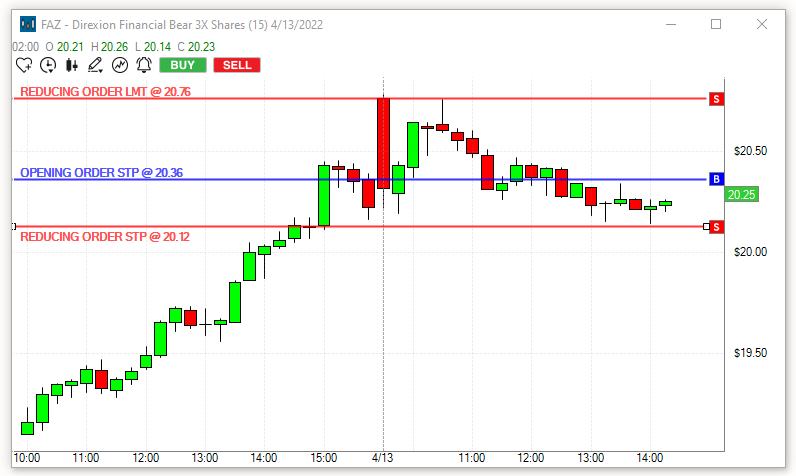
A blue line will indicate your Opening Order Level, a red line will indicate your Stop Loss Level, and a red line will indicate your Target Price.
Once your order is filled, the blue line will disappear and the projected Loss and Profit in Dollars will be displayed at the Target and Stop Loss line.
All orders can be adjusted directly on the charts by moving the lines via drag & drop with your mouse.
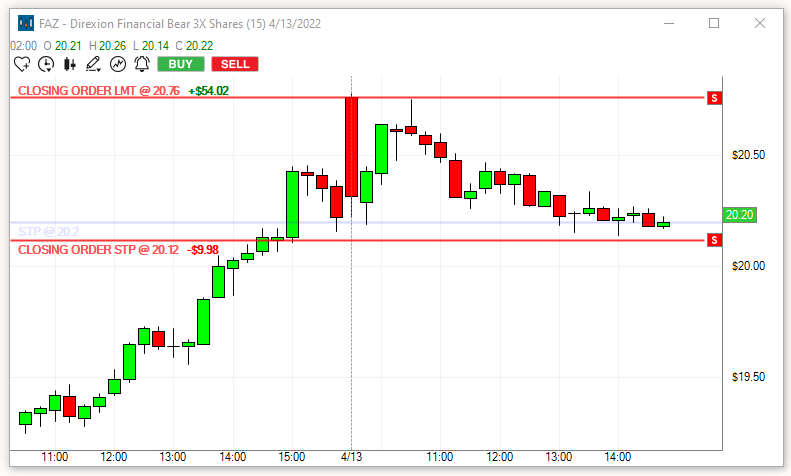
Your trade will also be displayed in the Positions Tab of Brokerage Plus. Whenever you adjust the Target or Stop, by moving the line on the chart, it will automatically be updated in Brokerage Plus as well.
Troubleshooting Tip:
If your Buy and Sell Chart Icons are ready to be used, they will be green/red.
If the Buy and/or Sell Icons are greyed out, you are either not connected to your Brokerage/Simulator or have not enabled a strategy as your Default Chart Long Strategy and/or Default Chart Short Strategy.
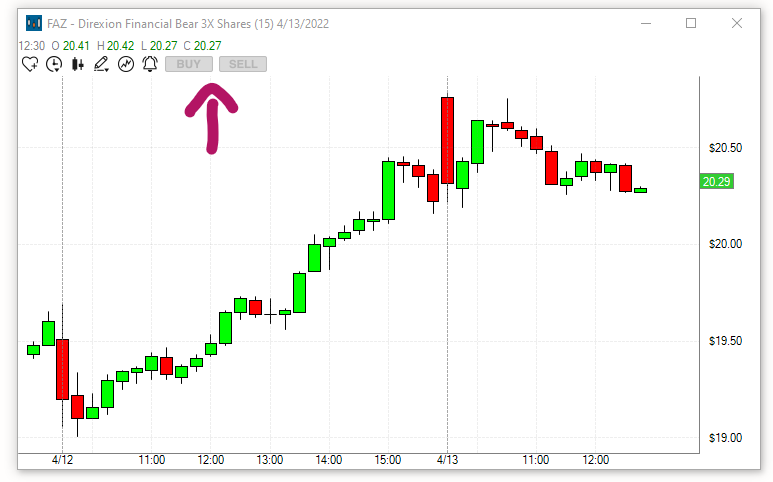
Automation - Strategy Disabled/Enabled
To automate your Trading Strategy you will have to enable it every morning. As a precaution, they will not stay enabled for longer than the current trading day and will also disable when the program is closed during the day.
Highlight the strategy or strategies that you would like to enable for auto-trading then right-click and select Strategy Disabled - Click to Enable. Alternatively, press the Enable Selected button at the bottom of the Brokerage Plus Window.
To disable an automated Trading Strategy, highlight it, then right-click and select Strategy Enabled - Click to Disable. Alternatively, press the Disable Selected button at the bottom of the Brokerage Plus Window.
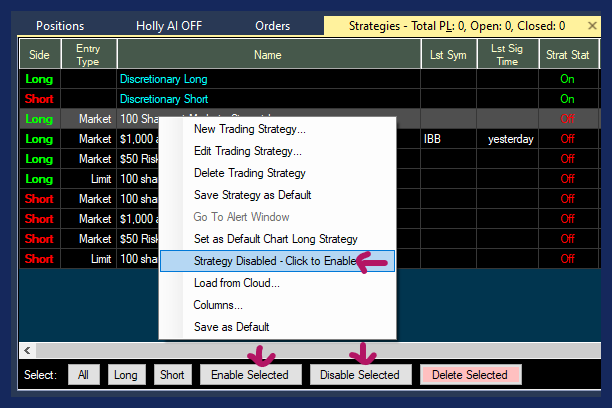
Load from Cloud
Once you have created and successfully backtested an Alert Window, you can load it into our Brokerage Plus Module for automation. We heartily recommend testing any automated trading strategy in the simulator first.
Please read the previous section on how to create One-Click Order Entry Templates first!
First, save your Alert Window to the cloud (right-click > Save or Share to Cloud). Then, open the Strategies Tab within Brokerage Plus by selecting New and then Strategies Tab.

Right-click into the Strategies Tab Window and select Load from Cloud.

To find your saved Alert Window, enter its name in the search field, or scroll through the list. Then, highlight it and choose Load.
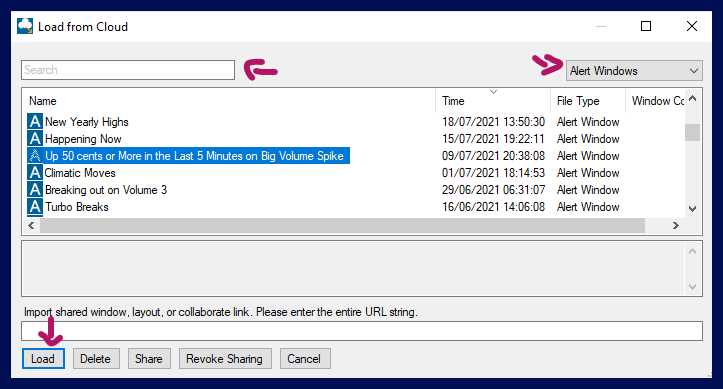
If you would like to add this Trading Strategy to an already existing list of strategies, select Add to Existing in the next window. To remove all other strategies, select Replace All Existing. To replace another strategy with this one, select Replace By Name. For this to work, you need to have an existing Trading Strategy that carries the exact same name.
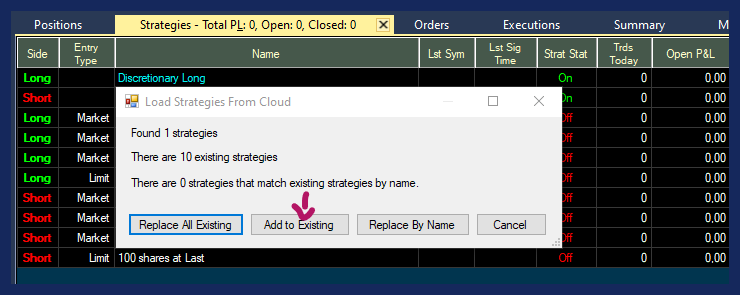
Once your Alert Window is listed in the Strategies Tab of Brokerage Plus, highlight it, then right-click and select Edit Trading Strategy. This will open the Trading Strategy Configuration Window where you can make adjustments.

Configuration Tab
Give your Trading Strategy a new Name if you like and choose its Direction. If you would like to buy stocks using the template, select Long, if you would like to borrow stocks to sell, choose Short.

The field below displays icons of the alerts and filters that your Alert Window contains. To edit its setting, select Configure. This will open the Alert Config Window, where you can make your adjustments.
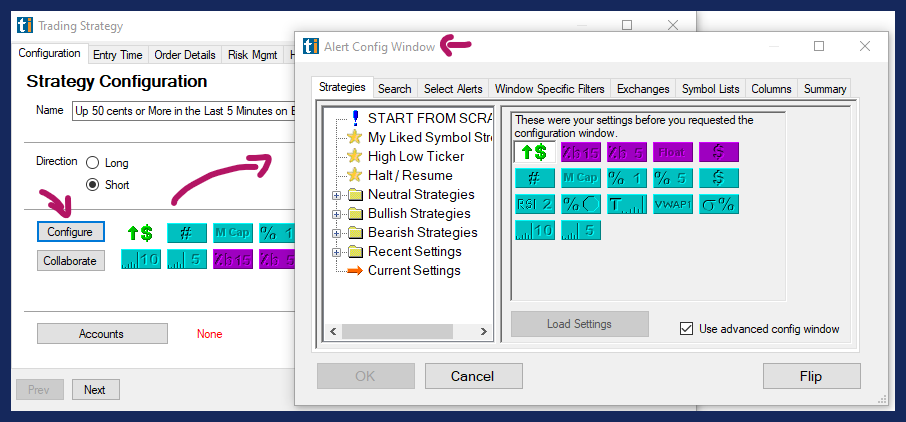
To replace the existing Alert Window with another one, use the Collaborate option. First, open the Alert Window you would like to use. Right-click into it, select Collaborate and then Copy All. Now you can use this Collaborate link in the Configuration Tab of your Trading Strategy. Simply press the Collaborate button, then paste the Collaboration Link into the field at the top and select OK. The icons will now display the alerts and filters of the newly added Alert Window. To make adjustments to its setting, press the Configure button.
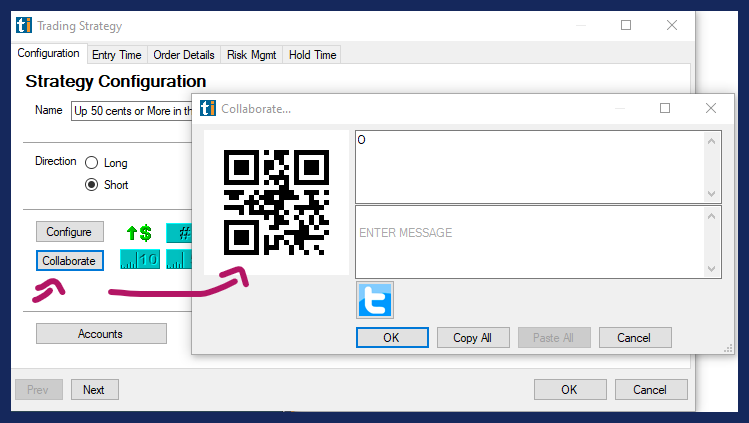
Next, select Accounts and choose Accounts as Allocation Type. Then, select your trading account. This will either be our in-house simulator or your account at a participating brokerage. Please note, that you will have to connect to this account via the Connect Tab first for it to be displayed and ready to use.

After choosing your account, hit Save.
The next steps follow the same process as outlined in B+ Basics. Some of the settings will automatically be imported from your backtest, but you can adjust them as you please.
Select OK once you have adjusted all your settings.
Enable Automation
To automate your Trading Strategy you will have to enable it every morning.
Highlight the strategy or strategies that you would like to enable for auto-trading then right-click and press the Enable Selected button at the bottom.
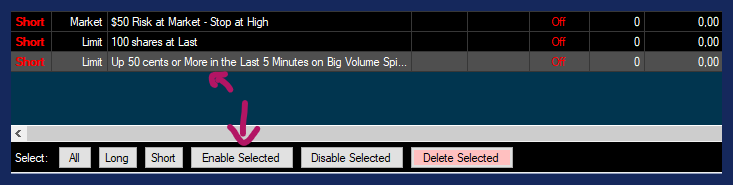
Please note, as a precaution, your Trading Strategies have to be newly enabled for automation every day, they will not stay enabled for longer than the current trading day and will also disable when the program is closed during the day.
Once executed, every trade will be displayed in the Positions Tab of Brokerage Plus
Any automation should always start with a test phase in a simulator. Our Brokerage Plus Module allows you to connect to our Trade Ideas Simulator, a participating Broker's Simulator, or a Live Account.
Columns
The columns of the Strategies Tab can be reorganized via drag and drop with your mouse. The individual columns can also be extended or compressed by using your mouse. To sort the data by a column, double-click on the column header.
To add more columns right-click into the Strategies Tab field and select Columns.
The left-hand side shows the already listed columns, the right-hand side shows the columns that can be added.
Select additional columns by highlighting them with a left mouse click.
Click the arrow pointing to the left to move them to the Selected Columns field.
To remove any of the already selected columns, highlight the column, then click the arrow pointing to the right.
Click OK when you are done.
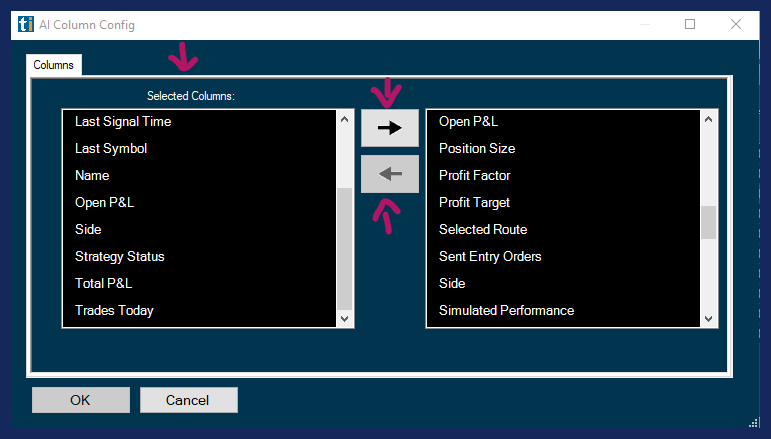
Save as Default
If you have changed the column order or added/deleted strategies to your Strategies Tab, you can save this configuration as the default version by right-clicking and choosing Save As Default.
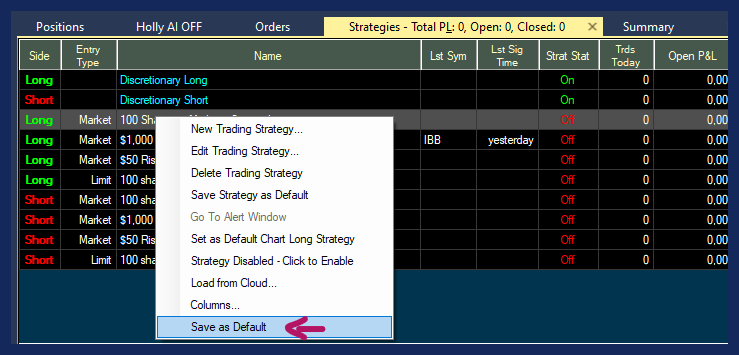
Select Buttons
You will find six buttons at the bottom of the Strategies Tab.
-
All will highlight all Strategies.
-
Long will highlight all Long Strategies.
-
Short will highlight all Short Strategies.
-
Enable Selected will enable automation for the selected strategies.
-
Disable Selected will disable automation for the selected strategies.
-
Delete Selected will bring up a Deletion Confirmation Window, select Yes to delete and No to abort the deletion of the selected strategies.
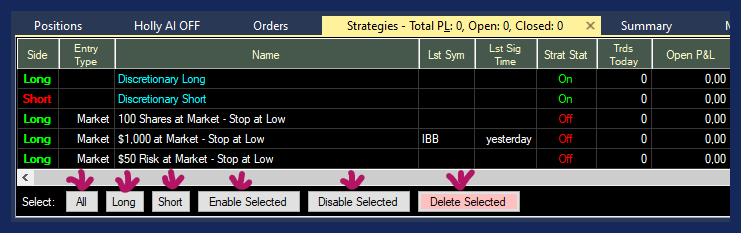
Positions Tab
Once executed, your trades will be displayed in the Positions Tab of the Brokerage Plus Module, where you can monitor and modify them.
To change the parameters of any of your positions, highlight it, then right-click.
This will bring up a dropdown menu with various options.
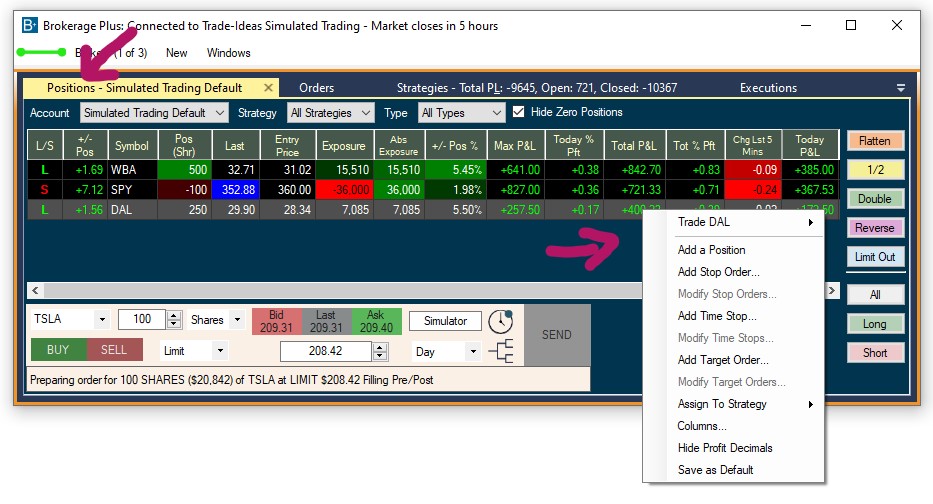
Trade XYZ
To place another trade for the same stock, highlight your position, then right-click and select Trade.
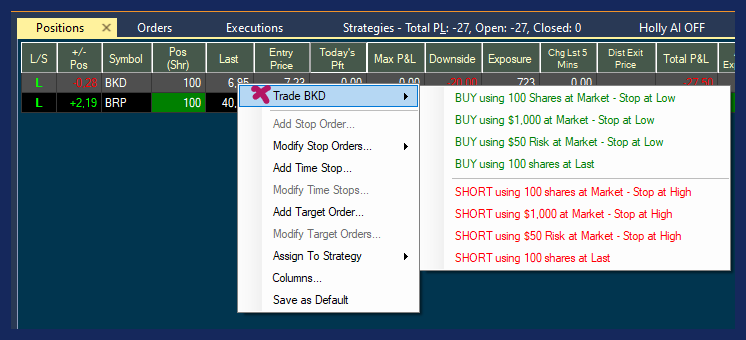
Thereafter, choose a One-Click Order Template or Trading Strategy to apply.
How to create a custom Order Entry Template:
Add a Position
The Add a Position function enables you to add already existing positions that you might have in an external brokerage account to the Position Tab of our in-house simulator for easy monitoring.
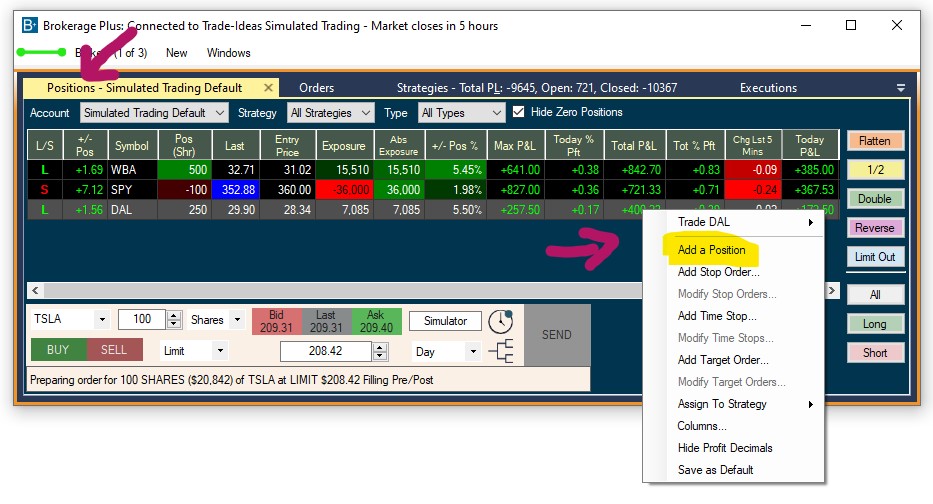
To add a new position, follow these steps:
- Connect to our in-house Simulator
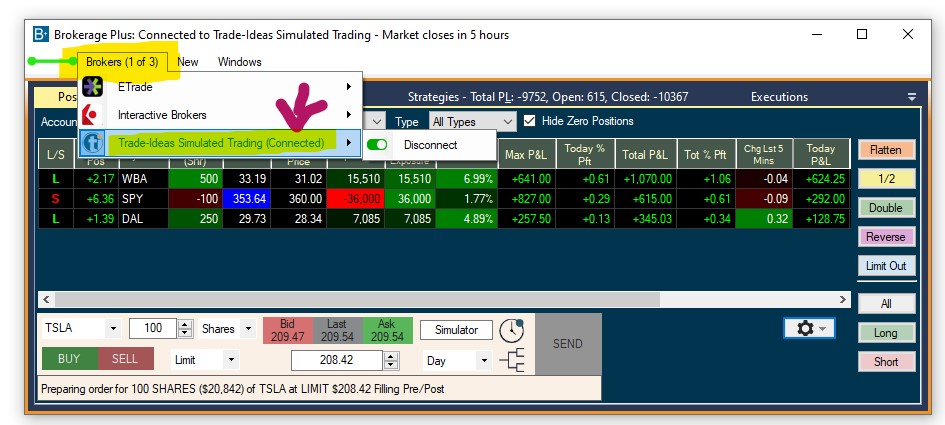
-
Open the Positions Tab
If you cannot see the newly opened Positions Tab, click the small arrow on the right-hand side, which will list all already open tabs.
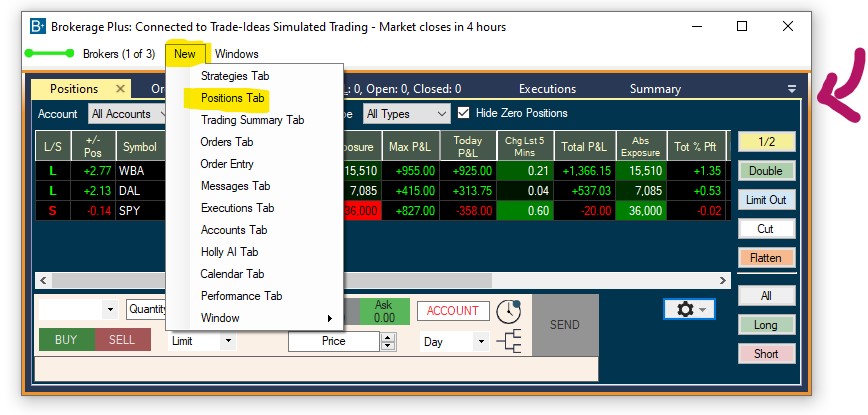
- Right-click into the Position Tab and select Add a Position
-
Enter your Trade Details
The Symbol, the Direction of your trade (long/short), the Entry Price as well as Entry Date and Time and the Number of Shares. Lastly, select one of your simulated Accounts from the dropdown, and click Save.
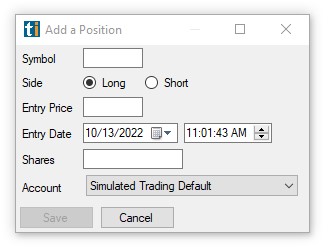
Your newly added position will now be displayed in the Positions Tab just like all other actively entered trades, enabling you to keep track of positions that you've already held for some time - perhaps even years.
Add Stop Order
To add a Stop Loss to your trade, highlight your position, then right-click and select Add Stop Order. Thereafter, choose a value for your Stop Loss. The newly added Stop Loss will be displayed in a column in the Positions Tab as well as on the chart of the stock as a line including the projected loss value.
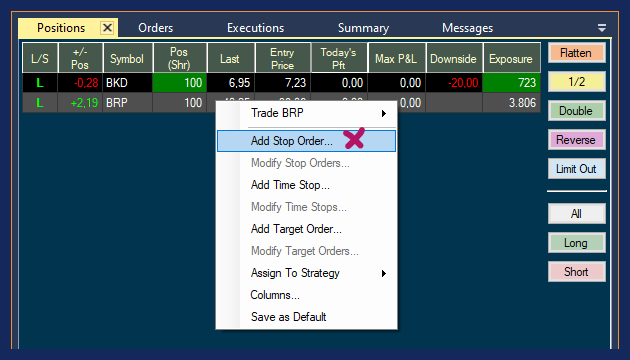
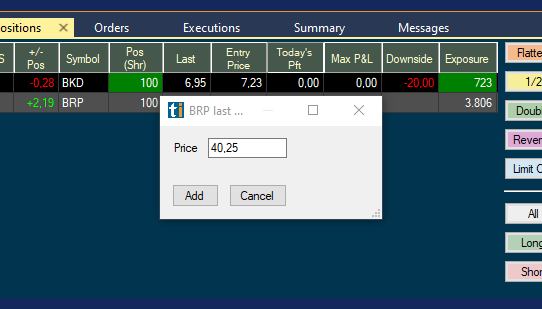
Modify Stop Order
To adjust an already placed Stop Loss, highlight your position, then right-click and select Modify Stop Order. Thereafter, choose a preset value for your Stop Loss or enter an exact price. Alternatively, you can move your Stop Loss, which is displayed as a line on your chart including the projected loss value, right on the chart.
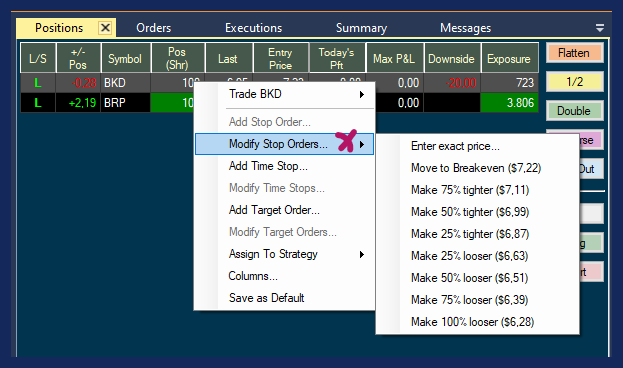
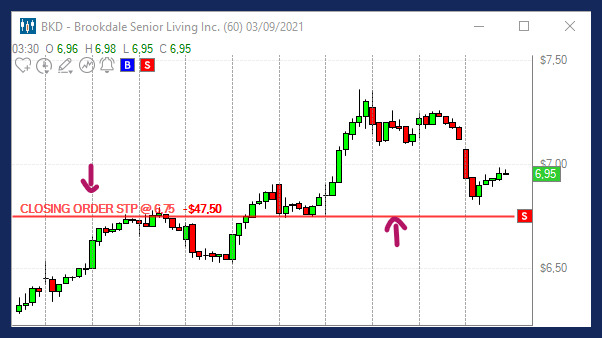
Add Time Stop
To add a Time Stop to your trade, highlight your position, then right-click and select Add Time Stop. Thereafter, choose a time.
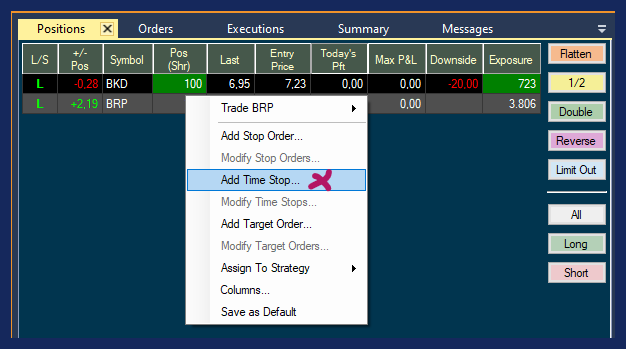
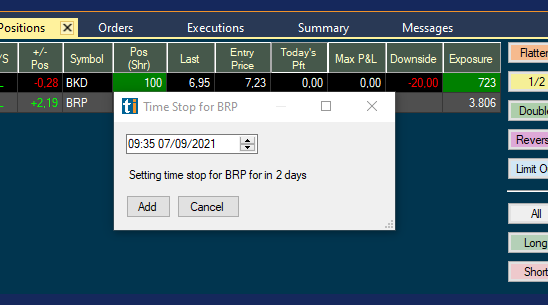
Modify Time Stop
To modify a Time Stop, highlight your position, then right-click and select Modify Time Stop. Thereafter, choose a time.
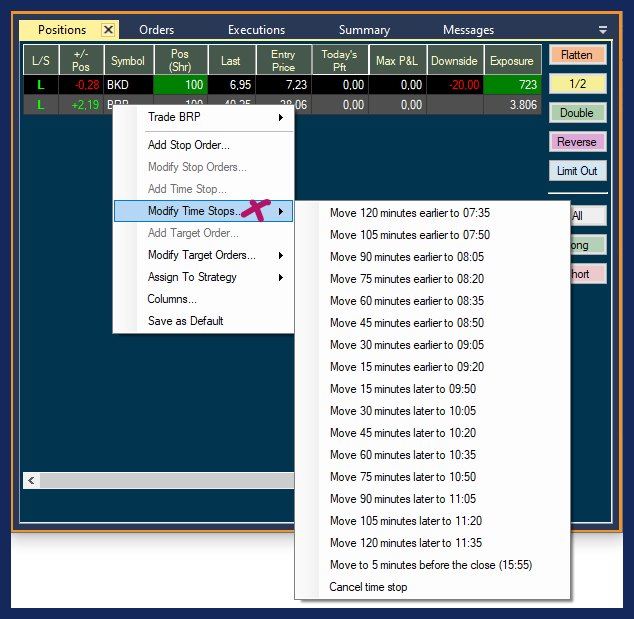
Add Target Order
To add a Target Order to your trade, highlight your position, then right-click and select Add Add Target Order. Thereafter, choose a value. The newly added Target Order will be displayed in a column in the Positions Tab as well as on the chart of the stock as a line together with the projected profit value.
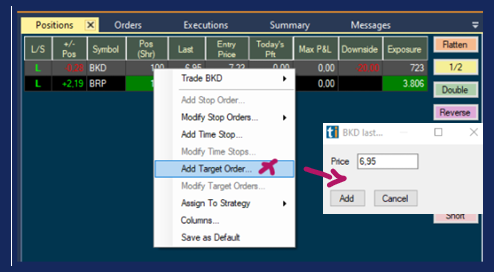
Modify Target Order
To adjust an already placed Target Order, highlight your position, then right-click and select Modify Target Order. Thereafter, choose a preset value. Alternatively, you can move your Target Order, which is displayed as a line on your chart together with the projected profit value, right on the chart.
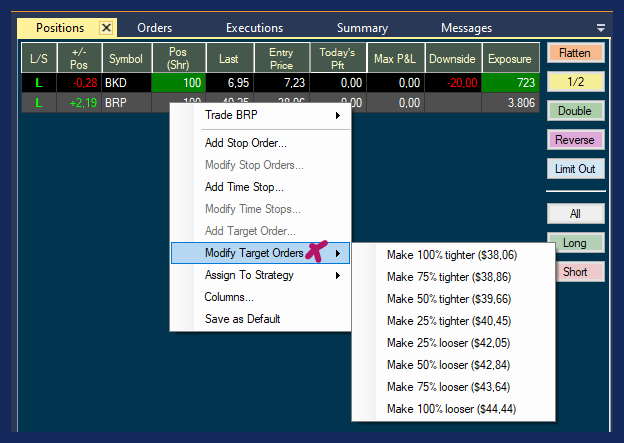
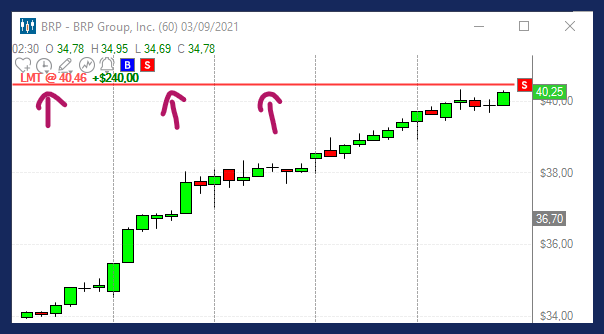
Assign to Strategy
To assign your position to a specific strategy for filtering purposes, highlight your position, then right-click and select Assign to Strategy. Thereafter, select the strategy you would like to assign this trade to. Once a trade is assigned, it will show up when the Strategy Filter, which can be enabled/disabled via the Gear Icon is set to show that strategy.
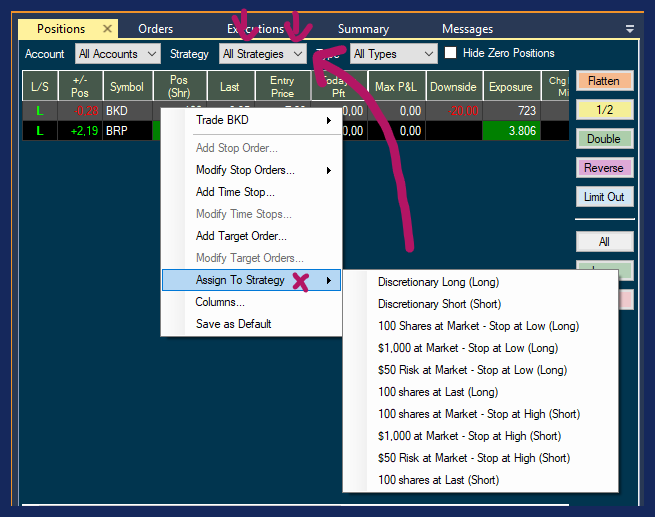
Columns
The columns of the Positions Tab can be reorganized via drag and drop with your mouse. The individual columns can also be extended or compressed by using your mouse. To sort the data by a column, double-click on the column header.
To add more columns right-click into the Positions Tab field and select Columns.
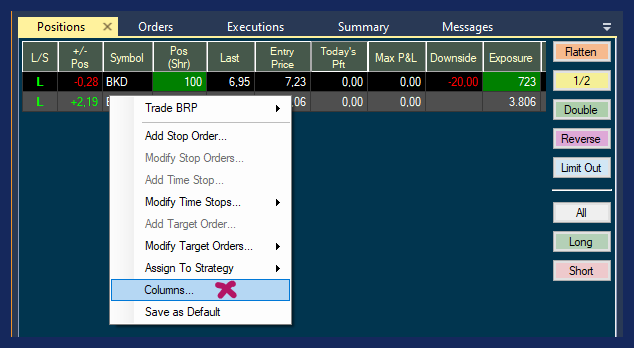
The left-hand side shows the already listed columns, the right-hand side shows the columns that can be added.
Select additional columns by highlighting them with a left mouse click.
Click the arrow pointing to the left to move them to the Selected Columns field.
To remove any of the already selected columns, highlight the column, then click the arrow pointing to the right.
Click OK when you are done.

Hide Profit Decimals
The Hide Profit Decimals function of the Positions Tab allows you to remove the decimals from the various Profit & Loss columns, enabling a smoother and easier to monitor P&L display.
To hide the decimals, right-click into the Positions Tab and select Hide Profit Decimals
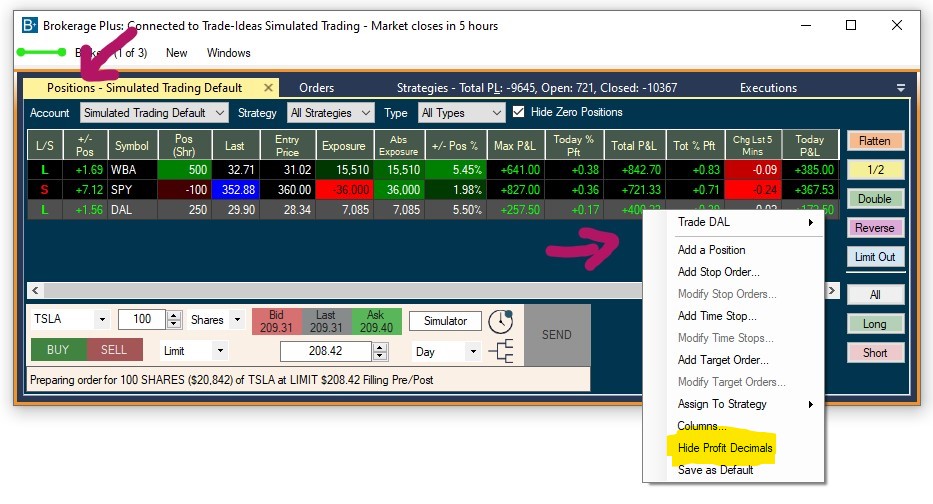
P&L columns with decimals
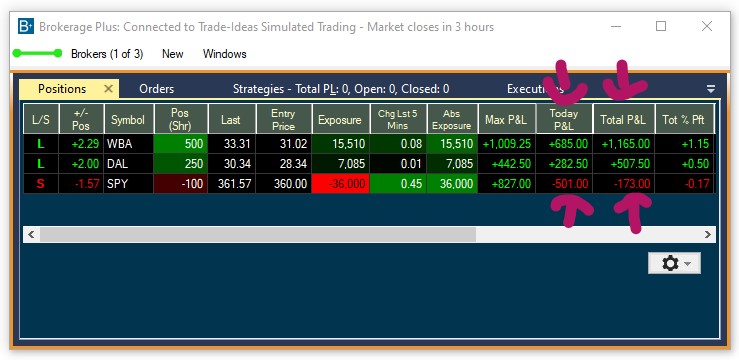
P&L columns without decimals
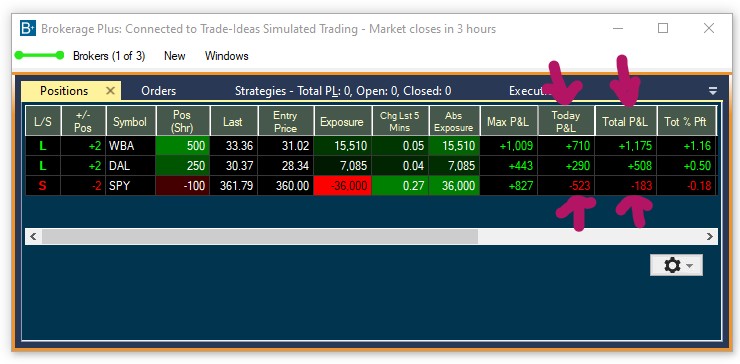
Save as Default
If you have changed the column order or filter settings of your Positions Tab, you can save this configuration as the default version of the Positions Tab by right-clicking and choosing Save As Default.
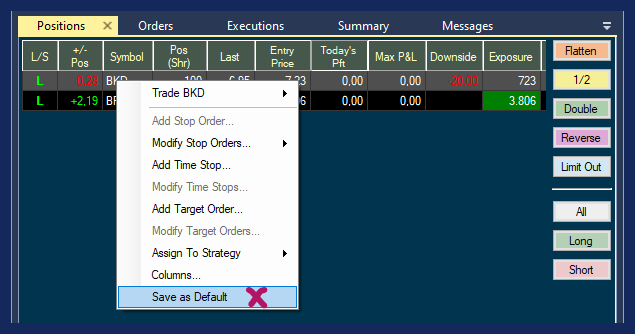
Symbol Plus Column
The Symbol Plus Feature enables our users to condense some of the stock's key data into one single column.
It is available in Alert, Top List and Multi-Strategy Windows, as well as in the Premium AI Strategy Trades Window and the Brokerage Plus Positions Tab.
To enable Symbol Plus in the Brokerage Plus Position Tab, right-click on a stock symbol in the Symbol column and select Symbol Plus.
A drop-down with the following options will appear:
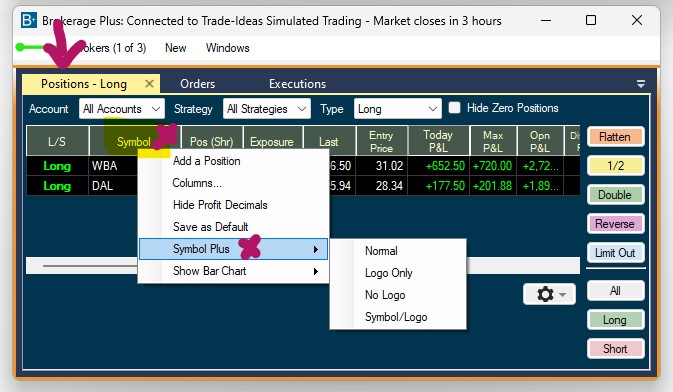
The option Normal will display the following info in the symbol column:
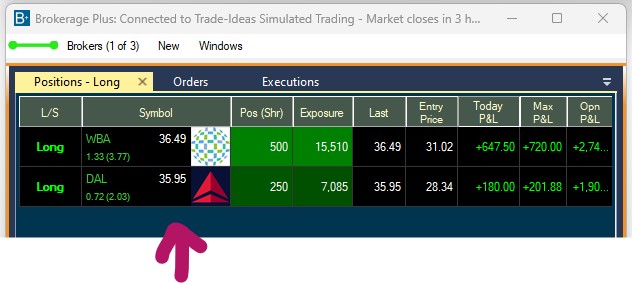
-
The company's symbol
-
The stock's current price
-
The Change from the Close in $
-
The Change from the Close in %
-
The company's logo

The option Logo Only will display the following way:
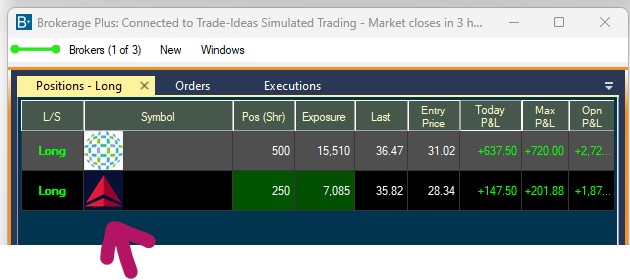
The option No Logo will display the following info in the symbol column:
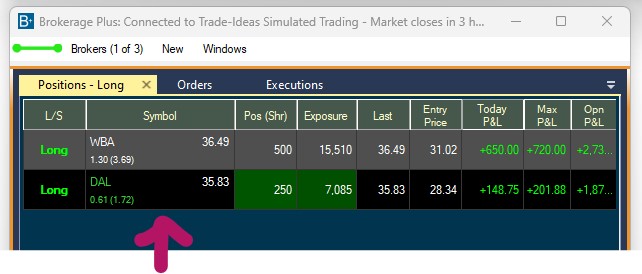
The option Symbol/Logo will display the following info in the symbol column:
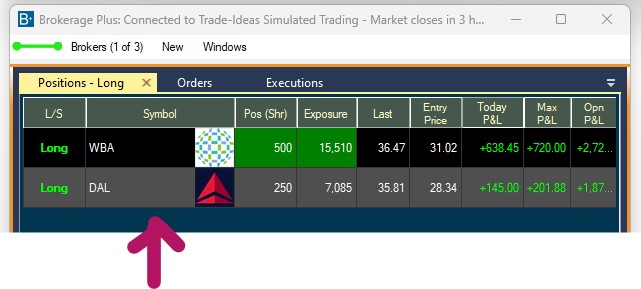
The option Off will show the traditional symbol column.
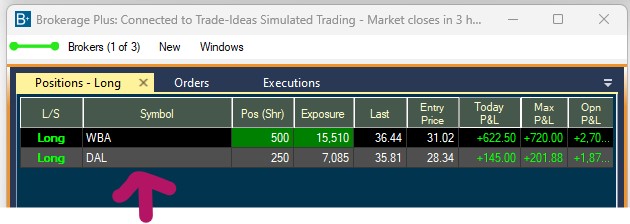
Show Bar Chart
By default, the Positions Tab displays your trades in grid view.
The Show Bar Chart option enables you to display the performance of your positions in a vertical or horizontal bar chart instead.
To enable this option, right-click into the Positions Tab and place a check mark at Show Bar Chart:
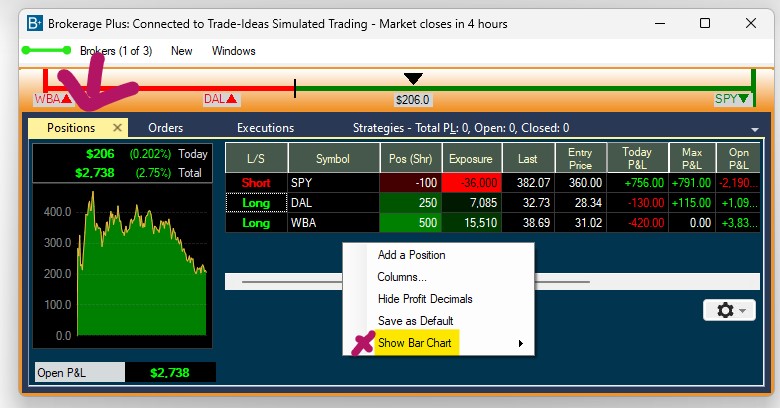
Opening the Positions Tab in a separate grid window instead of a tab, as shown in the image below, will provide the best viewing experience:
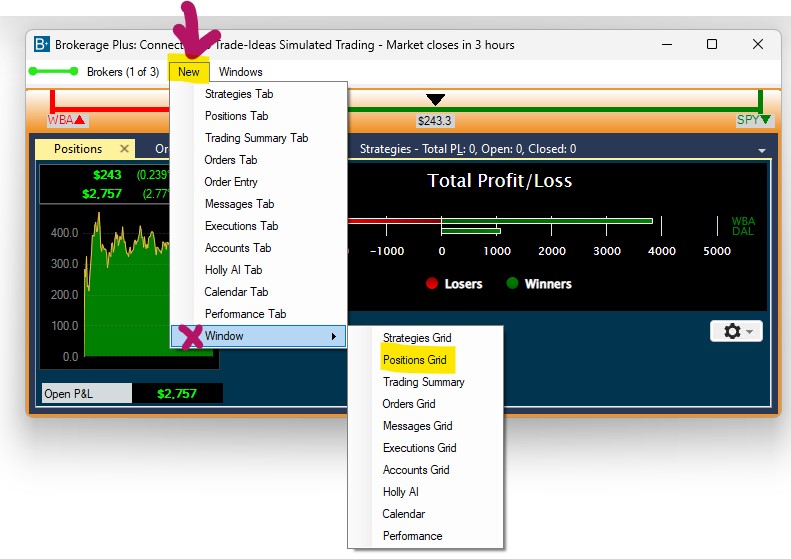
Horizontal Bars:
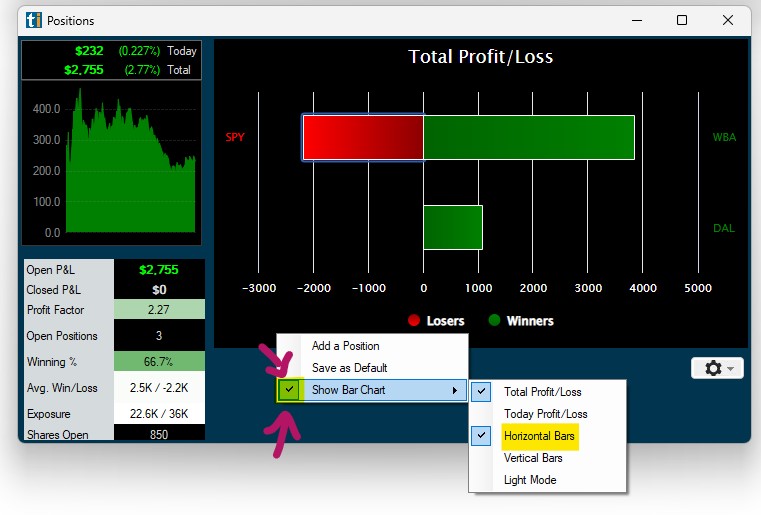
The two trades currently incurring the largest loss and the largest gain are displayed at the top.
Trades that are currently losing/negative are displayed on the left-hand side in red.
Trades that are currently winning/positive are displayed on the right-hand side in green.
Vertical Bars:
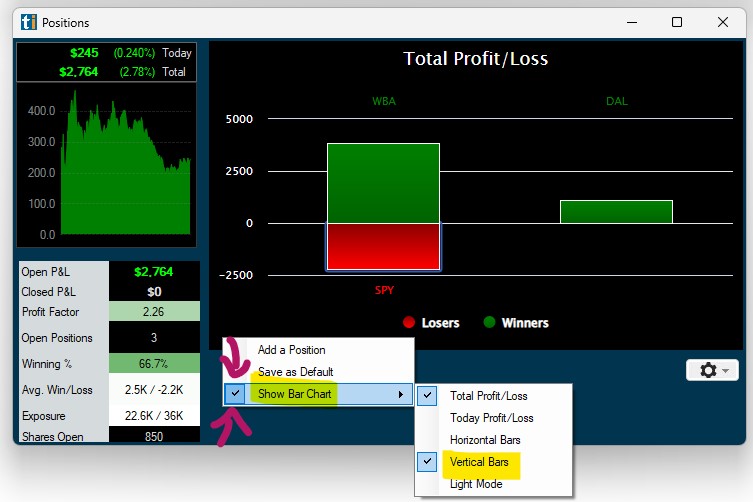
The two trades currently incurring the largest loss and the largest gain are displayed on the left-hand side.
Trades that are currently losing/negative are displayed below the zero line in red.
Trades that are currently winning/positive are displayed above the zero line in green.
Hovering over a position with your cursor will reveal the following details:
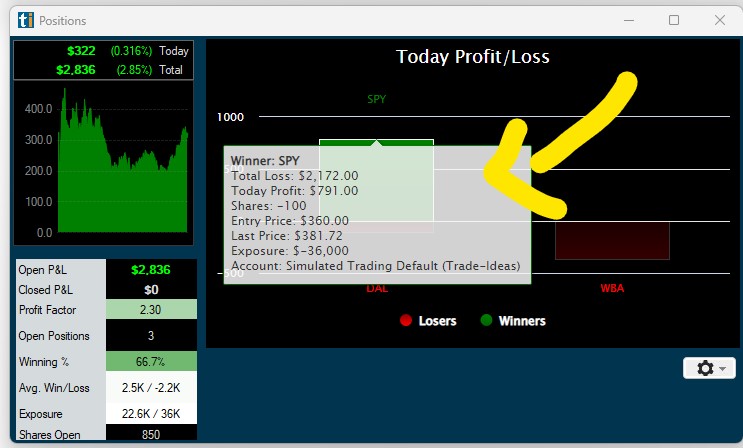
- The Total Loss/Profit
- Today's Loss/Profit
- Amount of Shares
- Entry Price
- Last Price
- The total Exposure in Dollars
- Account the shares are traded in
Total/Today's Profit/Loss
The right-click menu gives you the option to display the Total Profit/Loss or Today's Profit/Loss:
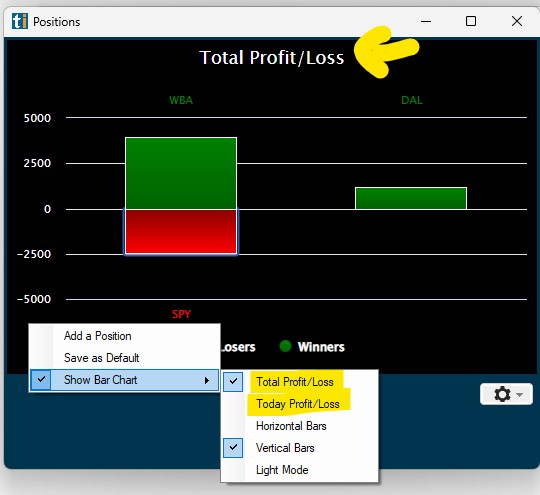
Dark Mode/Light Mode
The right-click menu enables you to choose between the default dark mode and a light mode:
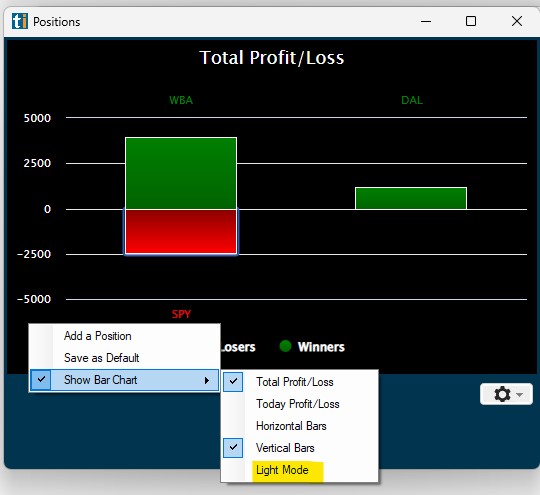
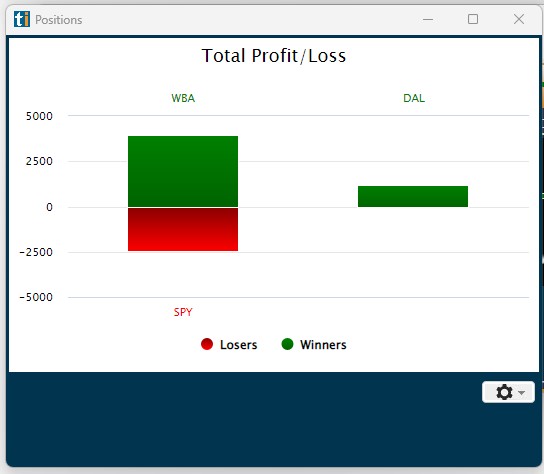
Gear Icon Options
Show Profit & Loss Graph
To display the Profit & Loss Graph as well as other performance statistics about your trades in the Positions Tab, click the Gear Icon in the bottom right-hand corner and select Show P&L Graphs. The Positions Tab Graph displays the Total Trading Profit & Loss of all your Trades.
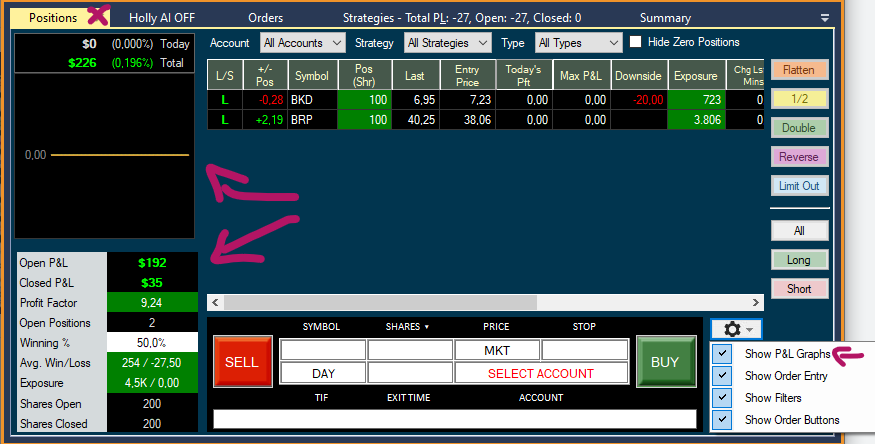
Show Order Entry
To display the manual Order Entry Panel in the Positions Tab of the Brokerage Plus Window. Click on the Gear Icon in the bottom right-hand corner and check the option Show Order Entry. This will open the Order Entry Panel right inside the Positions Tab.
Manual Order Entry
To submit orders manually, open the New Tab and select Order Entry from the dropdown. This will open an Order Entry Panel in a new window. Alternatively, you can use the manual Order Entry Panel in the Positions Tab of the Brokerage Plus Window. To do so, click on the Gear Icon in the bottom right-hand corner and check the option Show Order Entry. This will open the Order Entry Panel right inside the Positions Tab.
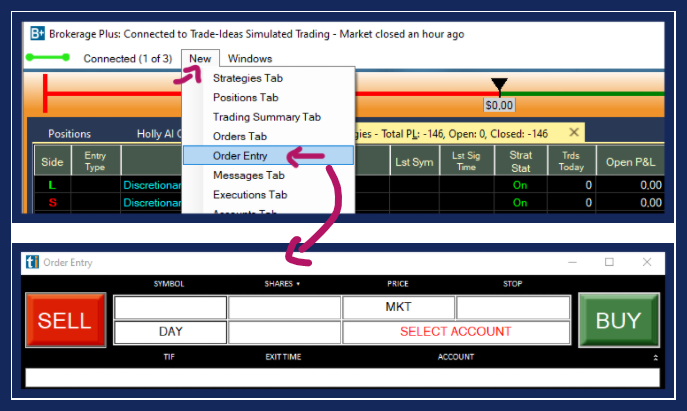
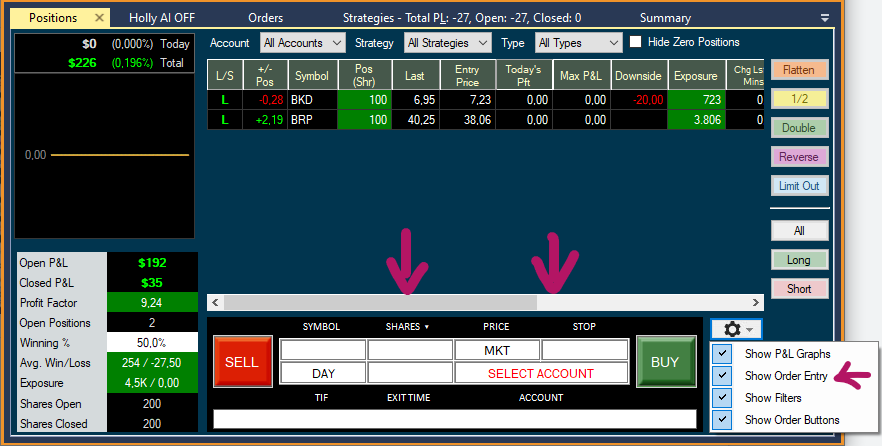
Show Filters
To add Filter functionality to your Positions Tab, click on the Gear Icon in the bottom right-hand corner and check the option Show Filters. This will add three Filter options to the top of the Positions Tab. You can filter your positions by Trading Account, applied Trading Strategy as well as Open, Closed, Long, and Short. Next to the three Filter dropdowns, you have the option to show or hide Zero Positions. Zero Positions are your completed trades.
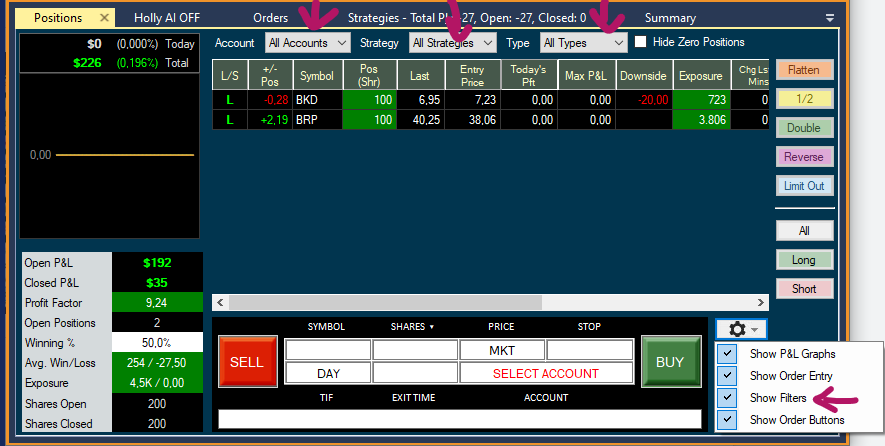
Show Order Buttons
To add Rapid Order Buttons to your Positions Tab, click on the Gear Icon in the bottom right-hand corner and check the option Show Order Buttons.
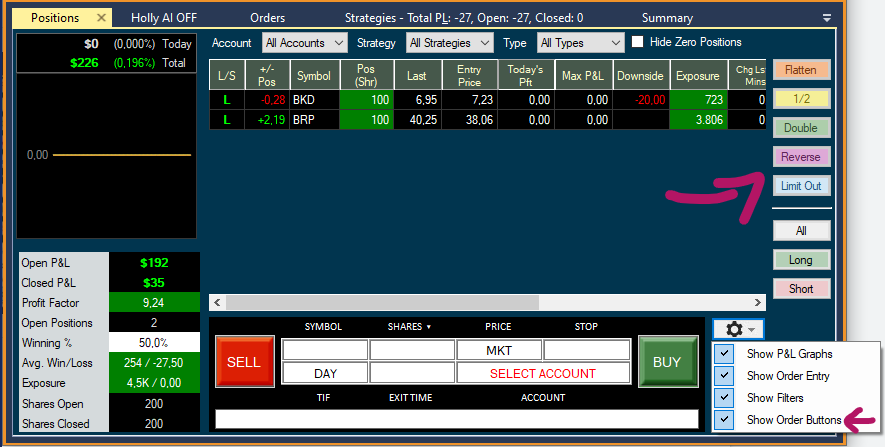
-
Flatten will close the current positions by initiating a market order.
-
½ will half the number of shares by initiating a market order.
-
Double will double the number of shares by initiating a market order.
-
Reverse will close the current long/short positions and enter into new short/long positions by initiating a market order, which is double in size to the current order but trading in the opposite direction.
-
Limit Out enables you to exit one or all of your trades at once whilst applying a Limit Offset to the price that the stock is currently trading at. Highlight the position you would like to exit, then add the Limit Offset that you would like to apply to the current Bid/Ask price of the stock.
-
All highlights all your positions at once
-
Long highlights all your active Long positions at once
-
Short highlights all your active Short positions at once
Trading Summary Tab
The Trading Summary Tab provides a quick overview of what type of trades you have taken and how they performed.
To access it, open the New Tab of the Brokerage Plus Module and select Trading Summary Tab. To open the Trading Summary in a separate window, choose Window and then Trading Summary instead.
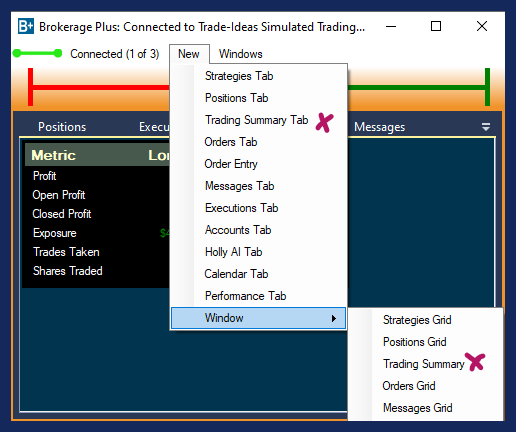
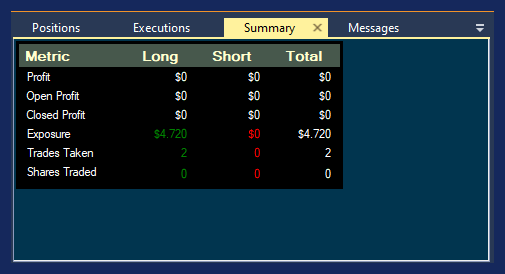
Orders Tab
Once submitted, your orders will appear in the Orders Tab. Green signifies orders that have been filled, red signifies orders that have been canceled, purple signifies orders that have been rejected and white signifies open orders.
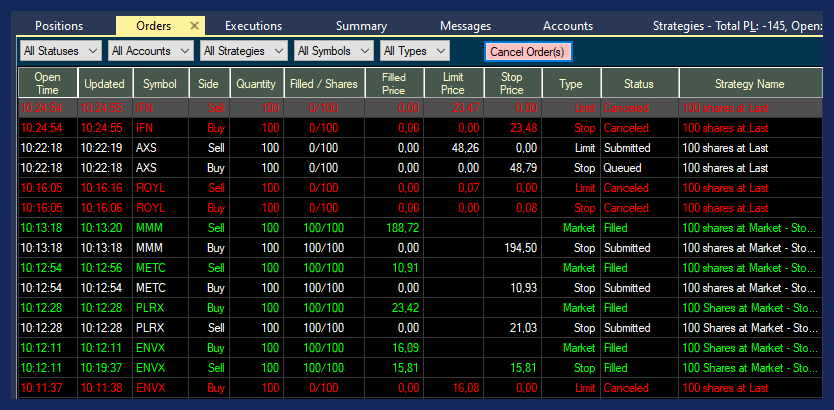
Cancel Order
To cancel an open order, highlight it, then press the red Cancel Order Button. Alternatively, highlight the order, then right-click and select Cancel Order.
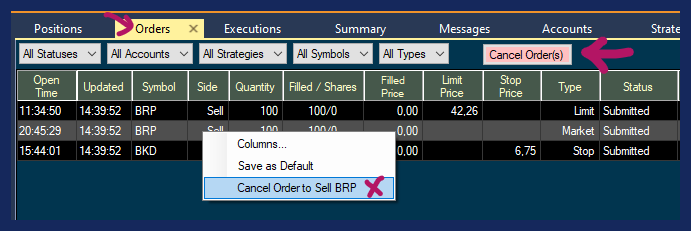
Filters
At the top of the Orders Tab, you will find five Filter options. The Orders Tab enables you to filter your orders by Status (Live, Not Live, Queued, Submitted, Cancelled, Filled, Partially Filled), by Account, by Strategy, by Symbols as well as by Order Type (Market, Stop, Limit, Time Stop).
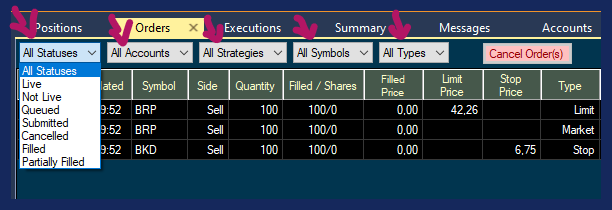
Columns
The columns of the Orders Tab can be reorganized via drag and drop with your mouse. The individual columns can also be extended or compressed by using your mouse.
To sort the data by a column, double-click on the column header.
To add more columns right-click into the Orders Tab field and select Columns.
The left-hand side shows the already listed columns, the right-hand side shows the columns that can be added.
Select additional columns by highlighting them with a left mouse click.
Click the arrow pointing to the left to move them to the Selected Columns field.
To remove any of the already selected columns, highlight the column, then click the arrow pointing to the right.
Click OK when you are done.
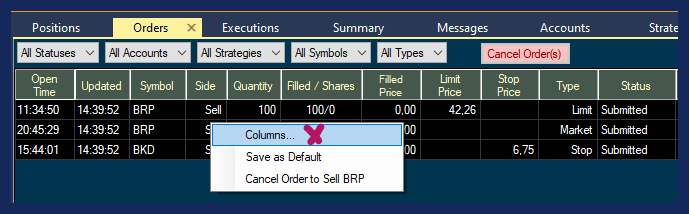
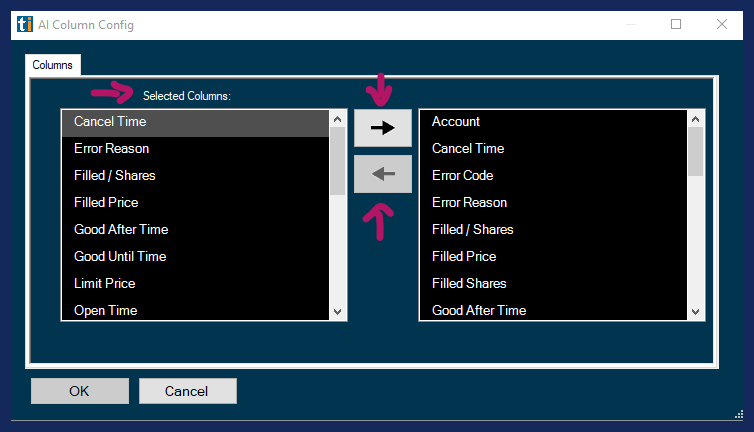
Save as Default
If you have changed the column order or filter settings of your Orders Tab, you can save this configuration as the default version of the Orders Tab by right-clicking and choosing Save As Default.
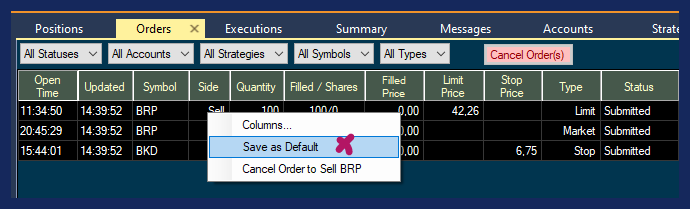
Manual Order Entry Panel
To submit orders manually, open the New Tab and select Order Entry from the dropdown. This will open an Order Entry Panel in a new window.
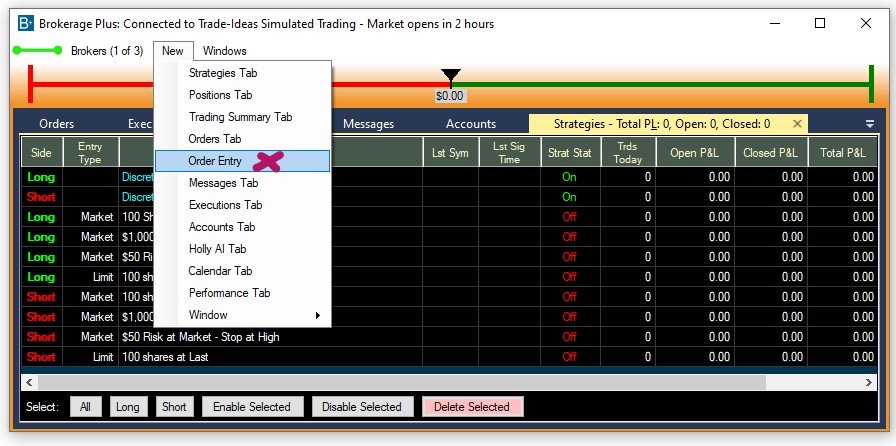
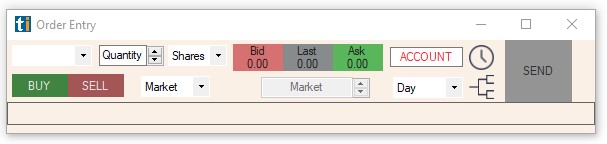
Alternatively, you can use the Manual Order Entry Panel in the Positions Tab of the Brokerage Plus Window.
To do so, click on the Gear Icon in the bottom right-hand corner and check the option Show Order Entry. This will open the Order Entry Panel right inside the Positions Tab.
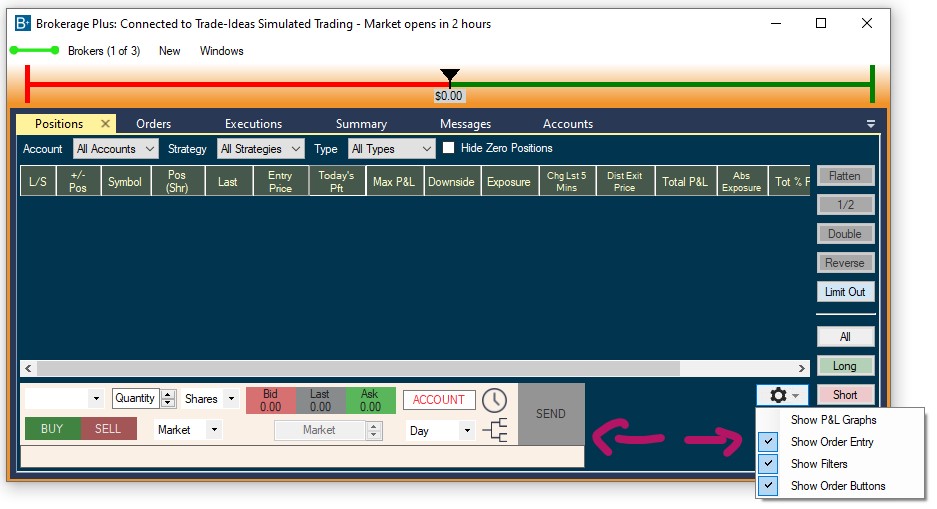
Symbol Field
The Order Entry Panel is symbol-linked, so it will automatically load any ticker into the Symbol Field that you select in any of the Trade Ideas Window.
Alternatively, you can enter the symbol by typing.
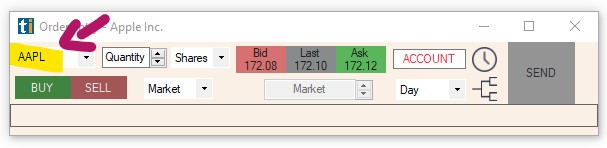
Position Size
You can define your Position Size in either Shares or Dollars.
The default is set to shares.
Change the selection by clicking the small downward pointing arrow on the right-hand side of the Position Size field.
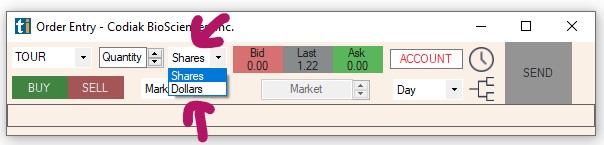
To select the number of shares or the dollar amount, either type it directly into the Quantity field, or click into the Quantity field and make a selection from the presets.
You can increase and decrease the entered amount by clicking the small up and downward pointing arrows to the right-hand side of the Quantity field.
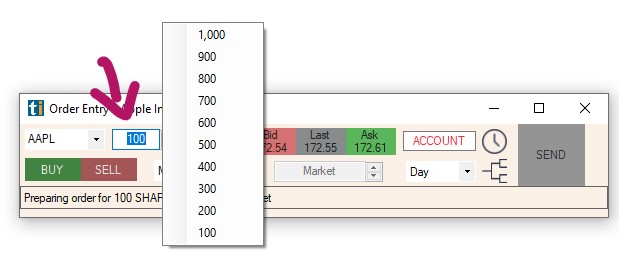
Bid/Ask/Last
The center field will display Bid, Ask and Last Price for the entered ticker symbol.
A click on Bid, Ask or Last Price will result in the the Order Type being automatically set to Limit and the dollar value being entered in the Price field.
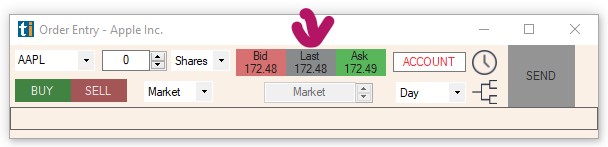
Account Field
For any order to be submitted, you need to connect your brokerage account. All accounts that have been connected via the Brokerage Plus Connect Tab, will be listed for selection in the Accounts field. To see the available accounts, click into the Accounts field, then make a selection.
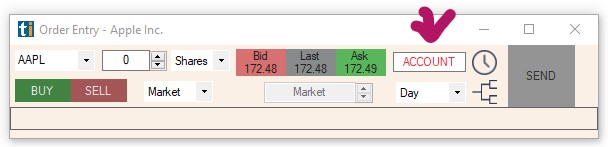
Buy & Sell Buttons
Press Buy to prepare a Buy Order and Sell to prepare a Short Order. Making a selection here only defines the direction of the order, it won't send the order.
To send the order, press the Send button.
For easy visual differentiation, the Order Entry Panel will turn green, when Buy is selected and red when Sell is selected.
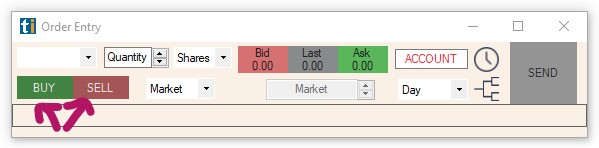
Entry Order
You can choose between Market, Limit, Stop and Stop Limit as types for your Entry Order.
When selecting Limit as your Entry Order Type, enter a Price in the Price Field.
When selecting Stop as your Entry Order Type, enter a Price in the Price Field.
(Please use the dedicated Bracket Order Button, on the left-hand side of the Send Button to add a Stop Loss to your Entry Order)
For more details on how to use Stop Orders as Entry Orders, head to this section.
When selecting Stp Lmt as your Entry Order Type, enter your Stop Price in the Stop Field and a Limit Price in the Limit Field.
For more details on how to use Stop Limit Orders as Entry Orders, head to this section.
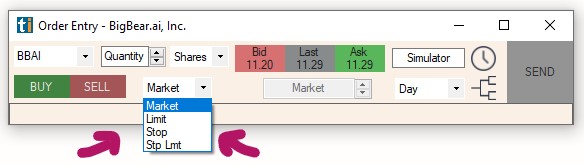
TIF Field
The Time in Force Field enables you to define when your submitted order will expire if not filled.
DAY: Order will remain open until today’s market close.
GTC (Good Till Cancelled): Order will remain open until you manually cancel it.
Custom: Select a custom time period in Minutes, Hours or Days.
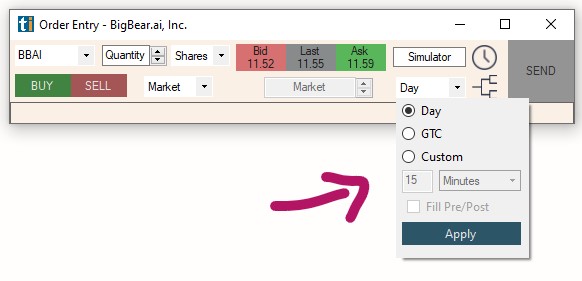
Exit Orders
Time Stop
To submit a Time Stop, together with your Entry Order. Click on the Time Stop Icon on the left-hand side of the Send Button.
Select a Date and Time for your Time Stop, then press Add Time Stop.
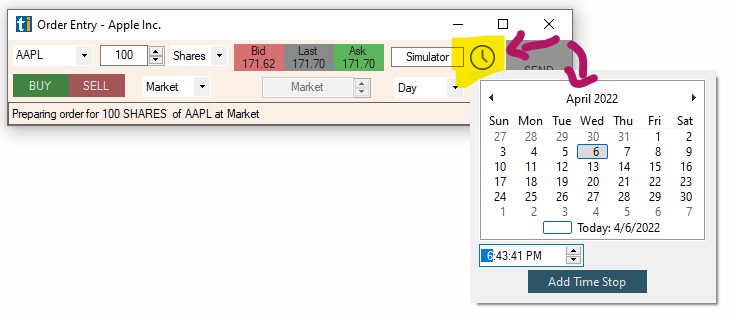
Stop Loss
To submit a Stop Loss, as a bracket order together with your Entry Order. Click on the Bracket Order Button on the left-hand side of the Send Button.
Place a checkmark and enter your Stop Price.
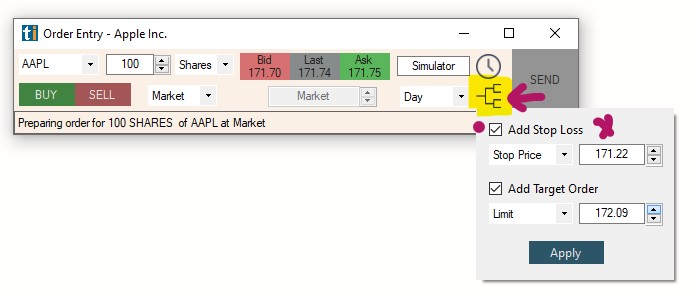
Target
To submit a Target Order, as a bracket order together with your Entry Order. Click on the Bracket Order Icon on the left-hand side of the Send Button.
Place a checkmark and enter your Limit Price.
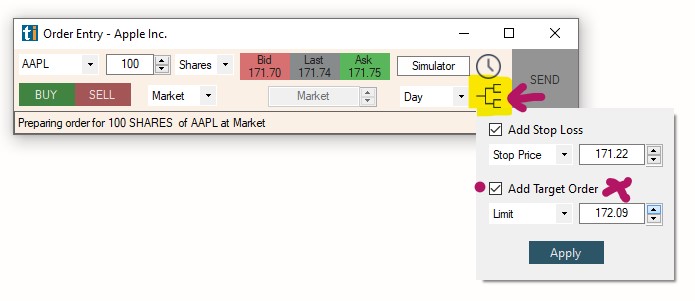
Summary Field
The Summary Field at the bottom will provide a summary of your order in plain English.
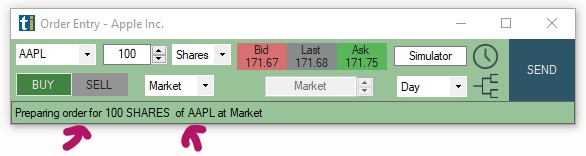
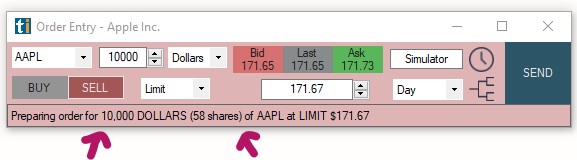
Submit Order
Once you hit the Send Button, your order will be sent to the chosen Brokerage/Simulator for execution.
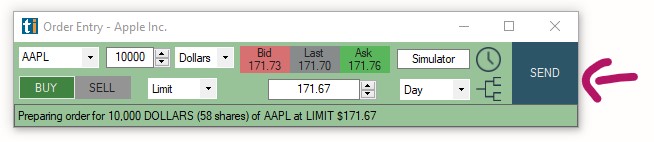
Reset Fields
To reset all Order fields at once, right-click into the Manual Order Entry Window and select Reset Fields.
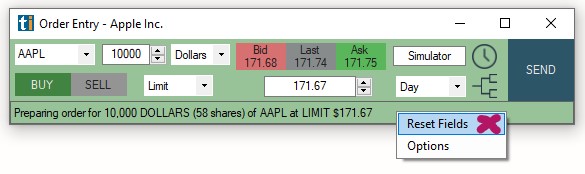
Additional Options & Order Presets
To access additional settings located in the Brokerage Plus Preferences Menu of the Tools Tab, right-click into the Manual Order Entry Window and select Options.
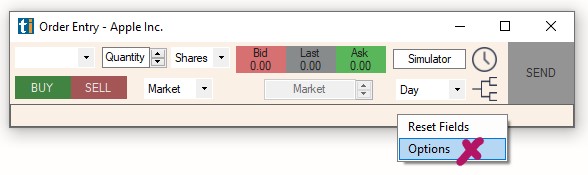
Here, you can create various Order Presets for your Manual Order Entry Panel to speed-up your manual trading.

Messages Tab
The Messages Tab shows the API message flow between your brokerage platform and Trade Ideas and also shows errors and warnings. It’s a very helpful tool for troubleshooting. Please note that all Trading Strategies inside the Strategies Tab that are based on an Alert Window send API messages for every new Alert that triggers, no matter if the Trading Strategy is enabled or disabled in Brokerage Plus. Since some Brokers limit the API data flow, it is advisable to remove any Trading Strategies based on Alert Windows that are not in regular use.
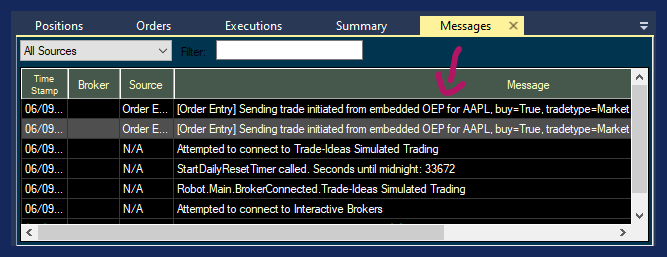
Executions Tab
The Executions Tab displays details about your executed orders for the day including Brokerage Commission, Order ID, and Fill Price and Time.
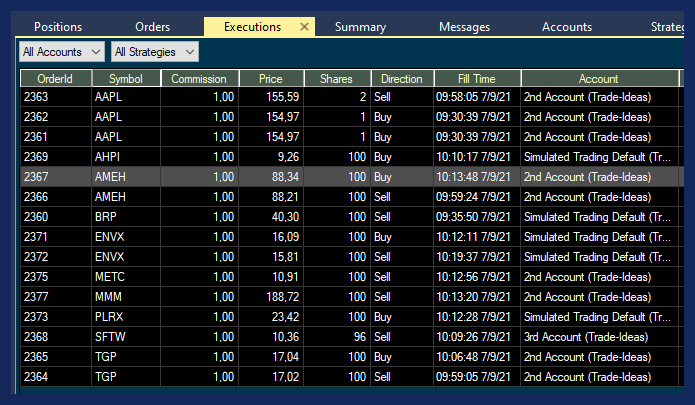
Actions - Sound Notifications
The Actions menu enables you to receive a Sound Notification whenever an order has been filled. To enable Sound Notifications, right-click into the Executions Tab and select Actions. Check Play Sound in the new popup window. Then click Set Up Sound.
The next window will display built-in sound options. You can choose an asterisk, a beep, exclamation, a stop, or text to speech. If you choose the Text-To-Speech Option, a female voice will call out the traded stock symbol when your order is filled. Further below, you can choose a custom sound from your local computer.
Once you have selected a Sound Option, click Play to test the audio. Use the Balance and Volume sliders to adjust the sound to your liking.
Hit Okay when you are done.
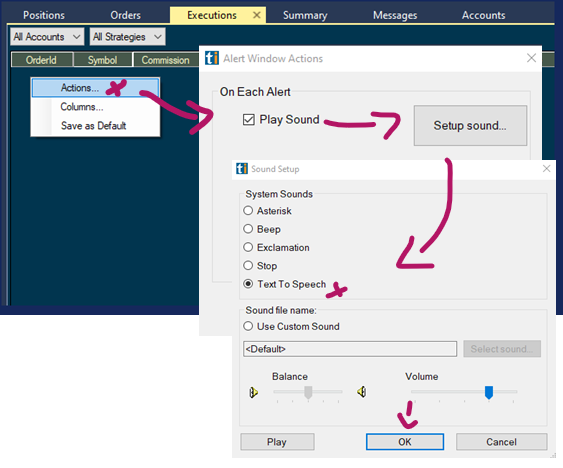
Columns
The columns of the Executions Tab can be reorganized via drag and drop with your mouse. The individual columns can also be extended or compressed by using your mouse. To sort the data by a column, double-click on the column header.
To add more columns right-click into the Executions Tab field and select Columns.
The left-hand side shows the already listed columns, the right-hand side shows the columns that can be added.
Select additional columns by highlighting them with a left mouse click.
Click the arrow pointing to the left to move them to the Selected Columns field.
To remove any of the already selected columns, highlight the column, then click the arrow pointing to the right.
Click OK when you are done.
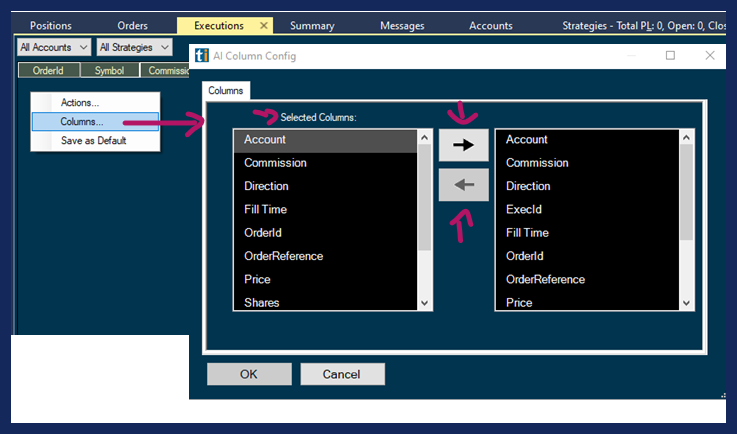
Save as Default
If you have changed the column order or filter settings of your Executions Tab, you can save this configuration as the default version of the Executions Tab by right-clicking and choosing Save As Default.
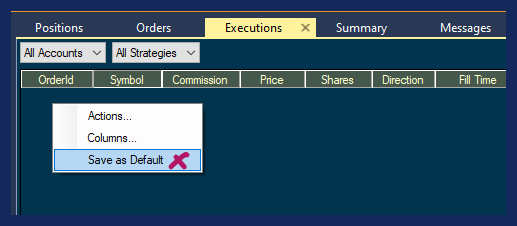
Filters
The two Filter options at the top of the Executions Tab enable you to filter by Account or by Strategy.
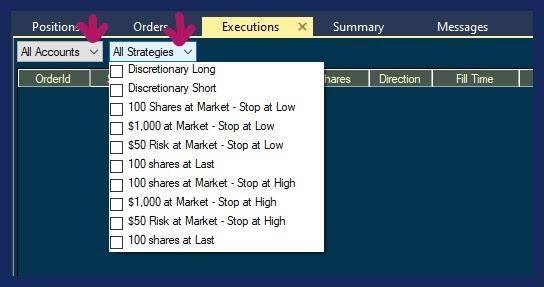
Accounts Tab
The Accounts Tab displays the connected Account(s) and their associated metrics like Account Value, Buying Power, and Available Funds.
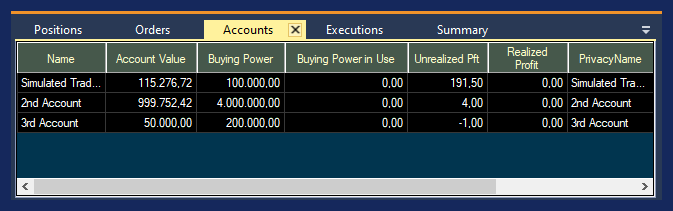
Columns
The columns of the Accounts Tab can be reorganized via drag and drop with your mouse. The individual columns can also be extended or compressed by using your mouse. To sort the data by a column, double-click on the column header.
To add more columns right-click into the Accounts Tab field and select Columns.
The left-hand side shows the already listed columns, the right-hand side shows the columns that can be added.
Select additional columns by highlighting them with a left mouse click.
Click the arrow pointing to the left to move them to the Selected Columns field.
To remove any of the already selected columns, highlight the column, then click the arrow pointing to the right.
Click OK when you are done.
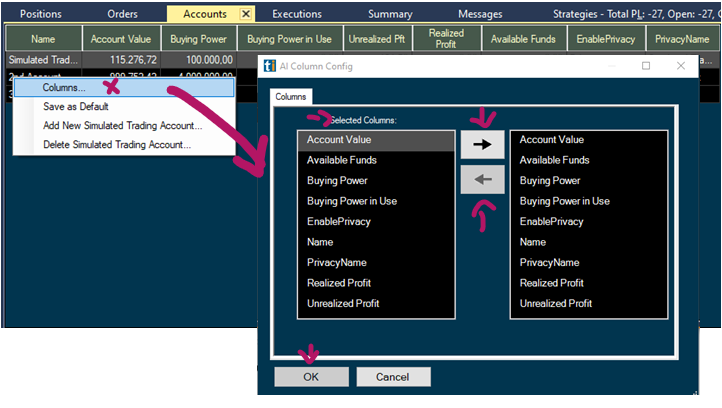
Save as Default
If you have changed the column order or any other settings of your Accounts Tab, you can save this configuration as the default version of the Accounts Tab by right-clicking and choosing Save As Default.
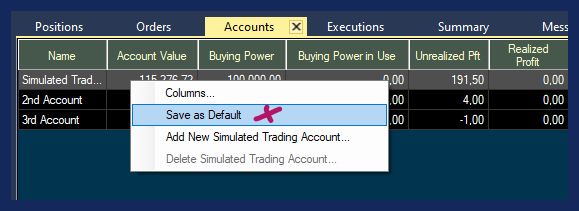
New Simulated Trading Account
The Accounts Tab enables you to create additional simulated trading accounts. Our Default Simulated Trading Account has a Starting Value of $100 000 which cannot be changed and it can only be reset by our support team via email to info@trade-ideas.com. Additional Simulated Trading Accounts don’t have this restriction. You can define the Starting Value and delete the account as you please. To create an additional Simulated Trading Account, right-click into the Accounts Tab and select Add New Simulated Trading Account. Give your new Account a Name and enter a Starting Value in Dollars.
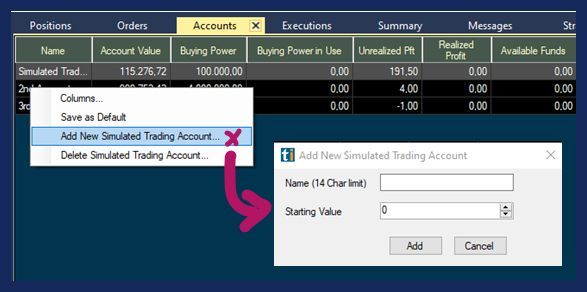
Delete Simulated Trading Account
To delete any additional Simulated Trading Account, right-click into the Accounts Tab and select Delete Simulated Trading Account. This will bring up the Confirmation Account Deletion Window. Select Yes to delete and No to cancel the deletion.
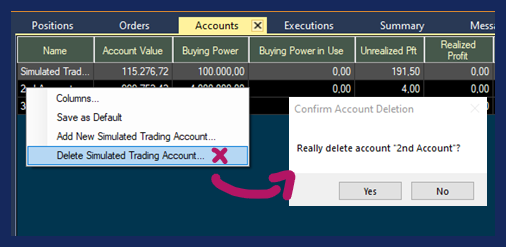
Calendar Tab
The Calendar Tab displays details about the daily trades and their parameters. Double-click on the calendar day in the top left-hand corner to open a new window that shows the executed trades in detail.
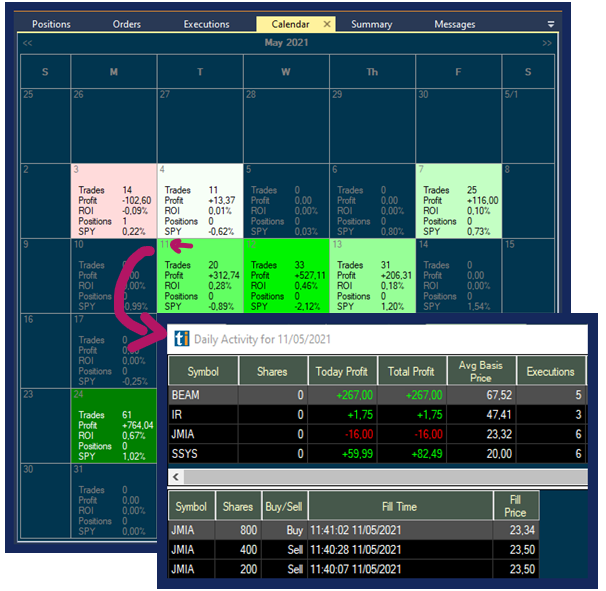
Performance Tab
The Performance Tab provides an insight into the performance of your trades.
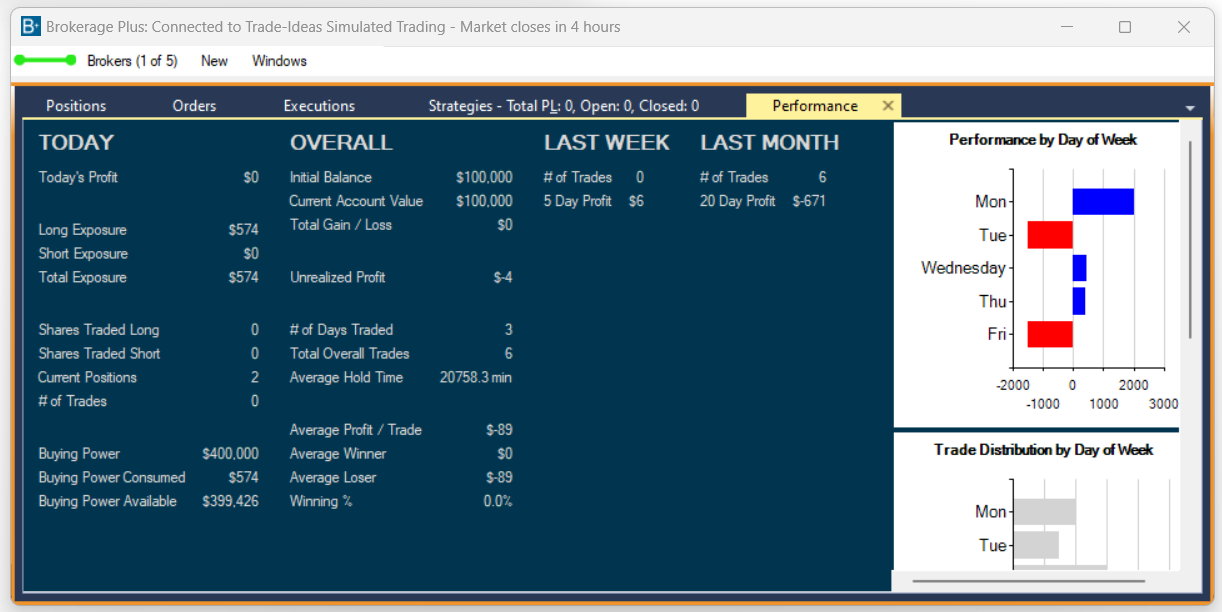
Daily Profit/Loss Summary Chart Tab
The Brokerage Plus Daily Profit/Loss Summary Chart enables you to easily visualize as well as review your daily Profit and Loss for every minute of the trading day.
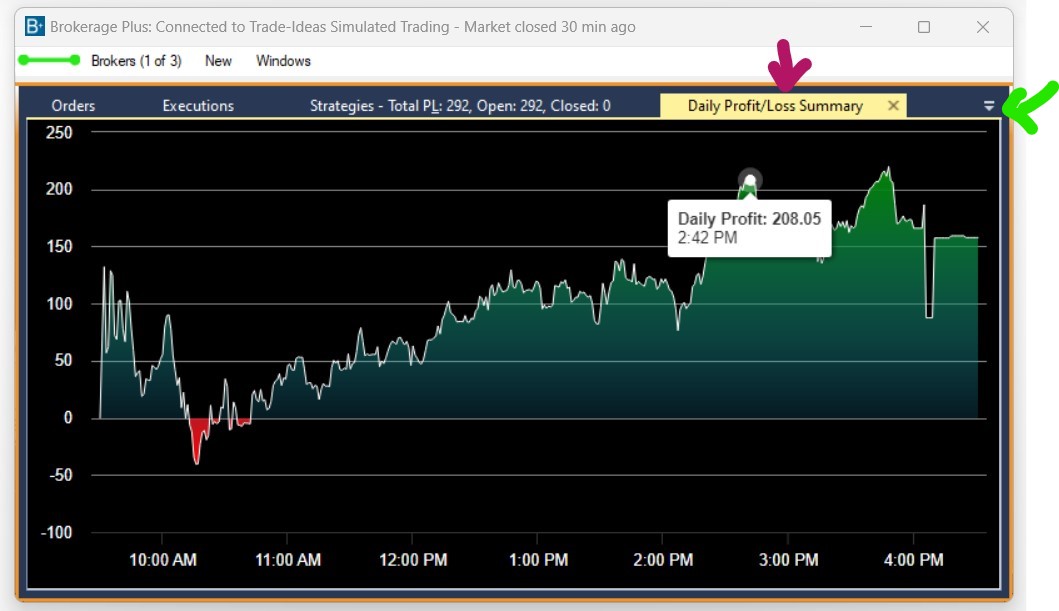
There are two ways to load the Daily Profit/Loss chart. You can load it into your Brokerage Plus Dock as a Tab or open it in a separate window.
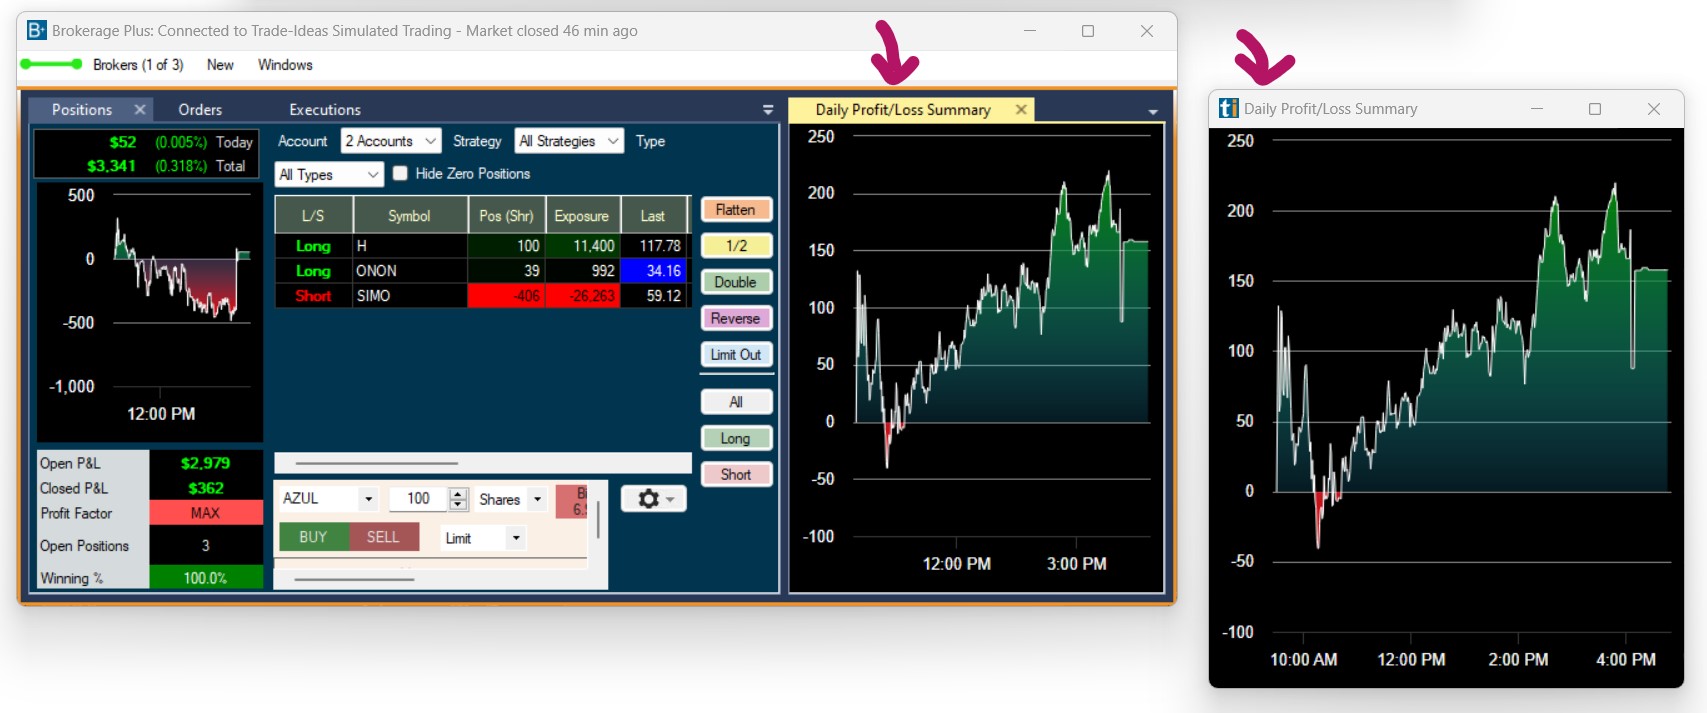
1. Load as a Dock Tab
To load it as a tab into your Brokerage Plus Dock, open the New Tab of the Brokerage Plus Toolbar and select Daily Profit/Loss Summary Chart Tab
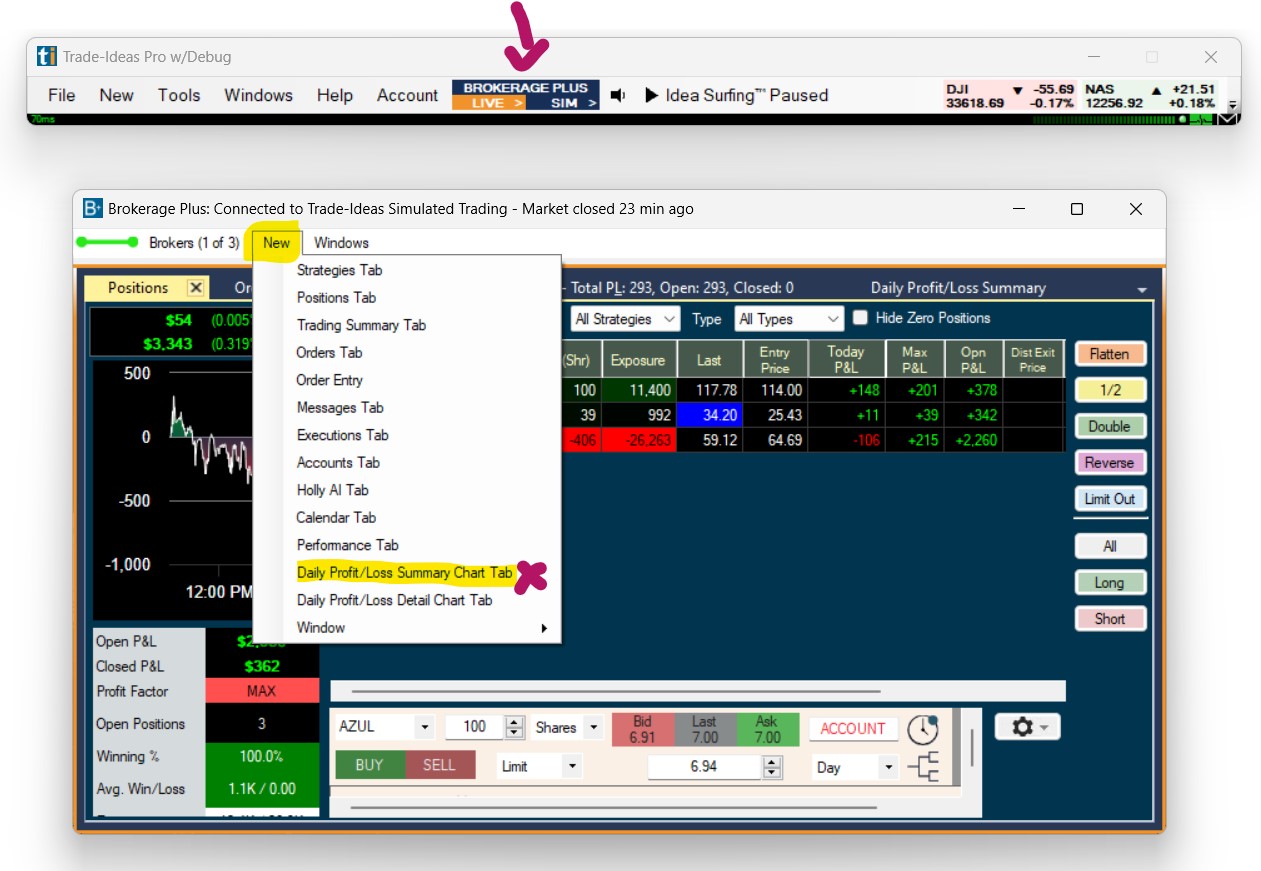
The chart will then open as a tab alongside the other tabs within the Brokerage Plus Dock.
If you cannot see the tab, click on the small downward-pointing arrow on the right-hand side (green arrow) and select it from the drop-down.

To display the Daily Profit/Loss Chart directly in your Positions Tab as shown below, follow the general docking placement rules outlined in our Docking Guide.
2. Load as a Separate Window
To load the Daily Profit/Loss Summary Chart as a separate window, open the New Tab of the Brokerage Plus Toolbar, select Windows and then selectDaily Profit/Loss Summary Chart Tab
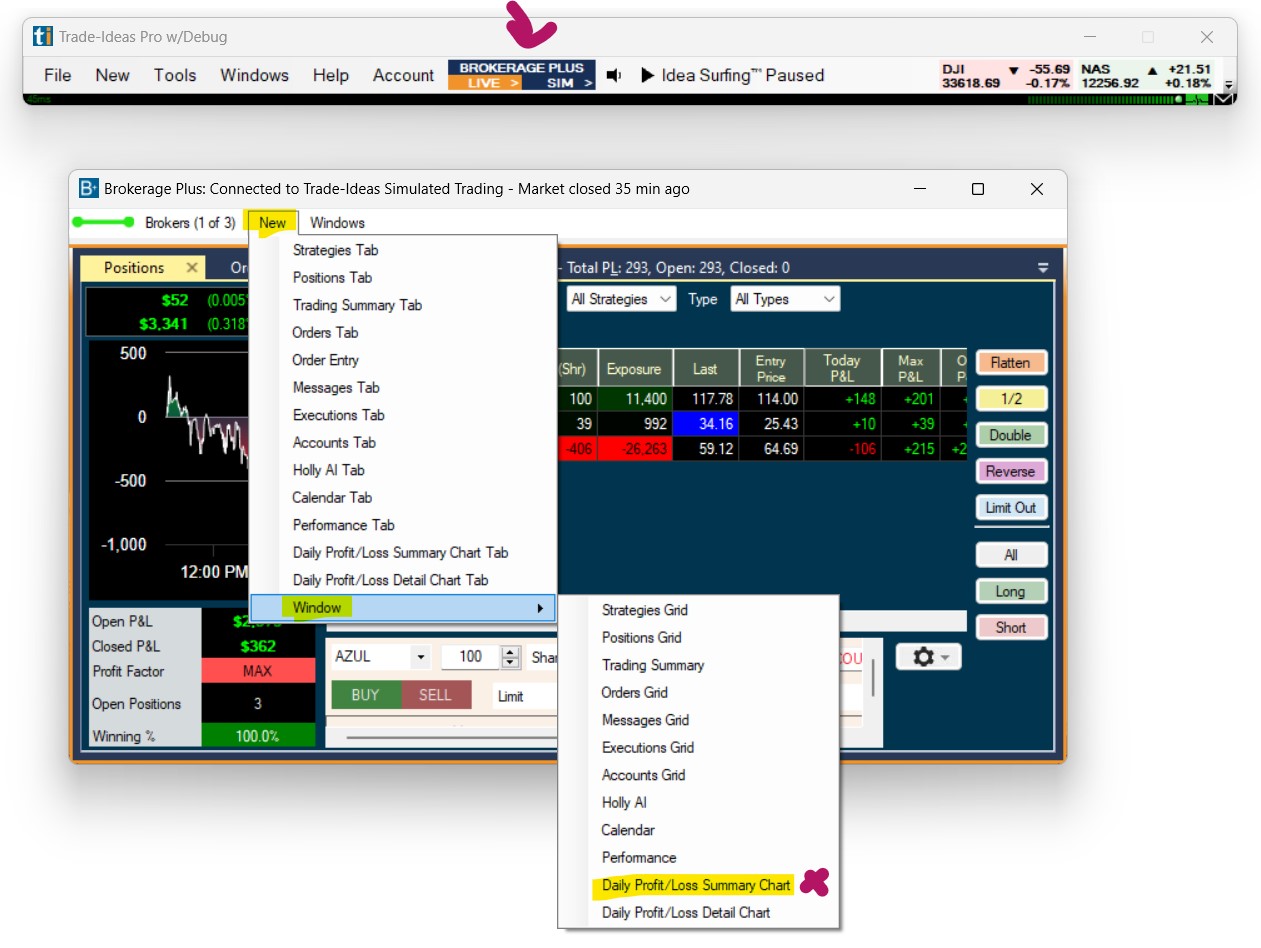
Settings
The Y-Axis of the Daily Profit/Loss Summary Chart shows the dollar amounts.
The X-Axis displays the time of day.
Hovering over the chart with your mouse will reveal the Profit/Loss at specific times of the trading day.
You can zoom into the Profit and Loss chart to see smaller time periods, and review the daily Profit/Loss for each minute of the trading day.
To zoom into the chart, highlight the chart area you would like to review with your mouse.
To reset the zoom click the Reset Zoom Button in the top right-hand corner.
You can switch between dark mode and light mode via a right-click into the Daily Profit/Loss Summary Chart
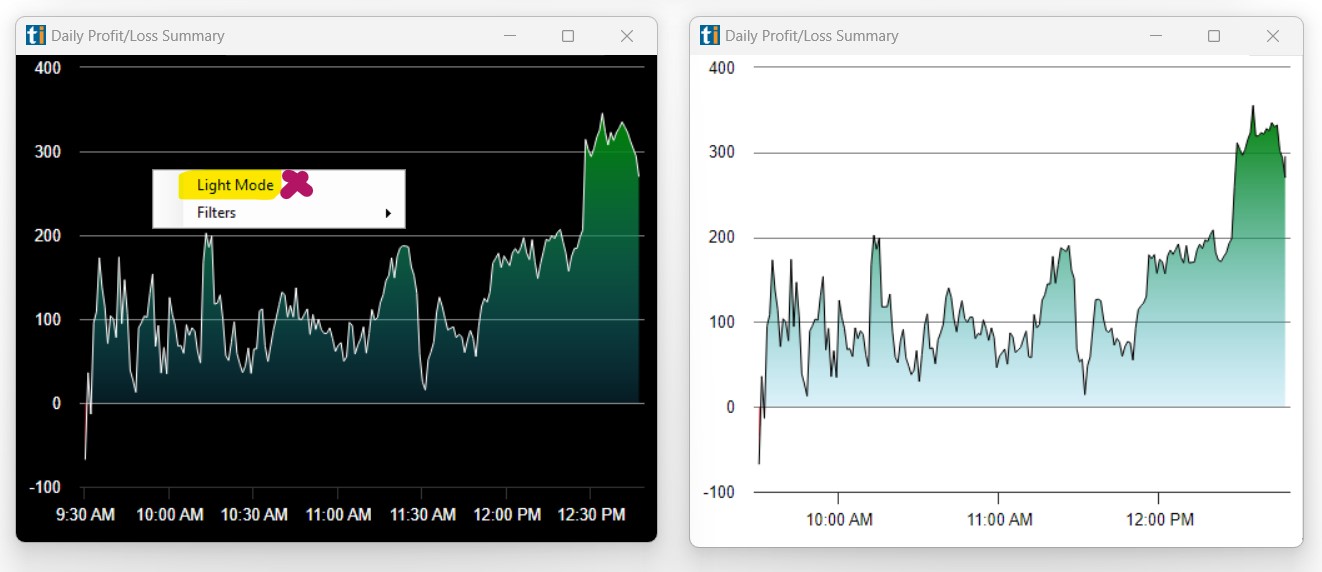
You can filter, which Accounts, Strategies or Trade Types the Daily Profit/Loss will be calculated from via a right-click into the Daily Profit/Loss Summary Chart.
By default the Profit/Loss chart will take all Trading Accounts, Strategies and Trades into account. To exclude some of them, make a selection from the Filters Dropdown and remove specific check-marks.
Daily Profit/Loss Detail Chart Tab
The Brokerage Plus Daily Profit/Loss Detail Chart enables you to easily visualize as well as review the Profit and Loss for a specific trade for every minute of the trading day.
There are two ways to load the Daily Profit/Loss Details chart. You can load it into your Brokerage Plus Dock as a Tab or open it in a separate window.
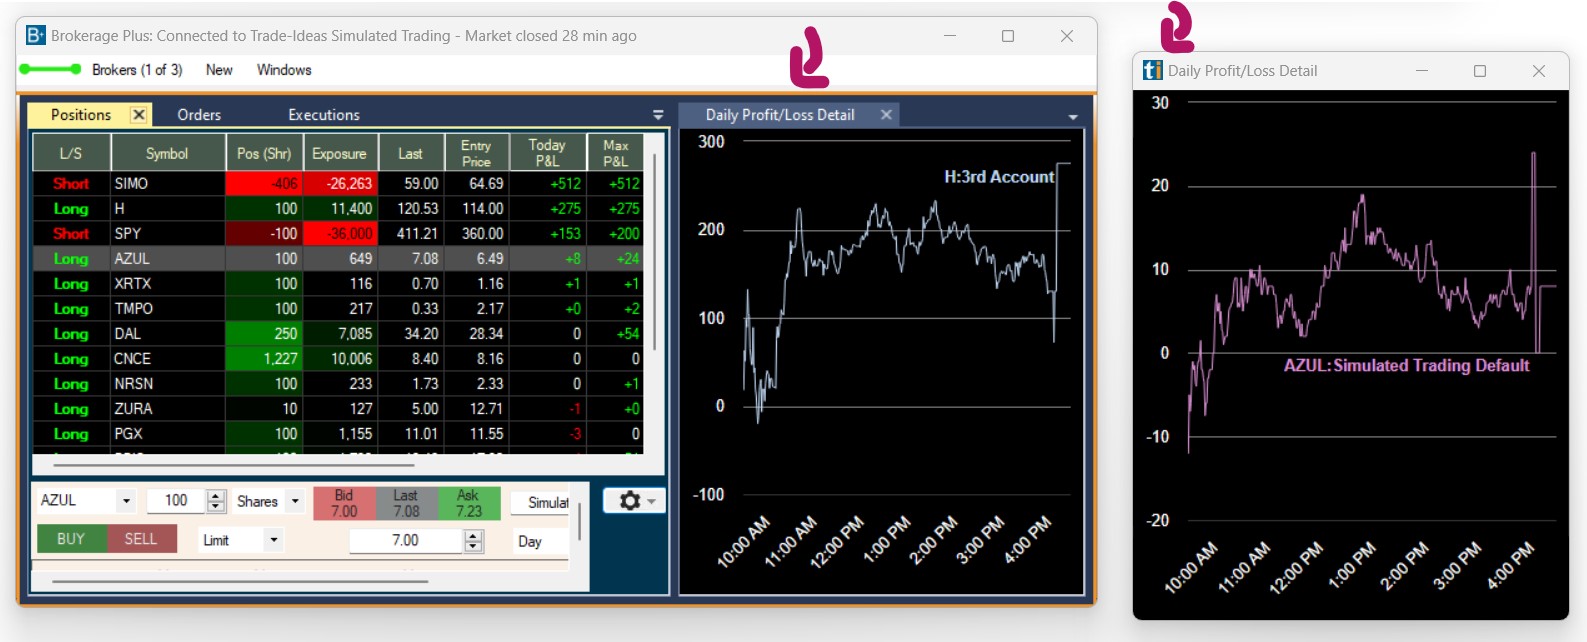
1. Load as a Dock Tab
To load it as a tab into your Brokerage Plus Dock, open the New Tab of the Brokerage Plus Toolbar and select Daily Profit/Loss Summary Detail Chart Tab
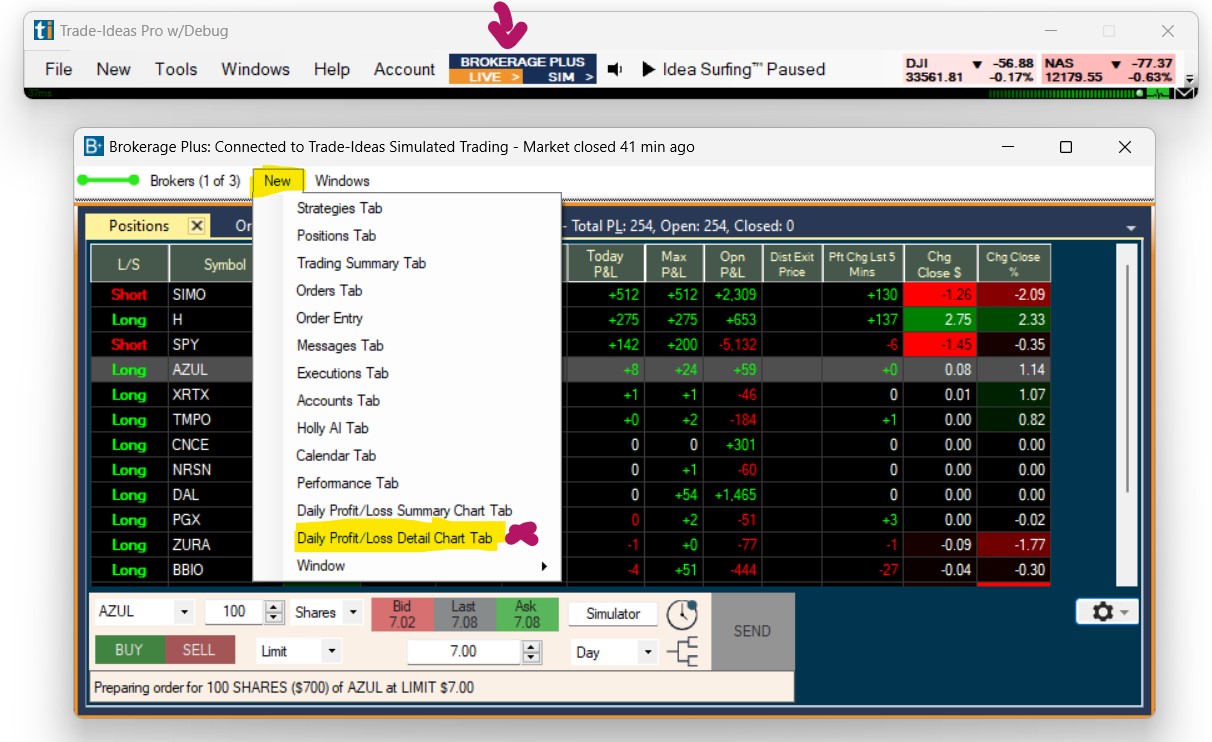
The chart will then open as a tab alongside the other tabs within the Brokerage Plus Dock, and you will be prompted to click on a position in your Brokerage Plus Positions Tab to see the Daily Profit/Loss of the selected trade.
If you cannot see the tab, click on the small downward-pointing arrow on the right-hand side (green arrow) and select it from the drop-down.
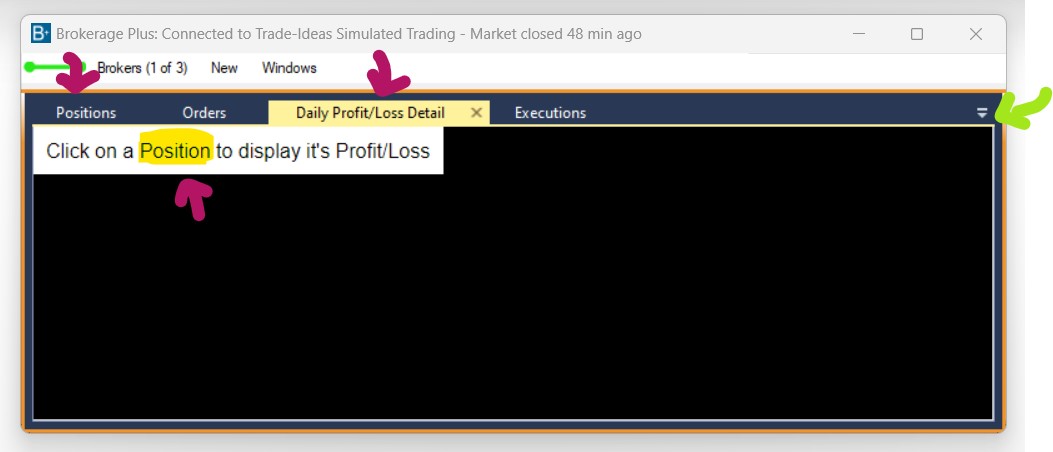
To display the Daily Profit/Loss Details Chart directly in your Positions Tab as shown below, follow the general docking placement rules outlined in our Docking Guide.
2. Load as a Separate Window
To load the Daily Profit/Loss Detail Chart as a separate window, open the New Tab of the Brokerage Plus Toolbar, select Windows and then selectDaily Profit/Loss Summary Detail Chart Tab
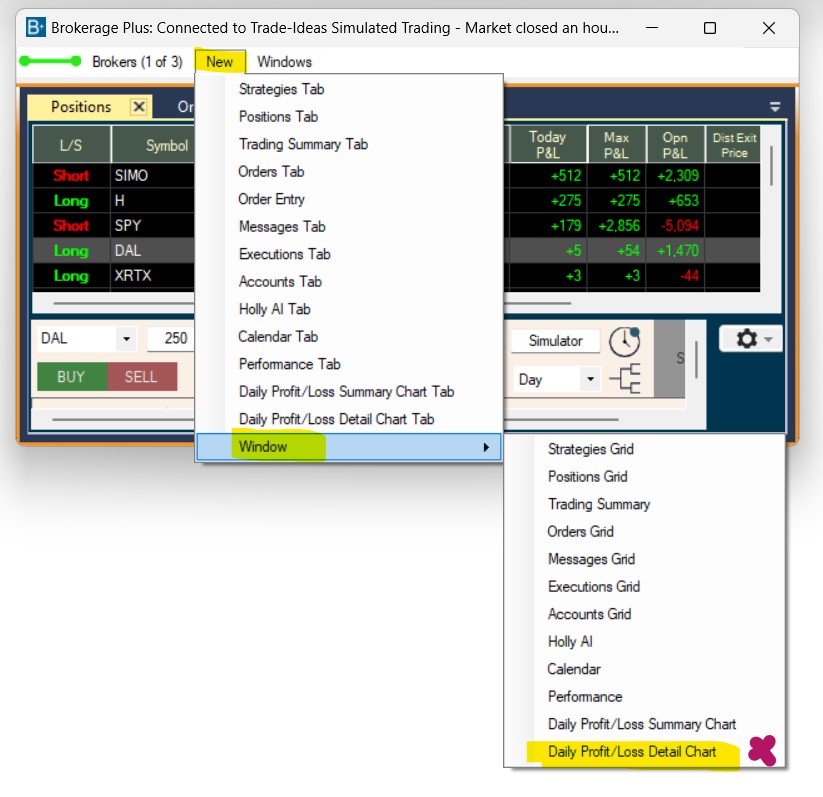
Settings
The Y-Axis of the Daily Profit/Loss Detail Chart shows the dollar amounts.
The X-Axis displays the time of day.
Hovering over the chart with your mouse will reveal the Profit/Loss at specific times of the trading day.
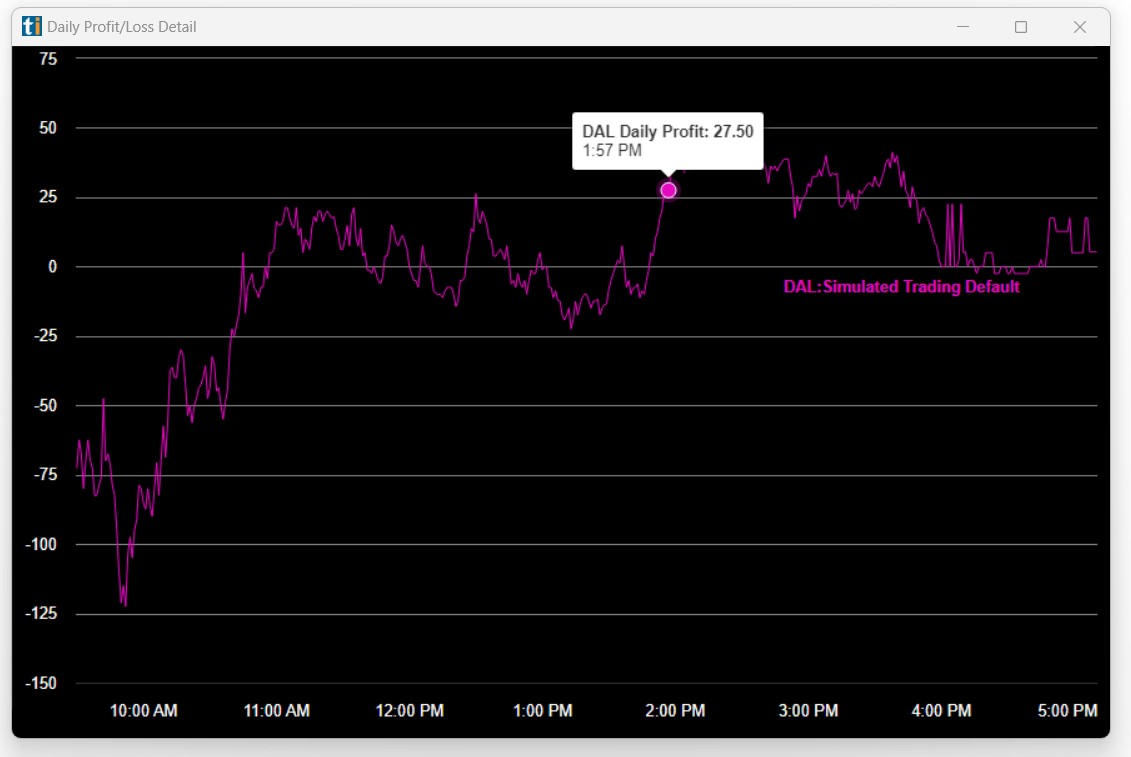
You can switch between dark mode and light mode via a right-click into the Daily Profit/Loss Detail Chart
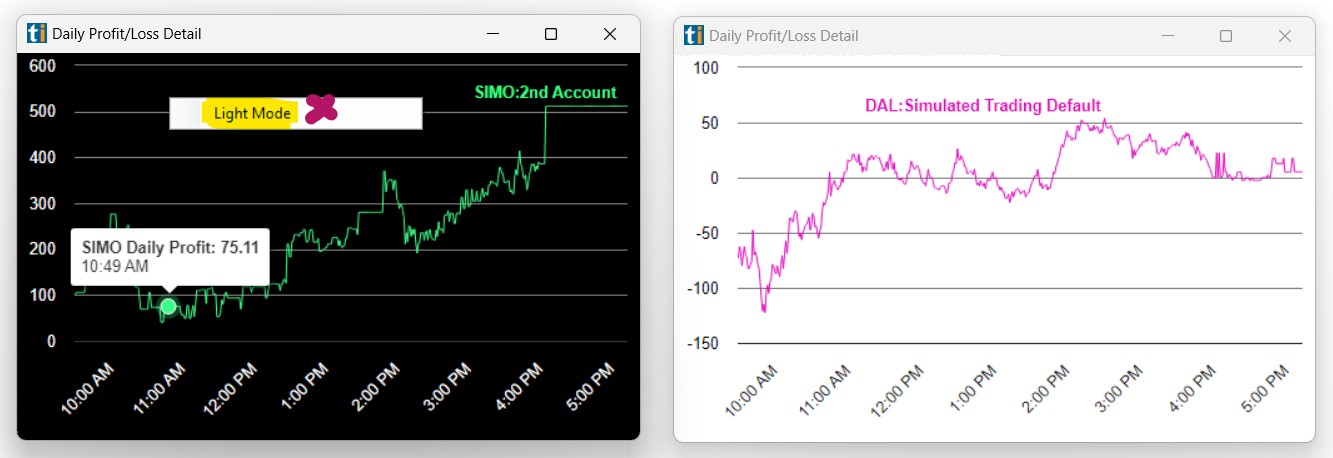
You can use multiple PnL Details Charts at the same time.
When you do so, and click through your trades in the Positions Tab, these Details Charts will update one by one with a new position. The order depends on the order you opened the Daily Profit/Loss Detail Charts in.
Backtesting/Oddsmaker
The Oddsmaker enables you to evaluate how well your strategies perform over recent history. You can determine the profit factor, the win rate, compare the average winner versus the average loser, and see the projected return of the strategy.
You can define your starting equity, your position size, and even add your broker's commission.
The backtest will show you the equity curve that your strategy produced and your daily profit and loss. In addition to that, you can see how many trades would have taken place each day, what the maximum drawdown was, and how much buying power was needed.
The color-coded calendar shows you the metrics per day, and a double-click reveals the individual trades. You can look at the different filters, see how they impact the results and adjust their values to optimize your scan.
In addition to that, the Oddsmaker enables you to refine and optimize your scans. The optimization tab allows you to drill down into the details of the strategy to see what makes it work. Each tab contains a reporting engine that can break down your strategy by different filters, allowing you to see which subsets of the trades work well and which don't. You can use the information here to add additional filters to your strategy to improve it.
Please note, the OddsMaker follows particular rules for entering into a trade. It starts with the earliest alerts and moves to the latest. Typically, there are 64 days worth of history in the database. The OddsMaker does not look at any data for the current trading day. It does not backtest in the premarket or postmarket session. Once it enters a position for a specific stock symbol, it will not look at that stock again for the rest of the trading day. However, each day starts fresh, and it will enter a new trade for the same stock symbol on the following days.
The OddsMaker will list the first 100 trades per day. If set to use the entire available backtesting period, this equates to 6200 trades.
Our backtesting tool, as well as most other backtesters, is based on the open, high, low, and close data of 1-minute candles, not on tick-by-tick data. Because of this, you are likely to see discrepancies between testing results and actual trading. The back-tester is not designed for high-frequency trading or rapid scalping strategies. If your strategy is based on very fast price action, you might not see an accurate portrayal of real-world results. The OddsMaker will use historical data for the exit price and doesn't factor in the spread. In live trading, there is no guarantee that you will get this exact price.
Because of these differences to live trading, we recommend that you first successfully backtest and optimize a strategy, Then test it in paper trading mode, but under real market conditions, and only after that move to live trading.
A last thing to note is that the OddsMaker
To access the Oddsmaker, right-click into the Alert Window, and select, Backtest Strategy from the menu. This will open the Oddsmaker Configuration Menu.
Entry Tab
In the Entry Tab, set a daily Start Time and End Time for your strategy. If you set your Start Time to 9:30 am and your End Time to 4 pm, the strategy will run the entire trading day. If you set your Start Time to 11:00 am, your strategy will only scan for and enter trades from this time on until either the defined End Time is reached or the market closes.
Please note the OddsMaker does not look at any data for the current trading day. It does not backtest in the premarket or postmarket session, only during market hours.
Timed Exit Tab
In the Timed Exit Tab, you can choose an intraday Time Stop or a Multi-Day Time Stop. To close the trade after a specific time in minutes, select the option, Minutes After Entry. Please note, if you set the exit to 30 minutes after entry, but you enter a trade less than 30 minutes before the close, you will exit that trade at the closing price for the day.
Alternatively, you can define a specific Time of Day for your exit. Or you can choose an exit in relation to the Open or Close of the market. This option is particularly useful for swing traders, who like to hold their position for longer.
Risk Management Tab
The Risk Management Tab enables you to define your Exit parameters. You can choose to base a Profit Target per Share and a Stop Loss per Share on Dollar amounts or Percentage values. Make sure to check one or the other before you specify the parameters in more detail below.
Check this box to enable a Wiggle for your Stop Loss. The Wiggle is calculated by multiplying the stock's 15-minute volatility in dollars with its relative volume value, which are both Trade Ideas Filters. The purpose of the Wiggle is to widen the Stop Loss when the stock is trading on higher than average volume. Please note that the Wiggle is not capped and may increase your risk beyond a level that you are comfortable with. Our Brokerage Plus Module, which you will use for live trading, does therefore not have a Wiggle but instead gives you the opportunity to add a defined Offset.
In addition to dollars or percent, you also have the option to base your Target and Stop on a Filter. Only choose a Filter if you are familiar with Filters or Custom Formulas in order execution.
Please note, while the Oddsmaker can compute and utilize the many different Trade Ideas filters as Targets and Stops for your strategy, in live trading, your exit parameters need to be based on static numbers. Trade Ideas does not hold any orders; instead, all orders are immediately sent to the brokerage. In live trading, Stops and Targets can therefore not be based on a value that requires constant monitoring and recalculation, like a moving average or a bar stop. Our Brokerage Plus Module is confined to the order types that brokers offer; our Backtester is not.
Advanced Exit Tab
The Advanced Tab enables you to define Advanced Exit Conditions for your trades. The default setting is None.
You can base a Trailing Stop on a Percentage value or 15-Minute Bars.
For backtesting purposes, you can also create and use an Alert Window to define an Exit-Strategy.
Please note the only Moving Stop our Brokerage Plus Module supports for live trading, is a traditional Trailing Stop. Since Trade Ideas does not hold any orders, our Brokerage Plus Module is confined to the order types that brokers offer.
If you would like to only see backtest results for the filters that are part of your strategy, select, Use Columns from Strategy. Check Use All Available Columns to optimize your strategy from within the Oddsmaker with the help of additional filters.
Set the number of Test Days for your backtest. The minimum period is one day, the maximum 64 days.
Summary Tab
The Summary Tab gives you an overview of your backtest settings.
Please note, Our backtesting tool, as well as most other backtesters, is based on the open, high, low, and close data of 1-minute candles, not on tick-by-tick data. Because of this, you are likely to see discrepancies between testing results and actual trading. The OddsMaker doesn't factor in the spread. In real trading, there is no guarantee that you will get filled at the exact price. Once you have configured your backtest, select Simulate Buy to buy stocks with your strategy or Simulate Sell to short stocks with your strategy.
The next window shows the backtest being performed and its progress. While the Oddsmaker is running through all the different scenarios, the green progress bar indicates how many trades have been winners, and the red bar, how many trades have been losers. Below the chart, you can additionally see the calculated Profit Factor and Win Rate.
Once the backtest is completed, the Oddsmaker Results Window will open.
Oddsmaker Results
The Oddsmaker Results Window will display the name of your strategy in the header. On the top left-hand side of the window, you will see all the alerts and filters contained in your backtested strategy.
If you hover over an icon, its name, as well as the filter value, will be displayed.
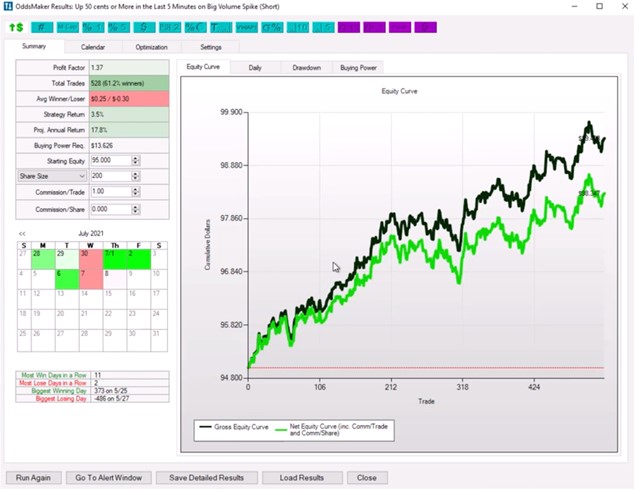
Summary Tab
The Summary Tab gives you a detailed insight into the performance of your strategy.
The Profit Factor is calculated by dividing the sum of all profits by the sum of all losses. If the Profit Factor is greater than 1, the strategy has generated a profit. If it is below 1, the strategy has generated a loss. Most traders aim for a strategy with a Profit Factor of 2 or more.
The Summary Tab displays the total number of trades performed in the backtest and the Win Rate in percent.
You can compare the Average Winner versus the Average Loser and see the Strategy Return as well as the Projected Annual Return.
The fields that result in a positive outcome are displayed in a shade of green, the fields that are problematic are displayed in shades of red. Lighter green shades equal smaller profits. Darker green shades equal larger profits. The same is true for the strategy being unprofitable, which is displayed in lighter and darker shades of red.
The Summary Tab displays the Buying Power that the strategy required during the backtest.
You can define the amount of Starting Equity based on your account size. This amount affects the strategy return and the projected annual return. If the required Buying Power is greater than four times the Starting Equity, which is the leverage most brokers allow, the Starting Equity field will turn red.
You can base your Position Size on Dollars per trade or Shares per trade. Select dollars if you typically buy the same number of shares, regardless of price. Select percent if you typically buy a specific dollar amount, regardless of the number of shares.
You can also factor in the Commission that your brokerage charges per trade as well as per share.
Small Calendar
The small Calendar on the bottom left-hand side of the Oddsmaker Results Window displays the daily performance of the strategy. Each day is color-coded. If there were no trades, the background would be white. If the trades were overall profitable, the day would appear with a lighter or darker shade of green. Lighter shades equal smaller profits. Darker shades equal larger profits. The same is true for losing days which appear in shades of red.
Hover your mouse over a day to see more details, including the Win Rate in percent and by the number of trades, the total Profit for the day, as well as the Average Gain. While you hover, the section of the Equity Curve, the Daily, the Drawdown, and the Buying Power for that day will be highlighted.
If a multi-day strategy is backtested, the checkbox Use Exit Date is shown below the calendar. By default, the calendar day will show the trades that were entered on that day. Checking this option will reload the calendar and show the exited trades instead.
Double-click on a calendar day to open the Oddsmaker Trades Window, which provides detailed information about the Symbols traded, the Alert Type, the Entry and Exit Time for each trade, the Entry and Exit Price for each trade as well as the Share Size and the Gross Profit.
Below the calendar, the numbers and dates for the Most Winning Days in a Row, the Most Losing Days in a Row, as well as the Biggest Winning Day and the Biggest Losing Day, are listed.
Equity Curve
The Equity Curve shows the change in your total equity over the simulation period. Most traders are looking for a smooth, upward-sloping equity curve. Oftentimes a look at the equity curve can identify problem areas that might not be obvious by looking only at the metrics. It clearly shows you the dips and, herewith, the possible pain you might feel during losses. A good Equity Curve has a 45-degree straight angle without deep dips. The curves also make it easy to see the effect that commissions have on the strategy. The lighter green curve shows the Net Equity, including Commissions. The darker green curve shows the Gross Equity.
Whenever you adjust your starting equity, the position size, or the commission, the equity curve will adjust accordingly.
Daily Graph
The Daily Graph shows you how much profit or loss you would have made each day with this strategy. The x-axis displays the day. The y-axis displays the Profit or Loss in Dollars. Green shows a profitable day, red a losing one. The section below is displaying the number of Trades per Day. If you hover over the small calendar on the left-hand side, the day’s section in both graphs of the Daily Tab will be highlighted. As a trader, you would like to see continuity between winning and losing days.
Drawdown Graph
The Drawdown Graph provides insight into the downside risk over the simulation period. Large drawdowns are what makes traders quit trading. While there is no way to completely eliminate drawdowns, you should understand what kind of drawdowns are likely and size your positions accordingly. If your strategy never lost a penny, the drawdown would be zero percent and reside at the level indicated by the red line.
Buying Power Graph
The Buying Power Graph shows the maximum buying power required throughout the simulation period. Strategies that hold many simultaneous positions will require more buying power. This graph can help you determine how much money you would need to allocate to trade every signal that appears. It is showing you how much buying power you would require if you wanted to be in every single trade, even on the busiest day.
Calendar Tab
The Calendar Tab displays the daily performance of the strategy. Each day is color-coded. If there haven’t been any trades, the background will be white. If the trades were overall profitable, the day will appear with a lighter or darker shade of green. Lighter shades equal smaller profits, darker shades equal larger profits. The same is true for losing days which appear in lighter and darker shades of red.
Each day shows the Win Rate in percent and by the number of trades, the total Profit as well as the Average Gain for the day. Hover over a day, to bring up a list of the 5 Most and Least Profitable Trades for that day.
Double-click on a calendar day to open the Oddsmaker Trades Window, which provides detailed information about the Symbols traded, the Alert Type, the Entry and Exit Time for each trade, the Entry and Exit Price for each trade as well as the Share Size and the Gross Profit.
If a multi-day strategy is backtested, the checkbox Use Exit Date is shown below the small Calendar on the bottom right-hand side of the Summary Tab. By default, the calendar day will show the trades that were entered on that day. Checking this option, will reload the small Calendar as well as the Calendar Tab and show the exited trades instead.
Optimization Tab
The Optimization Tab enables you to drill down and analyze in detail which filter values are impactful. Amongst others, you can assess factors like Price intervals, Time of Day, and Symbols traded.
You can analyze the effects each filter has on the Profit Factor, the Win Rate, the Average Gain per Trade, the Total Gain, and the Number of Trades. And break each filter’s values down into intervals to see which settings perform the best.
Price, Time of Day, and Symbols have their own tabs for easy access. Any other available filter can be found in the Other Filters Tab.
The Optimization Tab enables you to break down your filter values into segments. The Price Range can be widened or shortened via the Price Interval field. The Time Period can be adjusted the same way in the Time of Day Tab via the Minute Interval Field, and the same is true for all other filters.
The Having at Least field below enables you to remove filters that only result in a few trades. Use this field to hide segments that don't have a statistically significant number of trades.
All the other filters that are part of your strategy are located in the Other Filters Tab. If you have selected Use All Available Columns in the Advanced Tab of the Oddsmaker Configuration Window, the Other Filters Tab will display all the available Trade Ideas filters in the dropdown. This gives you the ability to go through each and every filter and determine the values that have the greatest impact on your strategy.
Double-click on any of the numbered segments to bring up a list with all the associated trades.
The Graph on the right-hand side mirrors the results for Profit Factor, Win Rate, Average Gain per Trade, Total Gain, and Number of Trades and displays them visually. The numbers below the Graph are linked to the filter segments on the left-hand side. The dropdown menu above the Graph enables you to select one of the five performance criteria for visual analysis. The red line on the graphs indicates equilibrium. For the Profit Factor Graph, for example, the red line is drawn at 1 because above indicates overall profit and below indicates an overall loss.
You can use the insights the optimization tab is providing to make changes to your strategy via the Alert Configuration Window. An easy way to do this is to duplicate the current Alert Window, then make your adjustments and run the Oddsmaker again to see if and how the strategy improved. Repeat this process until your desired results are achieved.
Trade Ideas Users have over 500 Alerts and Filters at their disposal to create customized scans. Visit our Alerts & Filters page for a detailed explanation of each of them.

Settings Tab
The Settings Tab displays the configuration settings for this Oddsmaker run.
The Collaborate option enables you to share the strategy with your colleagues and friends.
Run Again
Select Run Again to bring up the Oddsmaker Configuration Window and run another backtest with adjusted settings.
Go to Alert Window
Select Go to Alert Window, to bring up the Alert Window.
Save Detailed Results
Select Save Detailed Results to save the backtest data as a CSV file on your PC. Please note, the saved data only contains the trade data, not the configuration settings. To save the configuration settings, save your Alert Window to the Cloud.
Load Results
You can make changes, to the saved Oddmaker CSV file, and import it back into the Oddsmaker thereafter by selecting, Load Results.
Close
Select Close to quit the Oddsmaker.
The Market Explorer
The Trade Ideas Market Explorer is a sophisticated tool that enables us to build dedicated high-performance scans for our users beyond the software’s boundaries.
To access the Market Explorer, go to the Toolbar, open the New Tab and select Market Explorer Window.
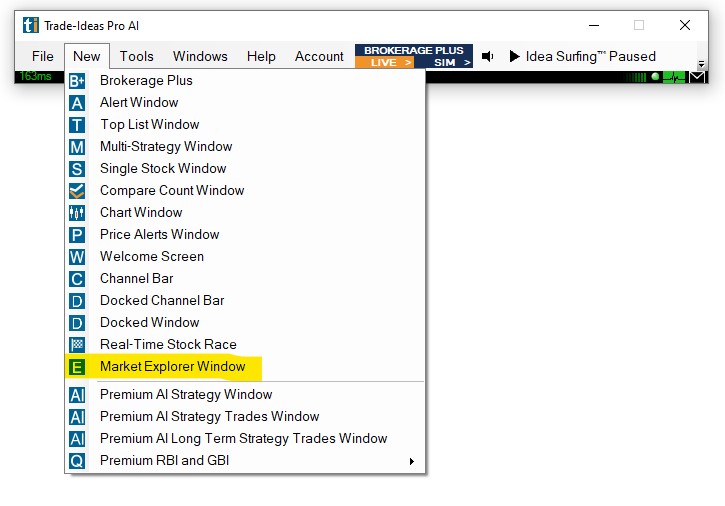
This will load the My Market Explorer Strategy Window.
To access the available scans right-click into the window and choose Select Strategy.
Then, select a scan from the dropdown.
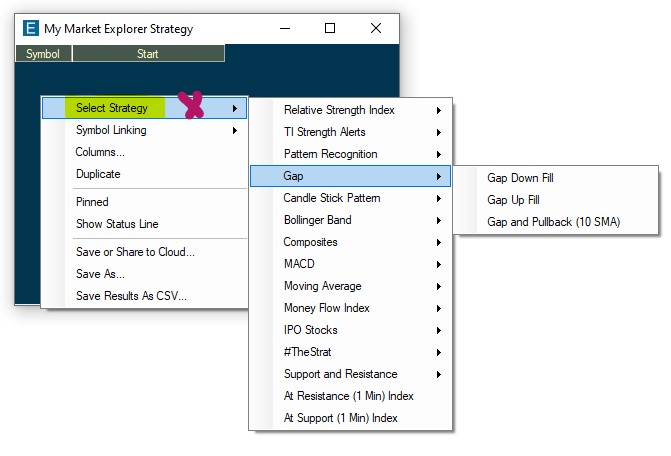
Current ME Scans
Relative Strength Index
TI Strength Alerts
Pattern Recognition
Gaps
Candlestick Patterns
Bollinger Band
Composites Day Trading
Composites Swing Trading
MACD
Moving Averages
Money Flow Index
IPO Stocks
The #Strat
Support and Resistance
RSI Divergence Long/Short
This ME scan monitors daily charts for RSI divergences. An RSI Divergence occurs, when the Relative Strength Index starts reversing before the price does. The stock makes a new high or low in terms of price, but the RSI value does not correspondingly increasing/decreasing. This could indicate that the buyers/sellers are potentially running out of steam. Simply put, an RSI divergent strategy is a revision to the mean strategy using the Relative Strength Index as the momentum indicator. Traders often combine this strategy with technical patterns to spot reversal points.
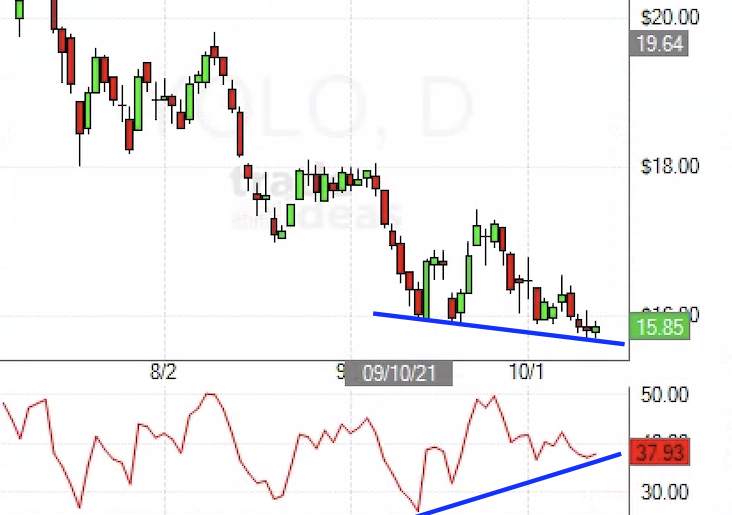
Michael Nauss of Trade Ideas discussing RSI Divergence on Trader TV:
TI Strength
TI Strength is a relative strength system that uses a series of indicators and technical patterns to detect and trade the strongest stocks in the market. Combine this backtested system with technical analysis to ensure that you are trading the market’s current strongest names.
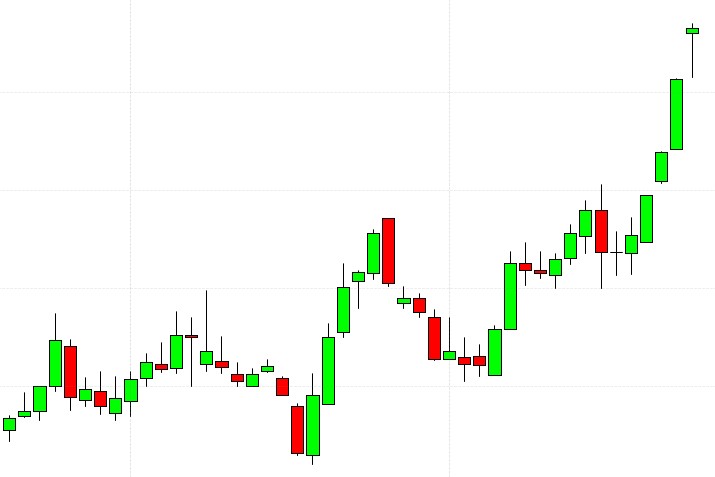
Michael Nauss of Trade Ideas discussing our TI Strength Alerts Scan and Newsletter:
Bull/Bear Flag
Bear and Bull Flags are classic technical patterns on the daily chart. This ME strategy is looking for stocks that made a recent move higher (Bull Flag) or lower (Bear Flag) and thereafter move sideways for a few days. This consolidation gives traders a well-defined area to enter in the direction of the trend as well as a well-defined support level.
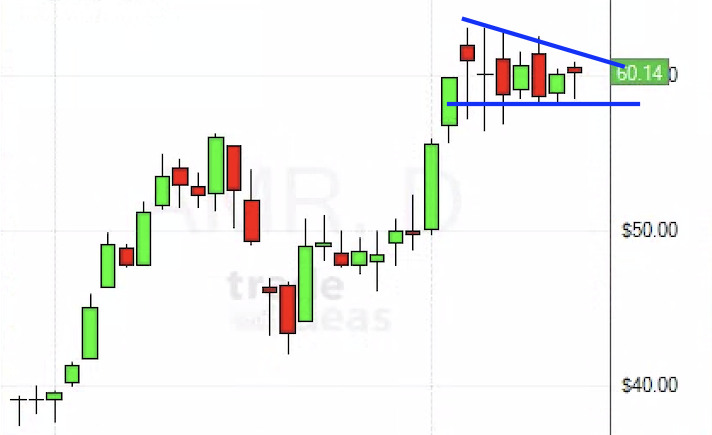
Gap Up/Gap Down Fill
This ME Strategy is looking for large gaps to be filled, meaning for the price to move back to the starting point of the gap. Gaps occur unexpectedly, they form on a chart, when the price of a stock moved sharply up or down, with little or no trading in between. These levels often act as support/resistance since funds that missed the move might get in. Due to the lack of immediate support/resistance, a stock that starts to fill the gap seldom stops. Gap-fill stocks are considered filled when their price retreats to the original pre-gap level.
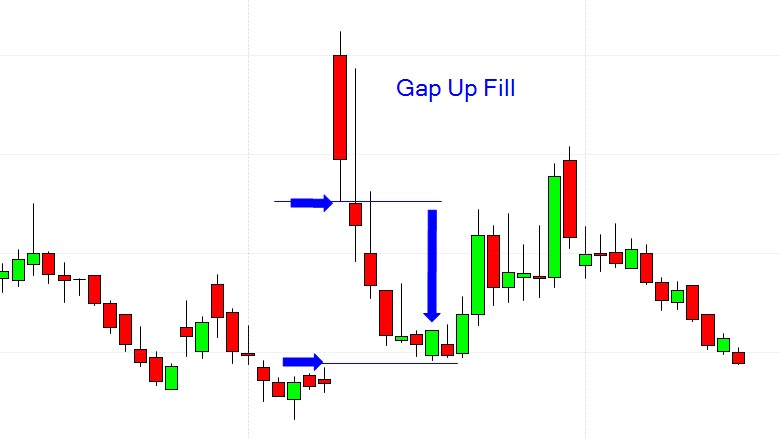
Michael Nauss of Trade Ideas discussing Gap Fill Trading on Trader TV:
Gap and Pullback (10 SMA)
Here's another scan focussing on Daily Gaps, but this time, we aren't looking for gap fills, we're looking for the 10 SMA to act as a support, and the stock to hold its gap. Price can catch up to an SMA in two ways: Either by pulling back, or by moving sideways. No matter how the catch-up happens, look for the 10 Day Moving Average to act as support and to provide a good entry level.
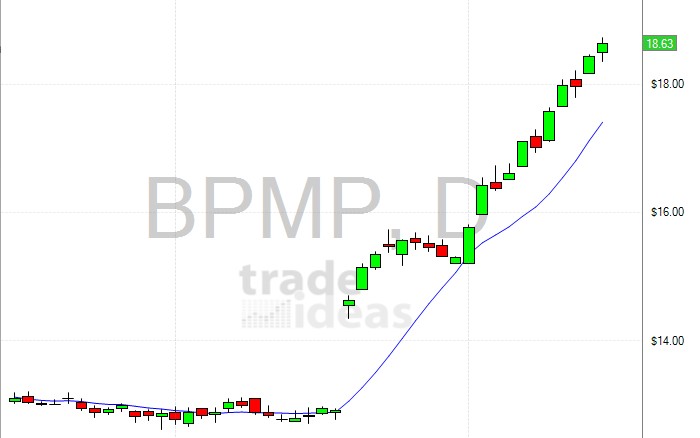
Three Line Strike (Short/Long)
The Three Line Strike ME Strategy is scanning the market for stocks that had 3 down days/up days in a row which are followed by an engulfing candle that erases all the previous selling/buying pressure in one fell swoop. The idea behind this scan is to find trapped sellers/buyers who could fuel the move.
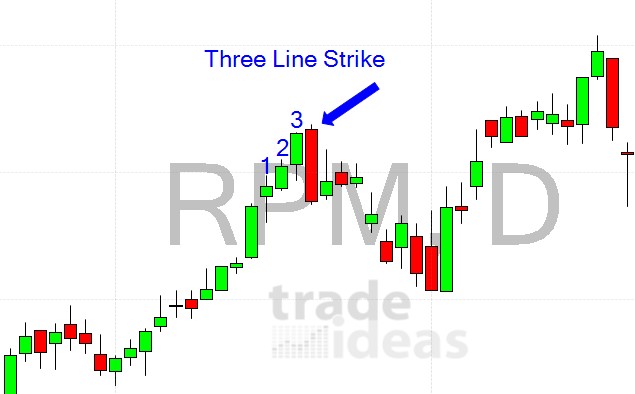
Inside Bar & Inside Day
These scans are looking for stocks where the current bar is trading within the previous bar. Inside Bars can be very useful for trend continuation setups since any inside bar represents a consolidation on a lower timeframe.
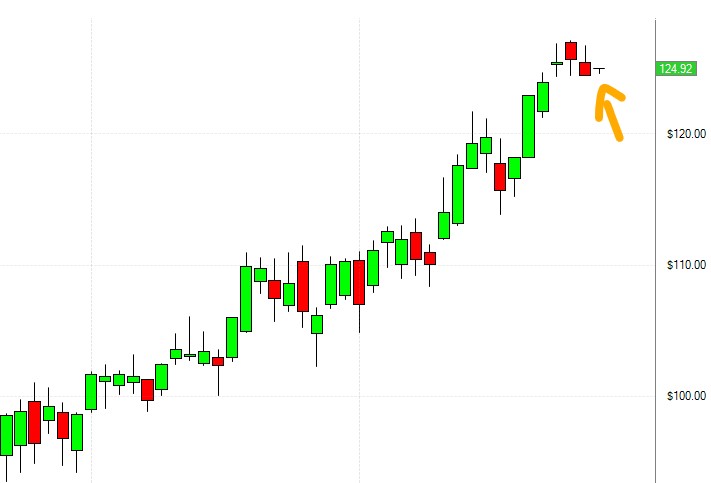
Abandoned Baby
Mother Bar
In this setup we are looking for one large bar that starts to contain many small candles. The idea is that the small bars represent resting after a large move. We are looking for and are awaiting continuation of this move.
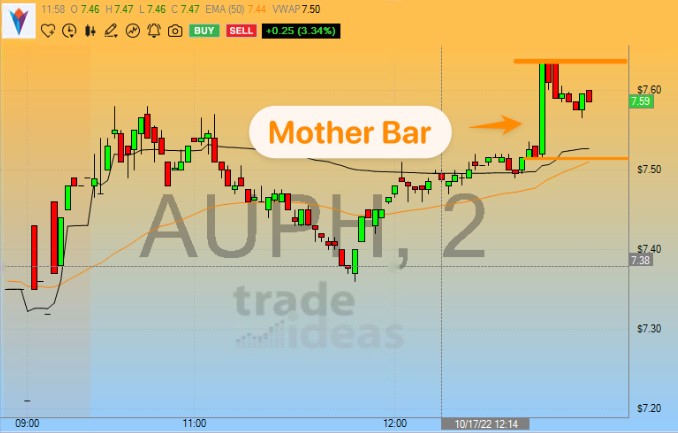
Bollinger Band Squeeze aka TTM Squeeze
The Bollinger Band Squeeze works off the idea that volatility is mean reverting. With the help of the standard Bollinger Bands, this scan detects setups where the price action is unusually tight in comparison to how the stock normally trades. Traders assume that the stock will eventually breakout in one direction or the other.
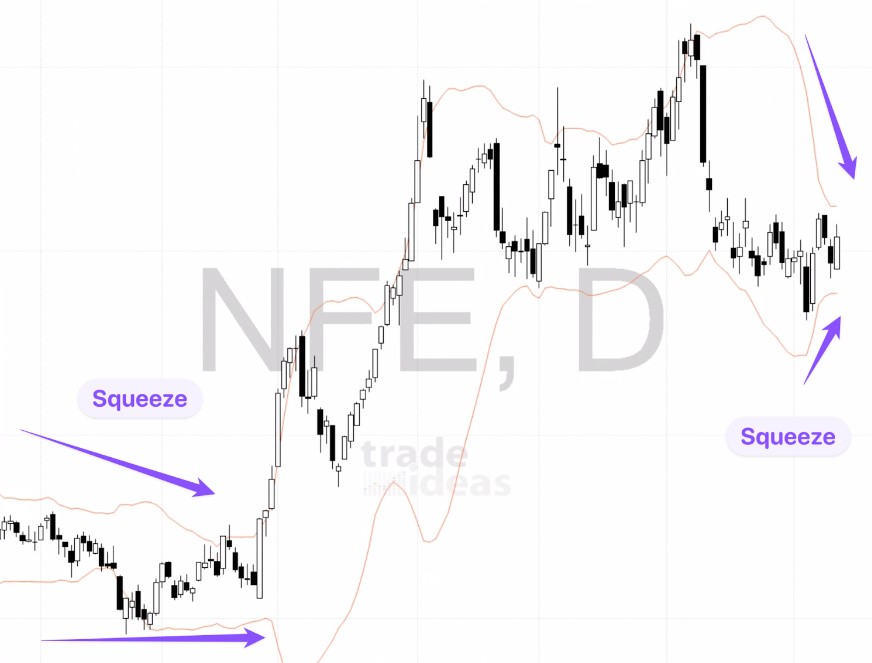
Breakdown Stabilization
This is a play from out very own CEO! The Breakdown Stabilization scan is looking for stocks that are selling off in the first 30 minutes after the open, but then start basing at the low of this range. This range often becomes well tradeable with clearly defined support levels to play off of.
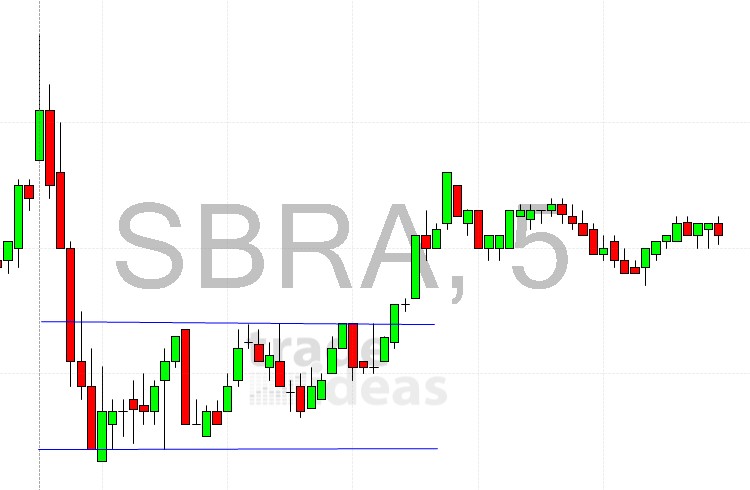
2 Minute Opening Power Bar
We define a Bullish Opening Power Bar as a wide range bar that opens near the low of its range and closes near the high of its range. A Bearish Opening Power Bar, conversly, is defined as a wide range bar that opens near the high of its range and closes near the low of its range. Traders use these Opening Power Bars as confirmation that major buying or selling is coming into a stock on the open.
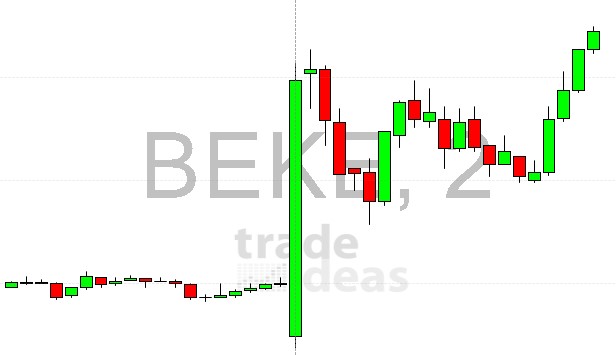
Closing Range Breakout
The ME Closing Range Breakout scan is another 3-step setup.
Step 1: Relatively narrow closing range (in the last 30 min of the trading day).
Step 2: Small gap down below the closing range
Step 3: Breakout above the closing range.
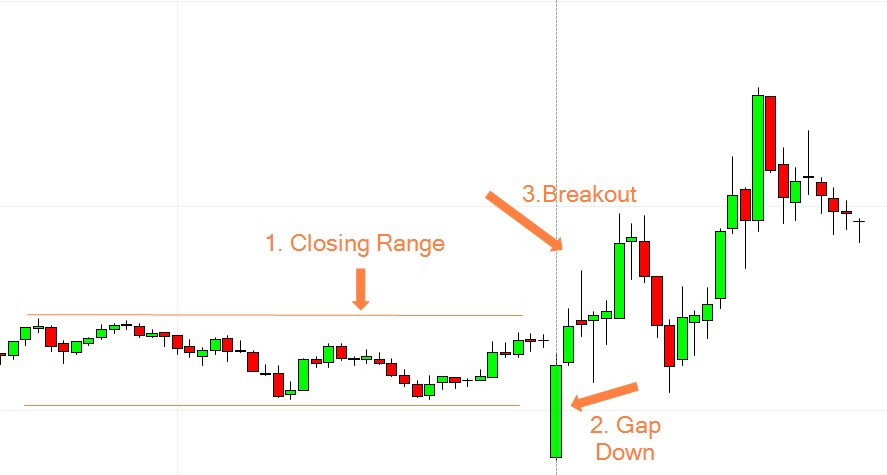
ABC Up & ABC Down
The ABC Up scan is looking for a 3 step intraday pattern:
Step 1: An initial push up
Step 2: A downward move that fails to make a new low of the day.
Step 3: The stock retracing back to highs.
The ABC Down scan is looking for a 3 step intraday pattern:
Step 1: An initial push down
Step 2: An upward move that fails to make a new high of the day.
Step 3: The stock retracing back to lows.
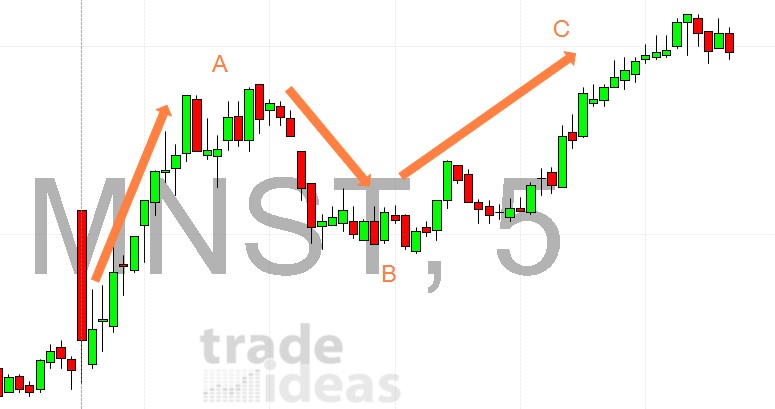
Strong Stock Pulling Back
This ME scan is looking for stocks that have been in uptrends on the daily chart, but are now pulling back sharply. This scan is very useful for trend-following pullback traders.
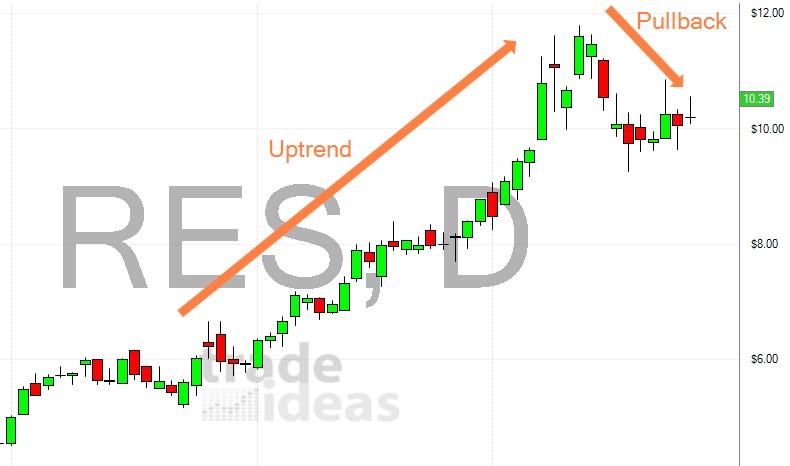
MACD Trend Play
The MACD is a trend-following indicator. This ME scan is looking for the MACD to generate a buy signal by crossing up, while already indicating an uptrend by being above the zero line.
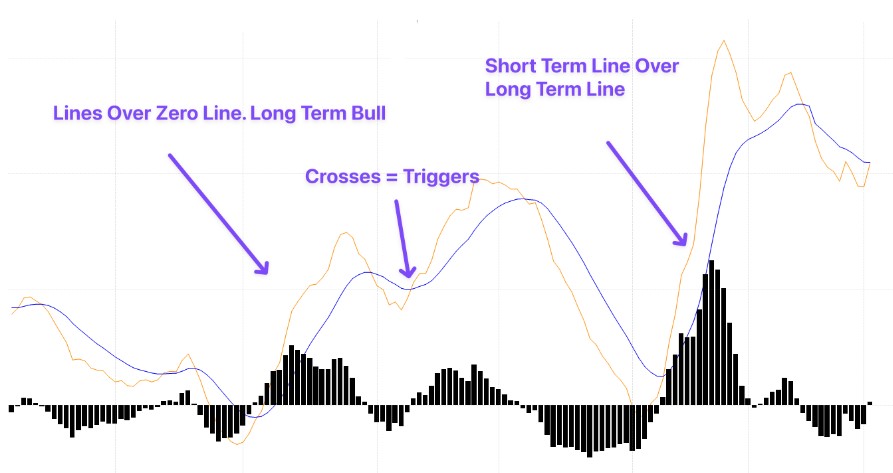
MA Cross Buy/Sell Signal
These ME scans are looking for a simple EMA/SMA Cross of the 13 Exponential Moving Average and the 50 Simple Moving Average. Moving Average Crossovers might indicate a potential short-term trend change. Traders use these crosses as trade signals. This scan is available for different time frames.
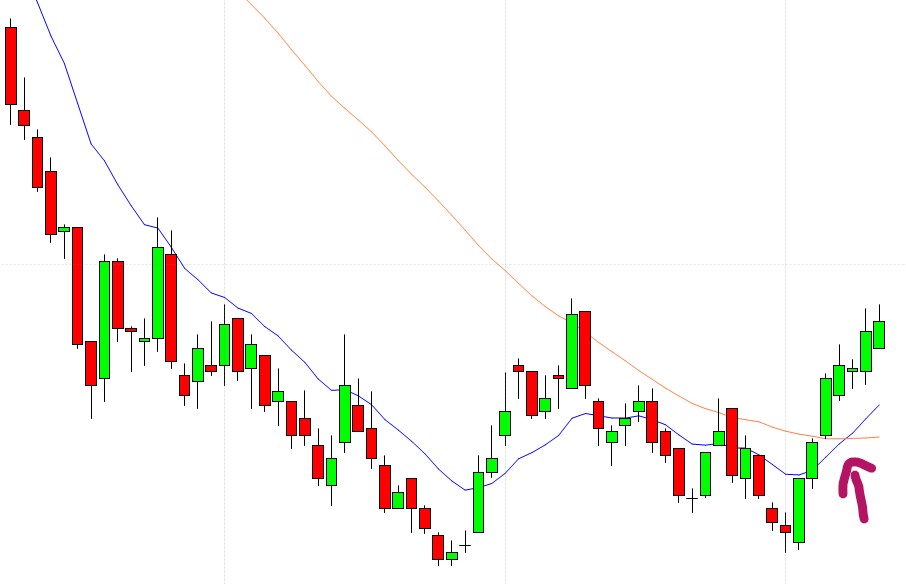
8/21 EMA Trend Pullback
10 SMA Play
This scan uses the 10 SMA as a pullback point. We are looking for stocks to trade above the 10 SMA, and then to pullback to it. The idea is that these stocks find support at the 10 SMA as a way into a longer term trend.
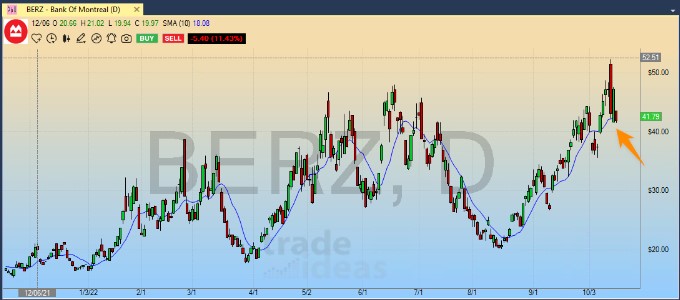
Golden Cross
The Golden Cross setup is a very old trading system that is still followed today. The 50 Moving Average crossing over the 200 Moving Average is seen as a signal for a long-term bullish uptrend in this strategy. Golden Cross Traders expect a continuation of the trend.
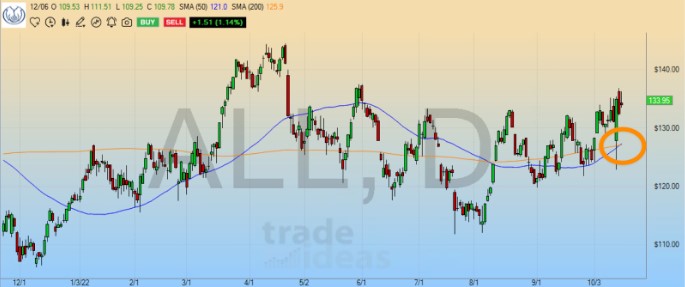
MFI Divergence Long/Short
The MFI Divergence Scan monitors daily charts for divergences between the stock's price and the Money Flow Index. A divergence occurs when the MFI indicator and the price are moving in opposite directions. The stock makes a new high or low in terms of price, but the MFI value does not correspondingly increasing/decreasing. The idea being that the most recent move took less “power” than the previous one, this divergence could be a signal for an upcoming reversal. Buyers/sellers might be running out of steam.
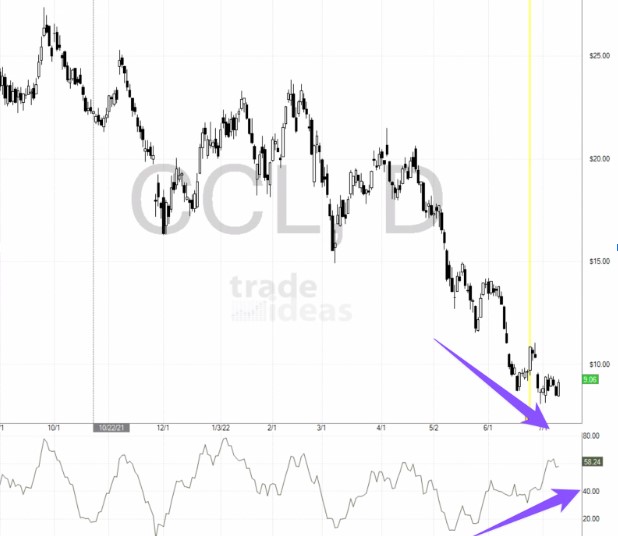
Recent IPOs
We define a recent IPO as a stock that has been trading for less than 400 days. This includes stocks coming back onto exchanges due to restructuring or prior SPACS.
This scan lists these IPOs as long as they trade an Average Volume of 250k. The IPOs are ranked on Distance from Lifetime High descending. You can easily change the sorting by double-clicking the header columns you wish to sort by.
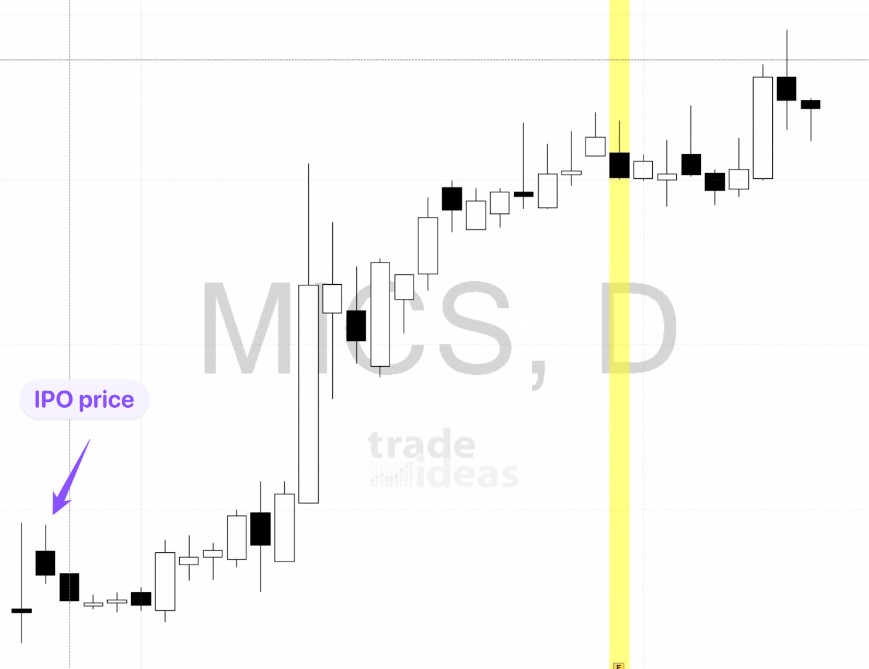
Close to IPO Price
#TheStrat
#TheStrat is a Price Action Trading Strategy developed by Rob Smith that categorizes candlesticks into three types.
In summary:
The colour of the body of the candle does not matter.
Each candle is defined by its relationship to the previous candle.
A “1” is an inside bar where neither the high nor low of today’s bar has broken yesterday’s bar. An inside candle shows the market is at a point of indecision.
A “2” is a bar that has broken either the high OR low of the prior bar, but not both. Also know as a directional bar.
A “3” is a bar that has broken both the high AND low of the bar before it. Also known as an outside bar. An outside candle shows broadening price action.
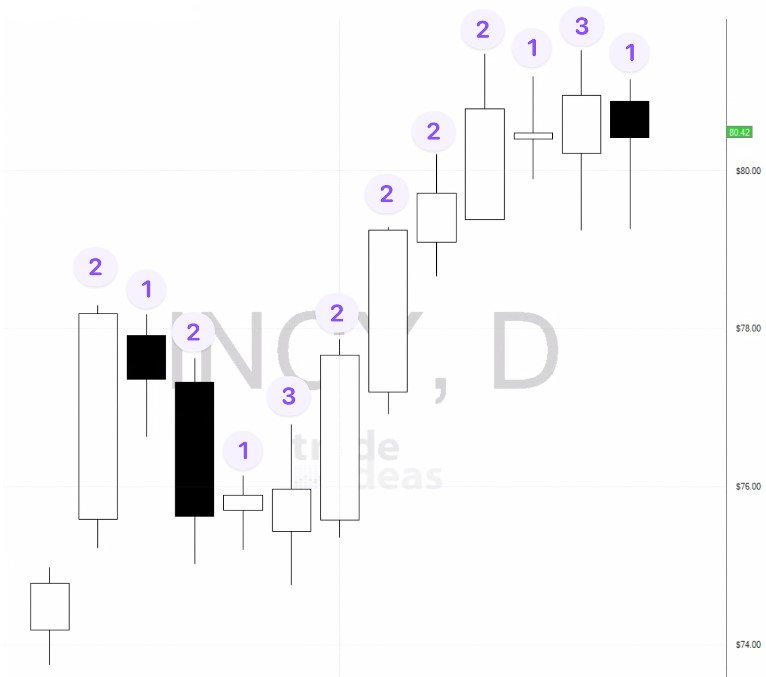
The individual #TheStrat ME scans are named according to the setup they are detecting.
The ME scan 2D-1 on Strong Stock indicates, that the prior bar is a down bar, the current bar is an inside bar and the stock is overall strong.
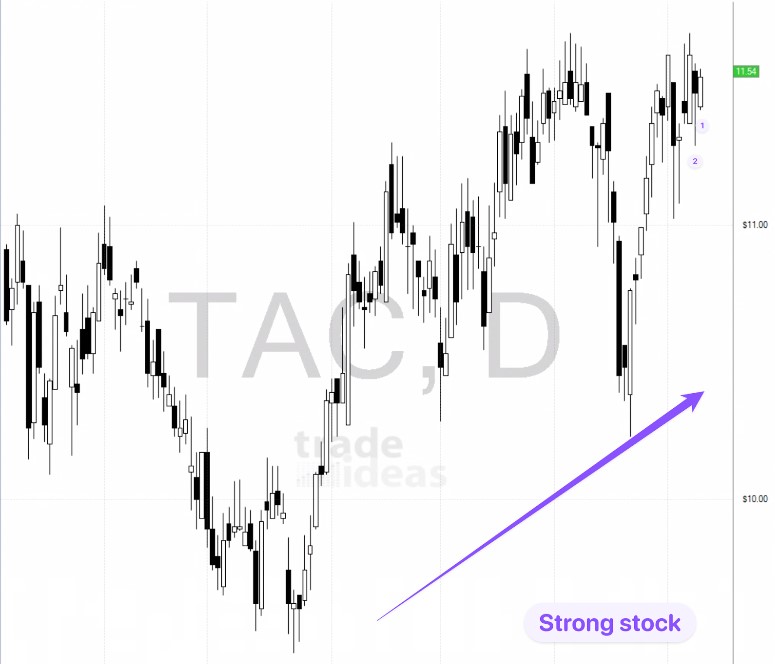
Double Inside Day
A daily inside bar occurs when the second days range is completely inside the first day's price range. The high of the second day is lower than the first, and the low of the second is higher than the first. Instead of one inside bar, this ME scan is looking for two consecutive inside 2 bars. The idea being that the more consecutive inside days you have the tighter price is getting, the more poised it becomes for a breakout. During the formation of this pattern, there is no clear winner in the buyer/seller battle.
Inside days show a contraction in volatility and are often a continuation pattern.
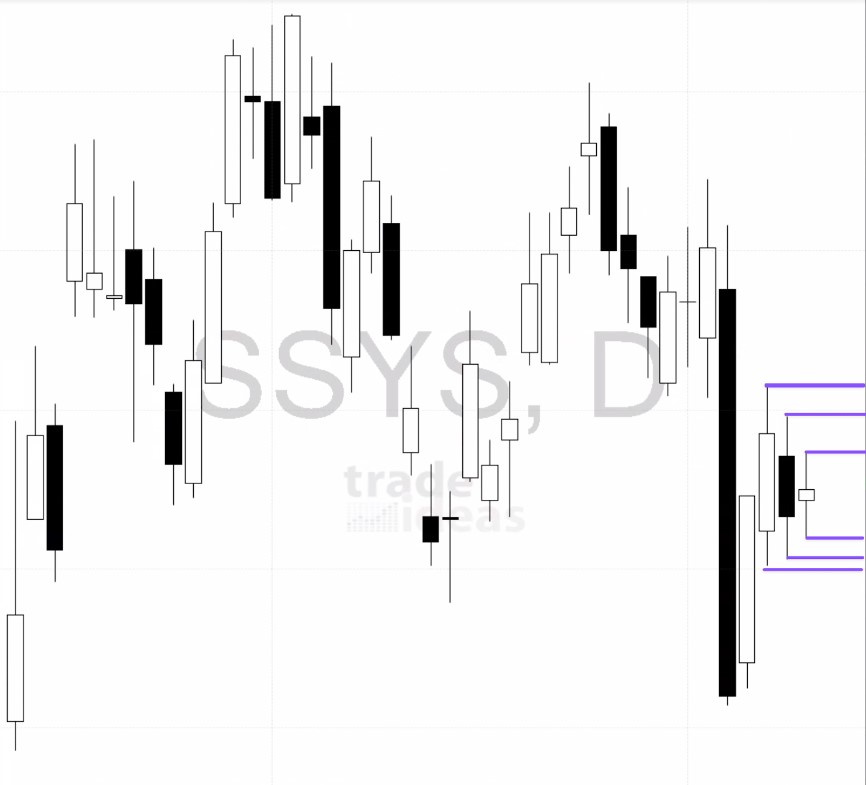
Support/Resistance.
In these scans we are using some pattern recognition algorithms to find classic support and resistance levels. We define these as areas where buyers/sellers took control to push the price up/down. This is the simplest form of trading since you are playing off areas with known buyers and sellers.

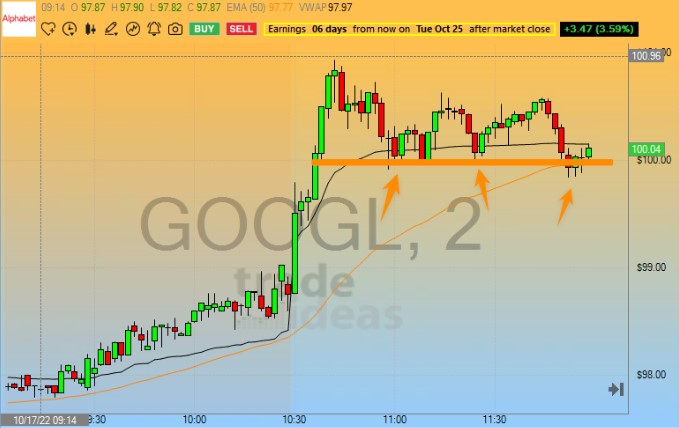
Retest of the Breakout / Throwback to the Breakdown
These ME scans are looking to find stocks that have broken out of a prior resistance area and are now finding support in that area. Traders commonly use this setup to buy into an uptrend at an important price level.
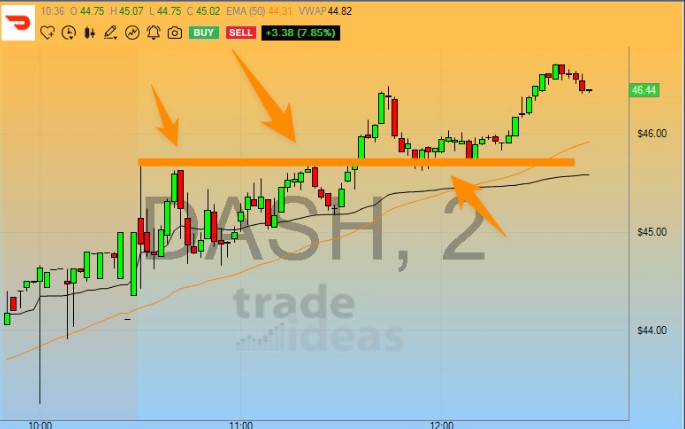
Failure to break Support/Resistance
This is a great Support/Resistance setup in which we wait for a stock to get to a support level and to breakdown, but then to quickly rally back up. A move like this can trap shorts/longs who then would fuel the move.
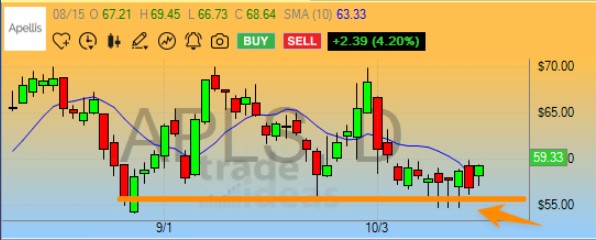
TI Wave: Buy & Sell Chart Signals
TI Wave is a powerful AI-driven trend indicator designed to make trend-following simple, intuitive, and accessible.
Whether you're a seasoned trader or just starting, TI Wave provides clear buy and sell signals directly on your charts, helping you stay in the trend longer and exit when it's time to move on.
TI Wave works on any stock and any time frame, leveraging cutting-edge adaptive moving average cloud algorithms, and advanced analytics. It's your companion for identifying trend changes, staying on the right side of the market, and managing your trades with confidence.
How to Enable TI Wave
To activate TI Wave on your charts, follow these steps:
Step 1: Ensure You’re using the latest TI Pro Version
TI Wave requires Trade Ideas version 5.6.104 or later.

You can check your version by navigating to the Toolbar Bar > Help > About:

Step 2: Activate the Browser Interface on your chart
Right-click on your chart, and ensure the Browser Interface is enabled.
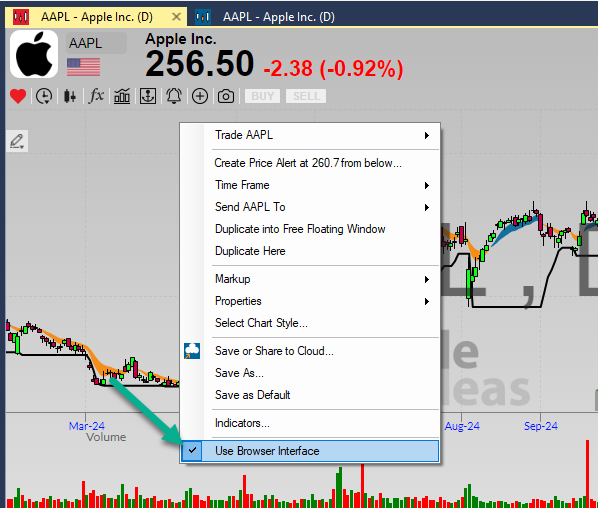
When the option Browser Interface is checked, you'll see a bar icon in the top-left corner of your chart:
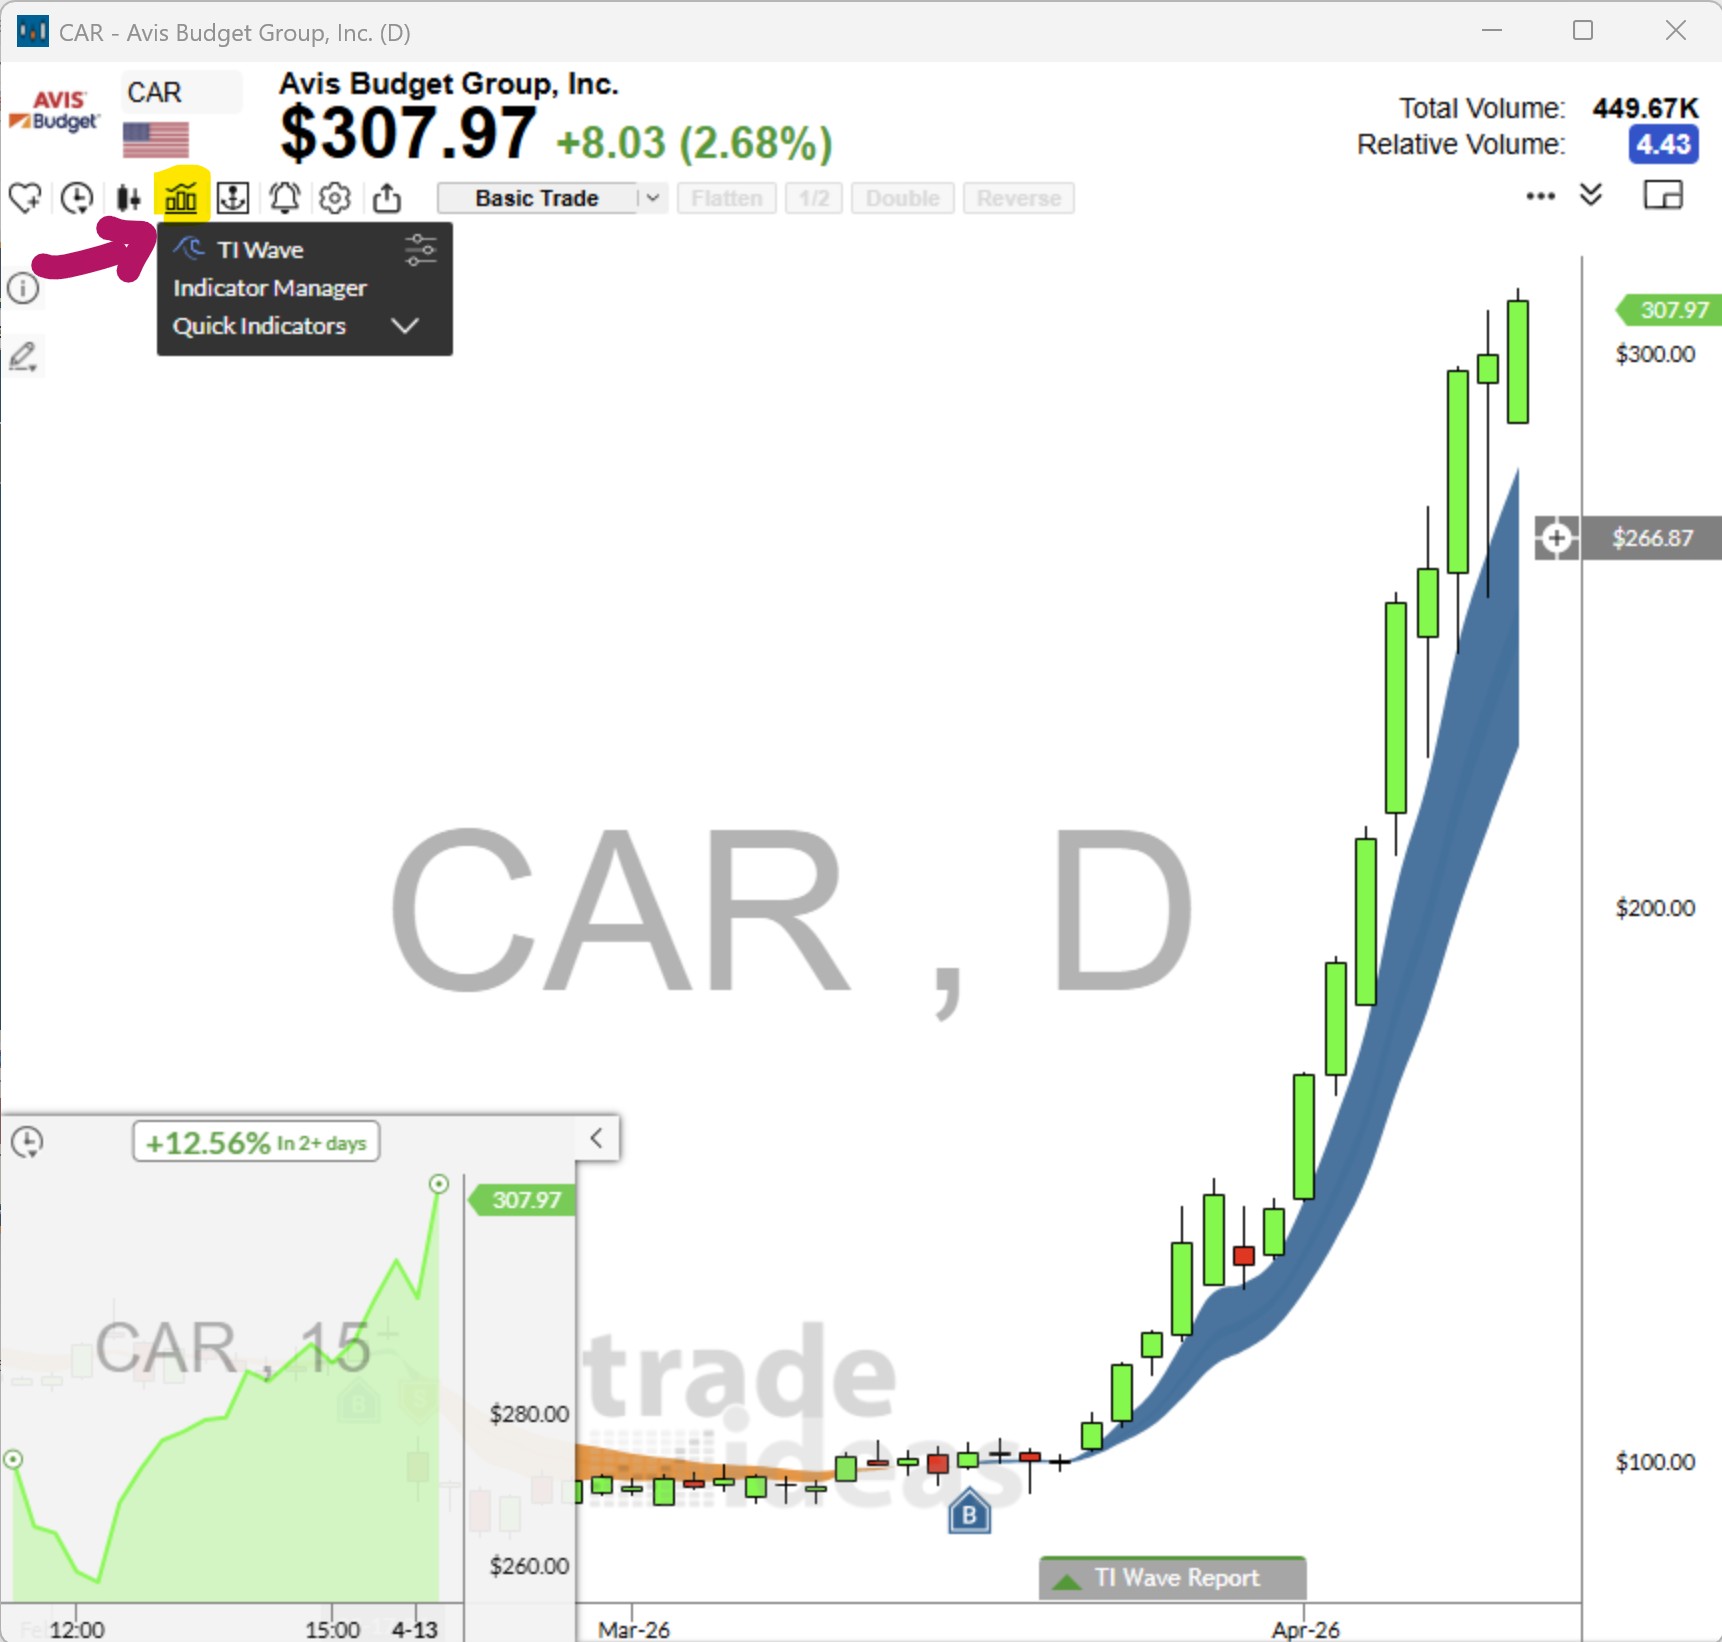
Step 3: Apply TI Wave to Your Chart
To add TI Wave Buy and Sell signals to your chart, click the bar icon and select TI Wave from the list.
Step 4: TI Wave Settings
Adjust how many past signals are displayed by accessing the TI Wave Settings via the bar menu.
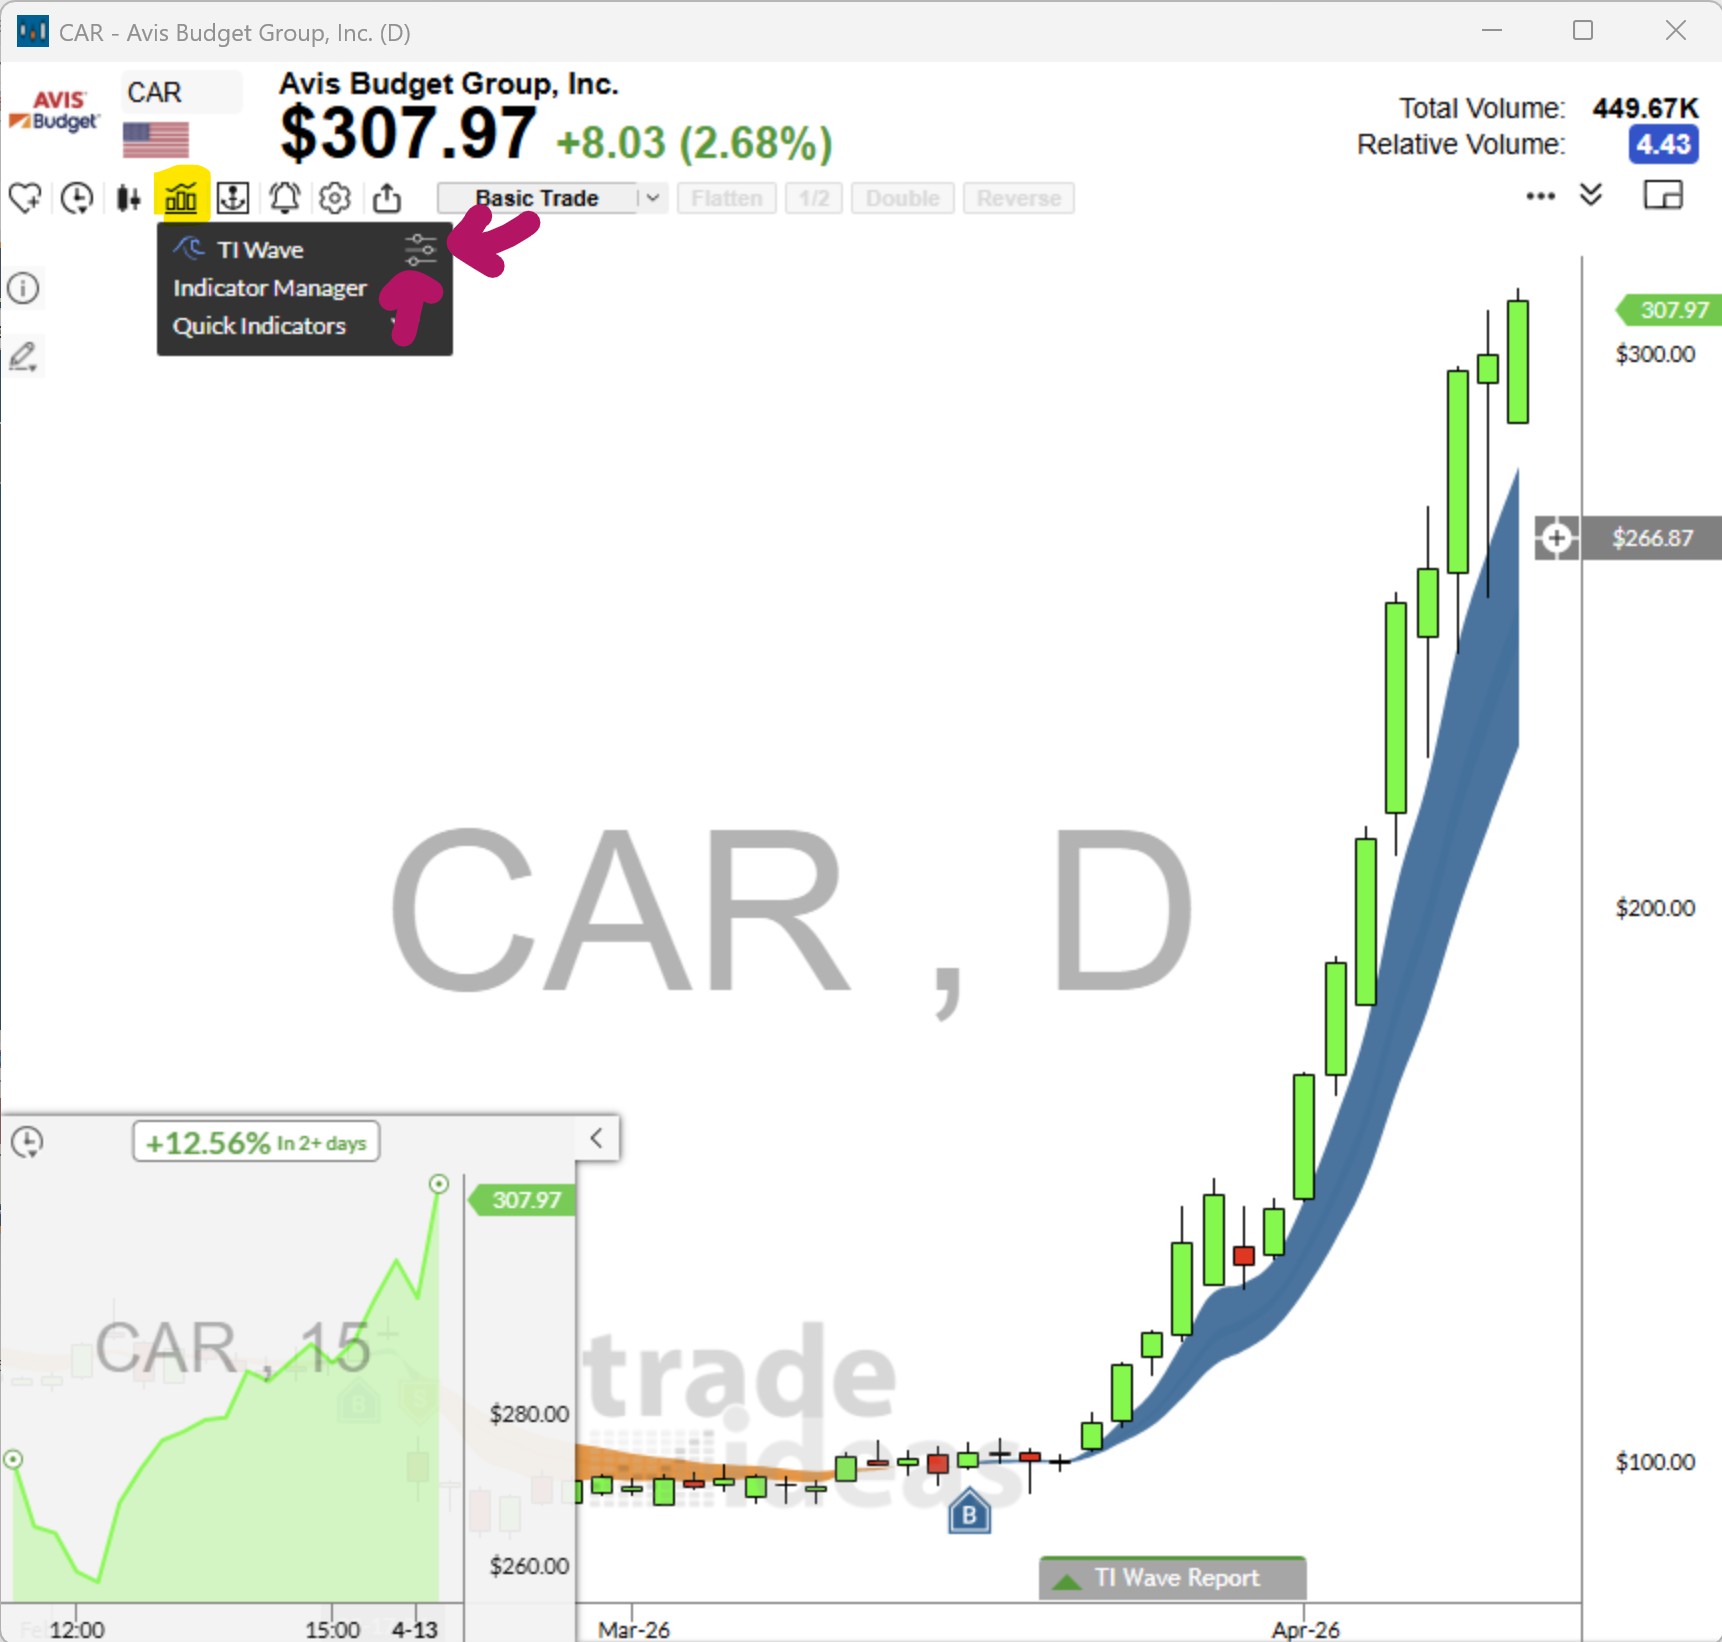
Prefer a cleaner look? You can hide the buy/sell markers and focus solely on the trend clouds or opt to only see the last two TI Wave trades.
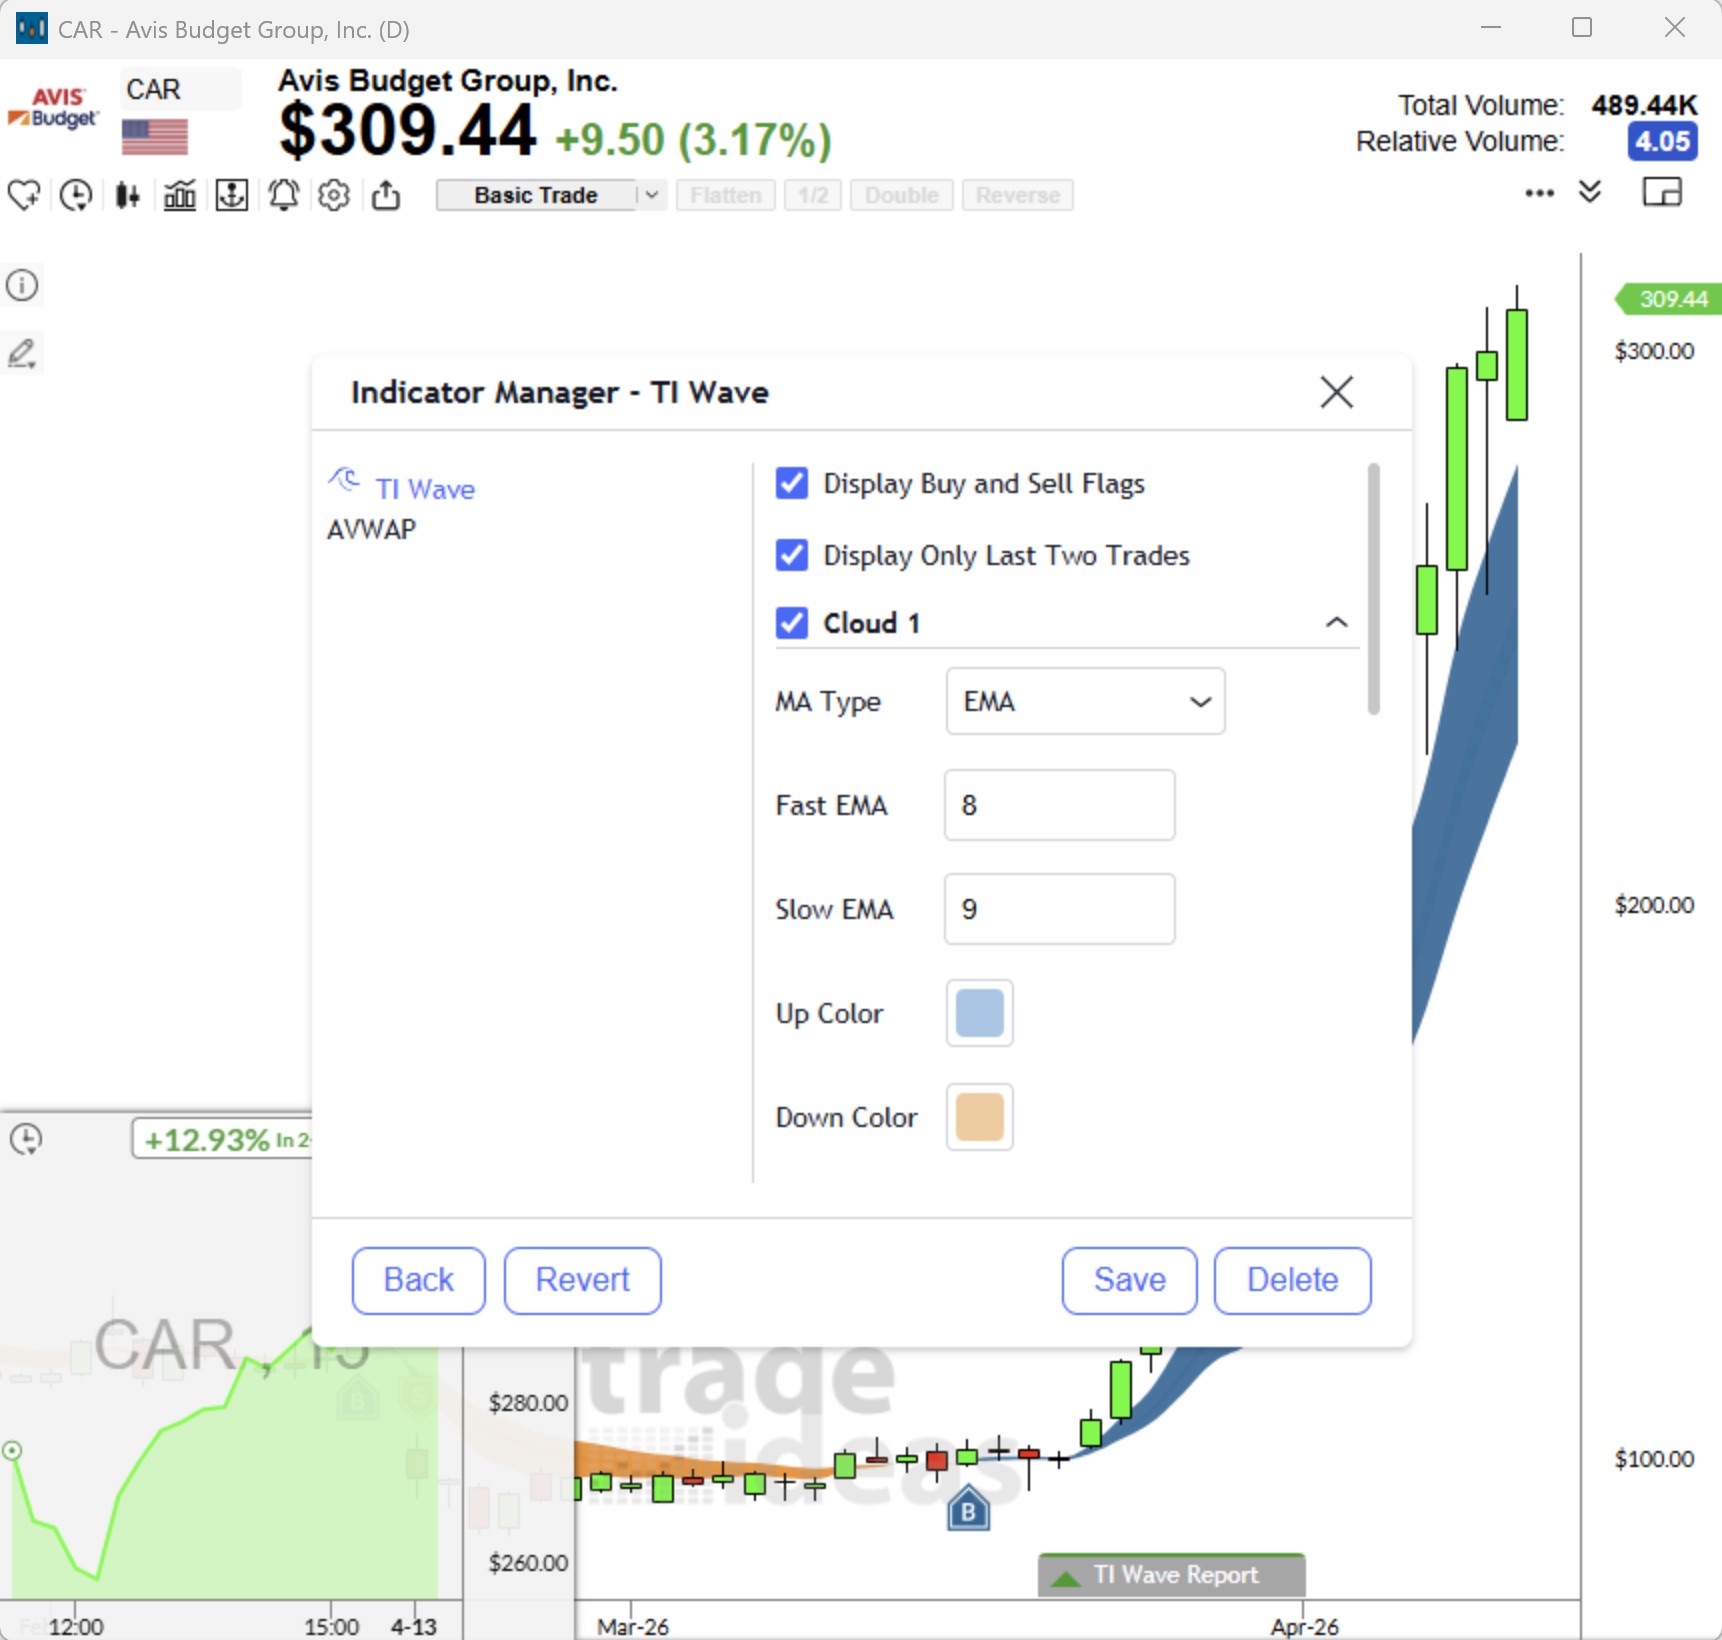
Scans for TI Wave Signals
We’ve made it even easier to find opportunities with built-in TI Wave scans, available in our Market Explorer. These scans focus on stocks showing strong trends while filtering out low-volume or less relevant symbols. Although they’re not customizable yet, they provide a curated list of stocks primed for TI Wave analysis.
- Open the Market Explorer from the Toolbar bar > New > Market Explorer Window
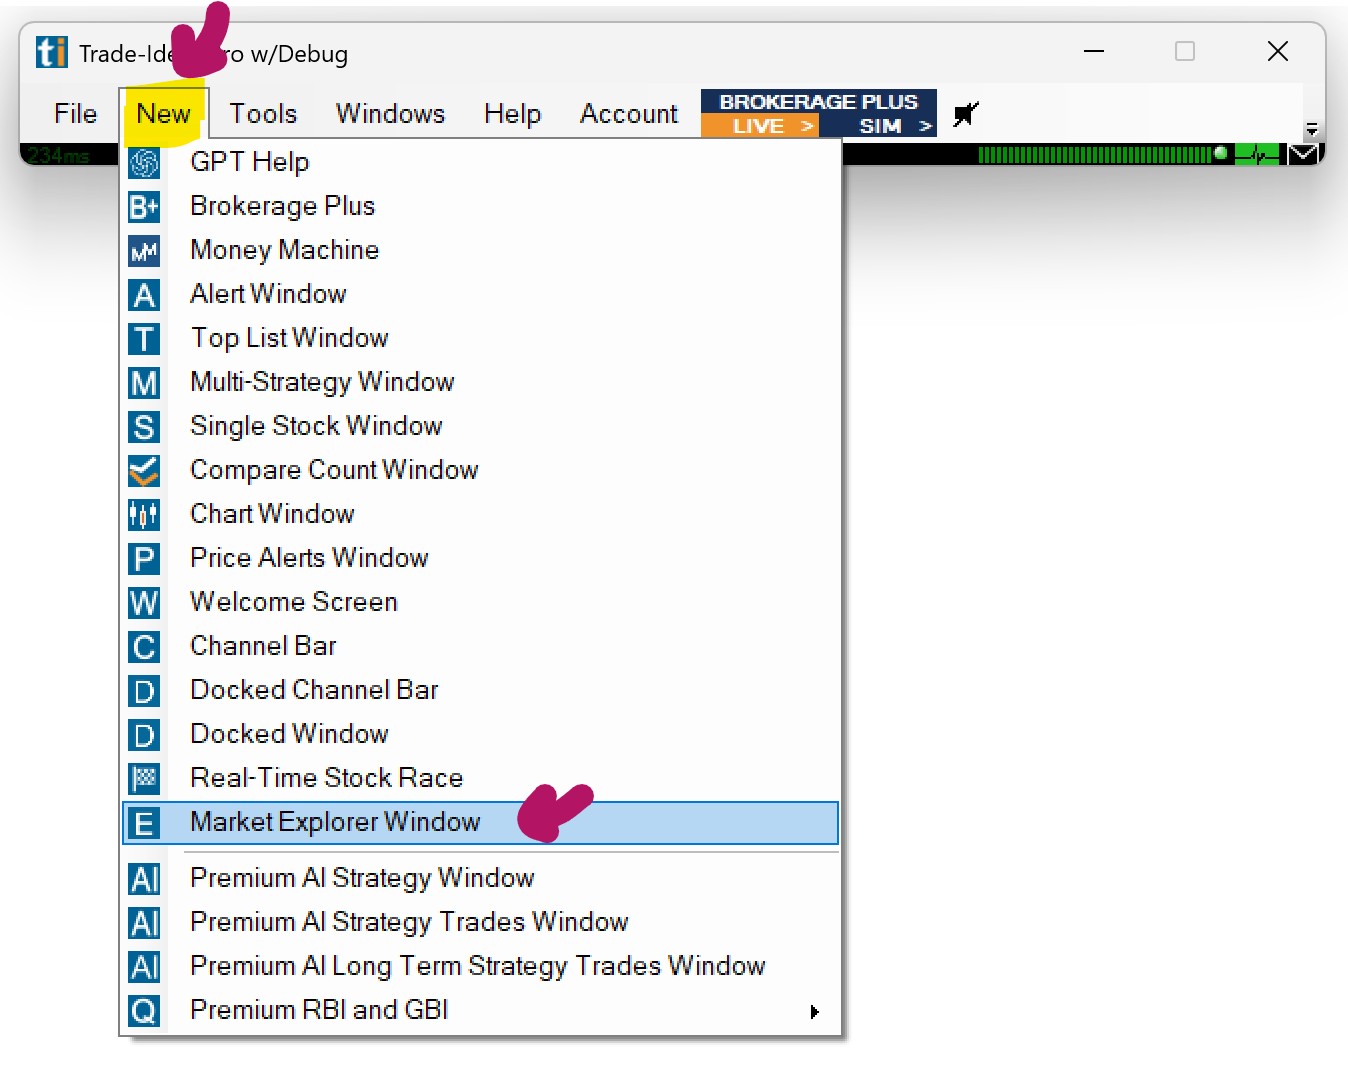
Right-click in the Market Explorer window, select Strategy, then TI Wave.
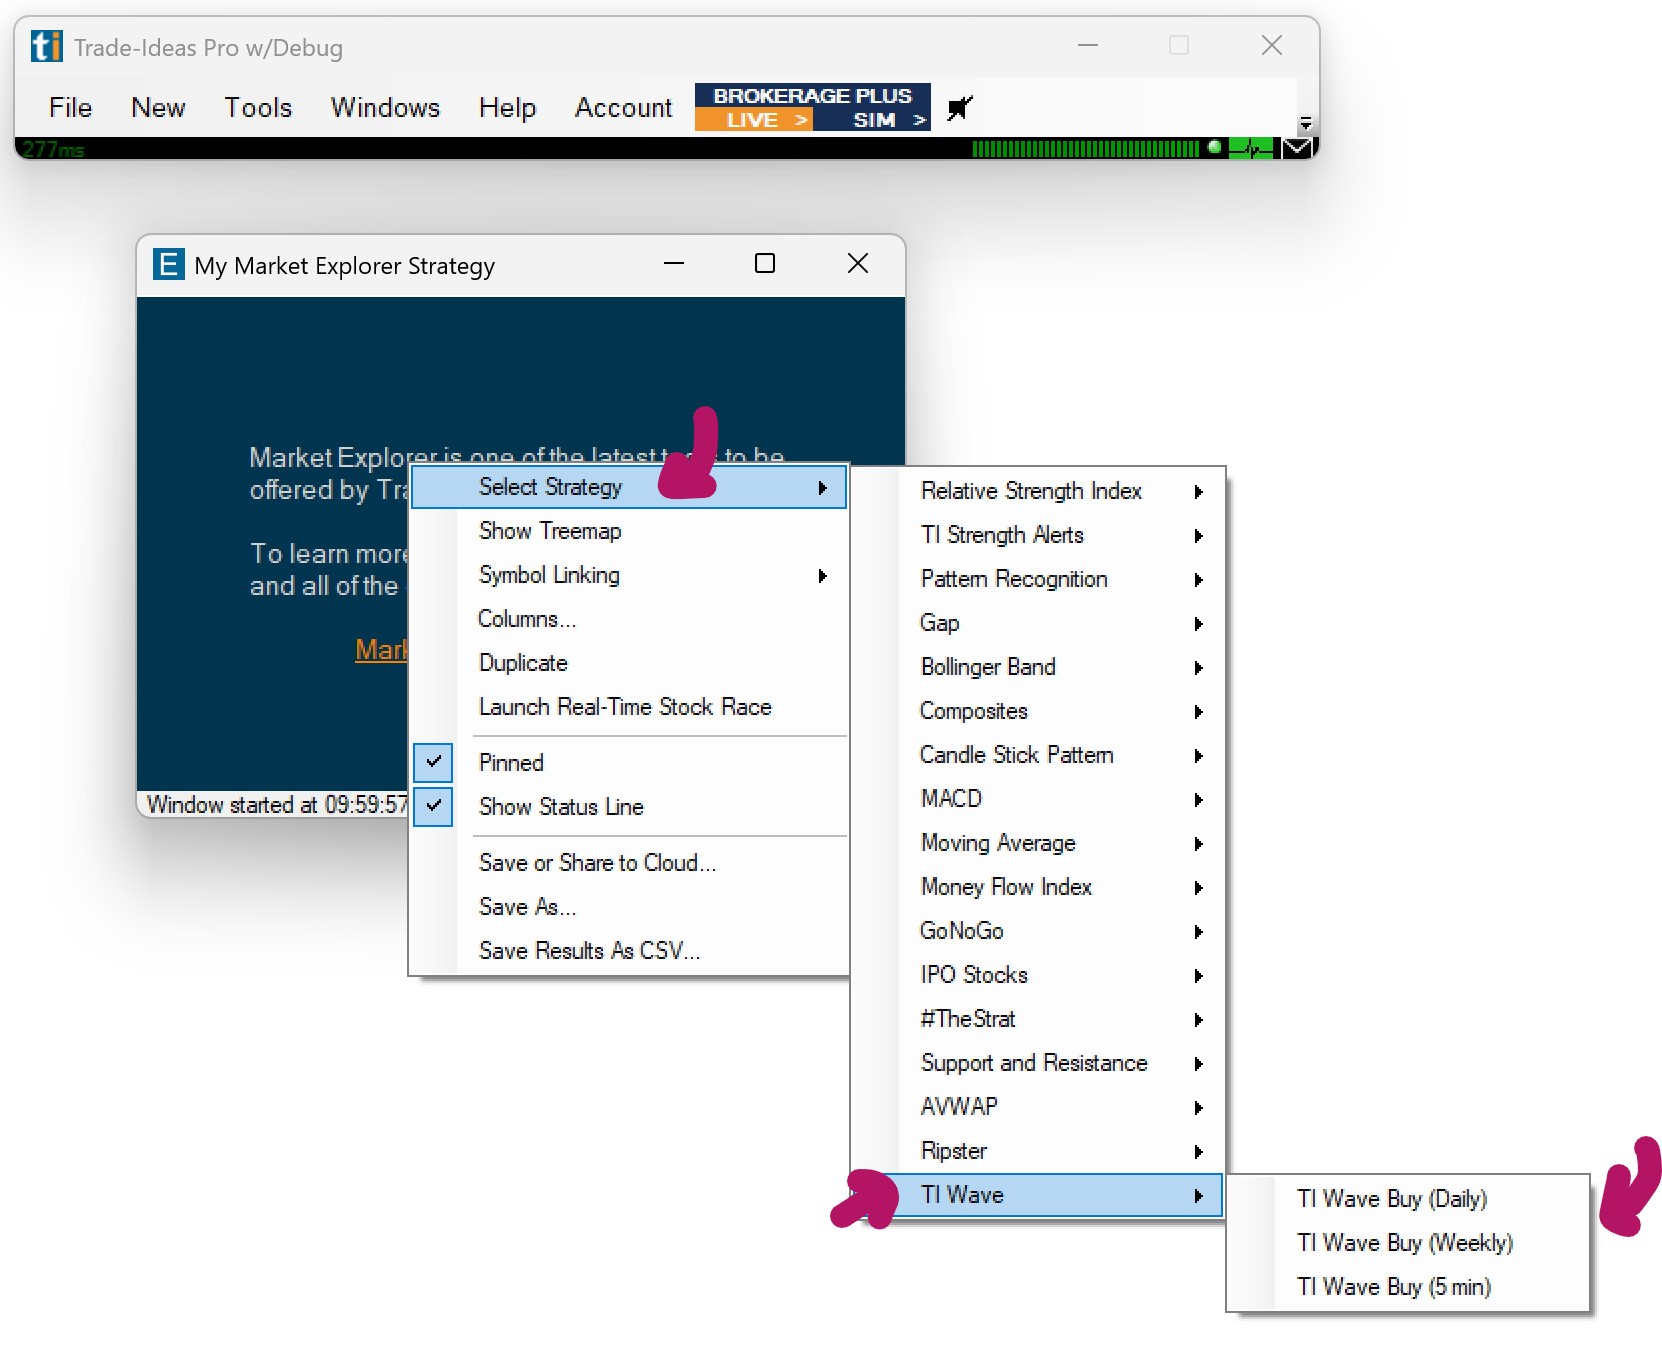
Here, you can choose various TI Wave scans.
TI Wave Tutorial by Chris
The Anchored VWAP Add-on
"The AVWAP represents the absolute truth of the relationship between a stock's supply and demand, and is 100% objective" says Brian Shannon.
Trade Ideas and Brian Shannon, Founder of AlphaTrends, have partnered to bring you a dedicated new channel that enables you to find great trading setups using the Anchored VWAP (AVWAP) indicator.
This add-on subscription provides access to the Anchored VWAP Channel, offering real-time alerts and AVWAP auto drawing on charts.
Please note: The Anchored VWAP Channel is available as an Add-On and requires an active Standard or Premium subscription.
Please note: You need to install and run Trade Ideas Pro AI version 5.6.46 or higher (Windows-only). The Web version and older software versions don't support the AVWAP.
Simply head to our Download Page to get it.
To access the Anchored VWAP Channel go to the Toolbar, open the New Tab and select Docked Channel Bar or Channel Bar:
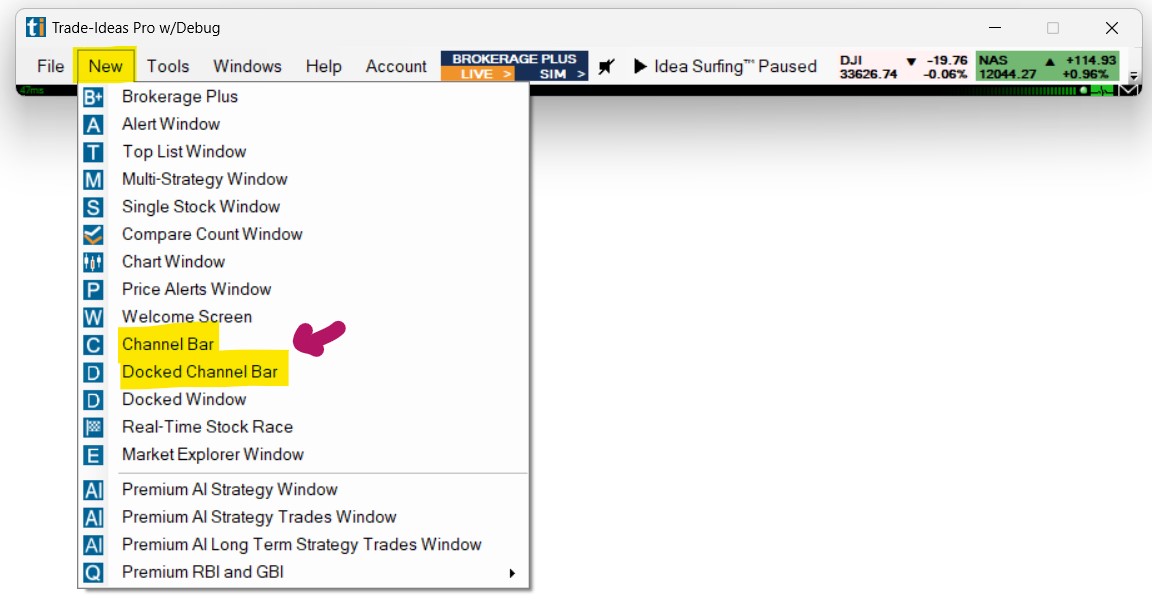
Next, load the Anchored VWAP Channel by clicking on the Channel icon:
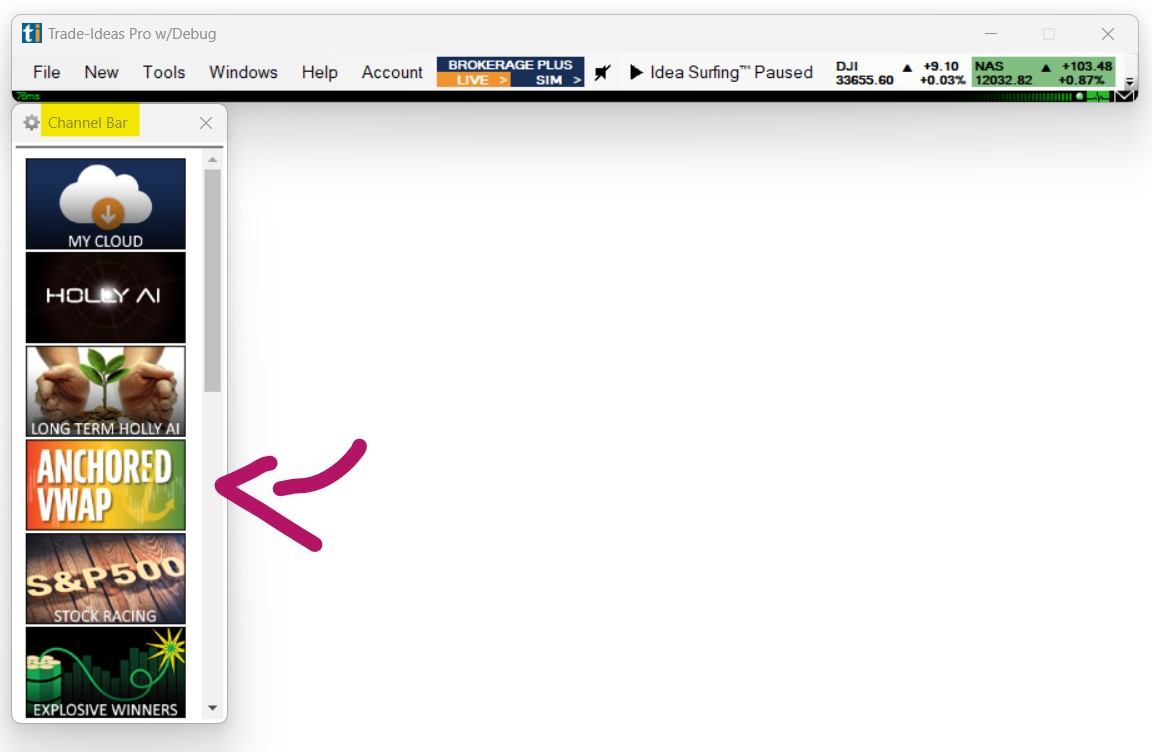
A set of charts, AVWAP real-time scans, as well as a Single Stock Window will open.
The Anchored VWAP will be auto drawn on the charts in a purple color for every symbol you select in one of the AVWAP Windows:
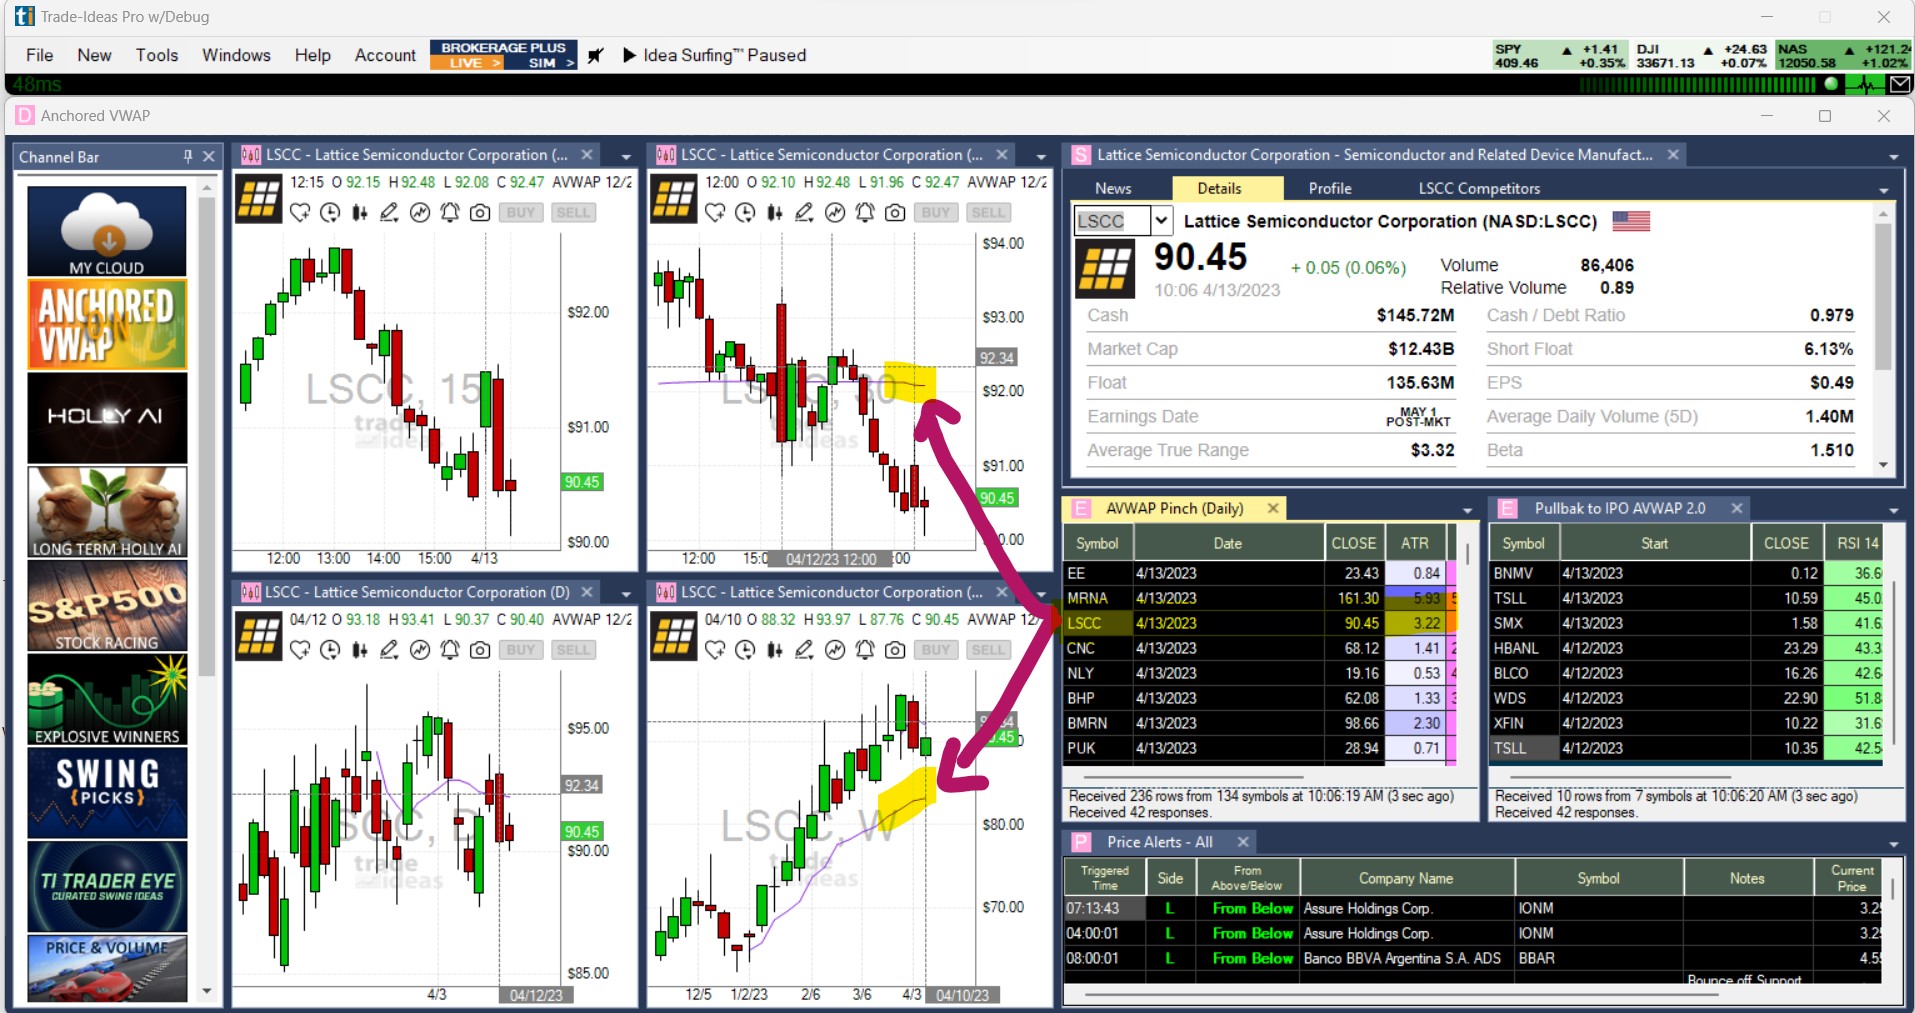
You can access further AVWAP scans by right-clicking into one of the displayed scans, choosing Select Strategy, then AVWAP and making a selection from the available scan.
Once a new AVWAP strategy is selected, it will load in place of the previous scan:
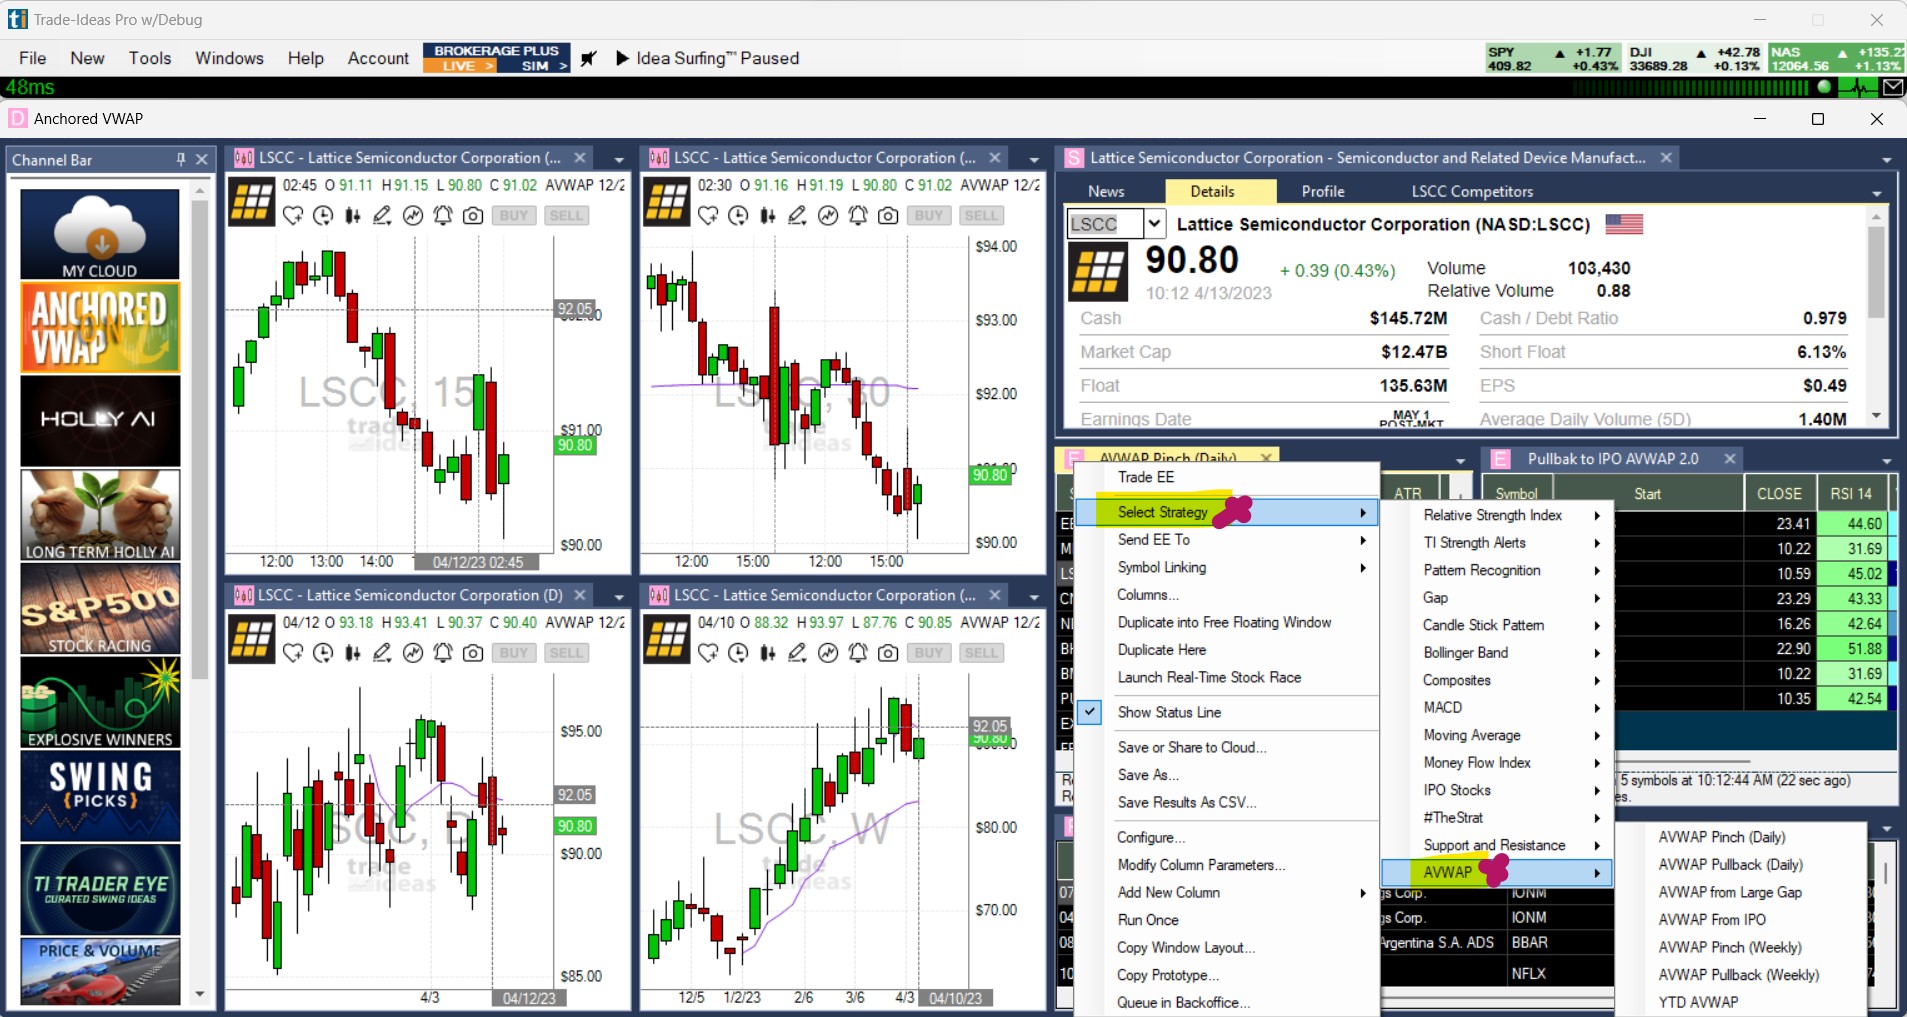
To load additional Anchored VWAP strategies without replacing the existing ones, follow these steps.
Go to the Toolbar, open the New Tab and select Market Explorer Window:
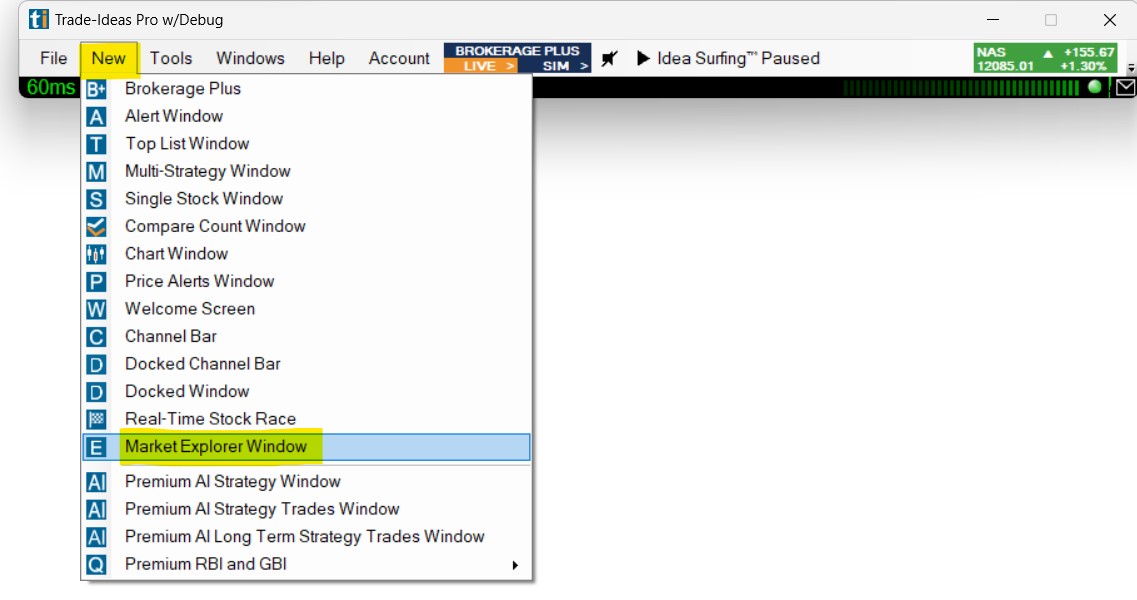
Next, right-click into the window, choose Select Strategy, then AVWAP and make a selection:
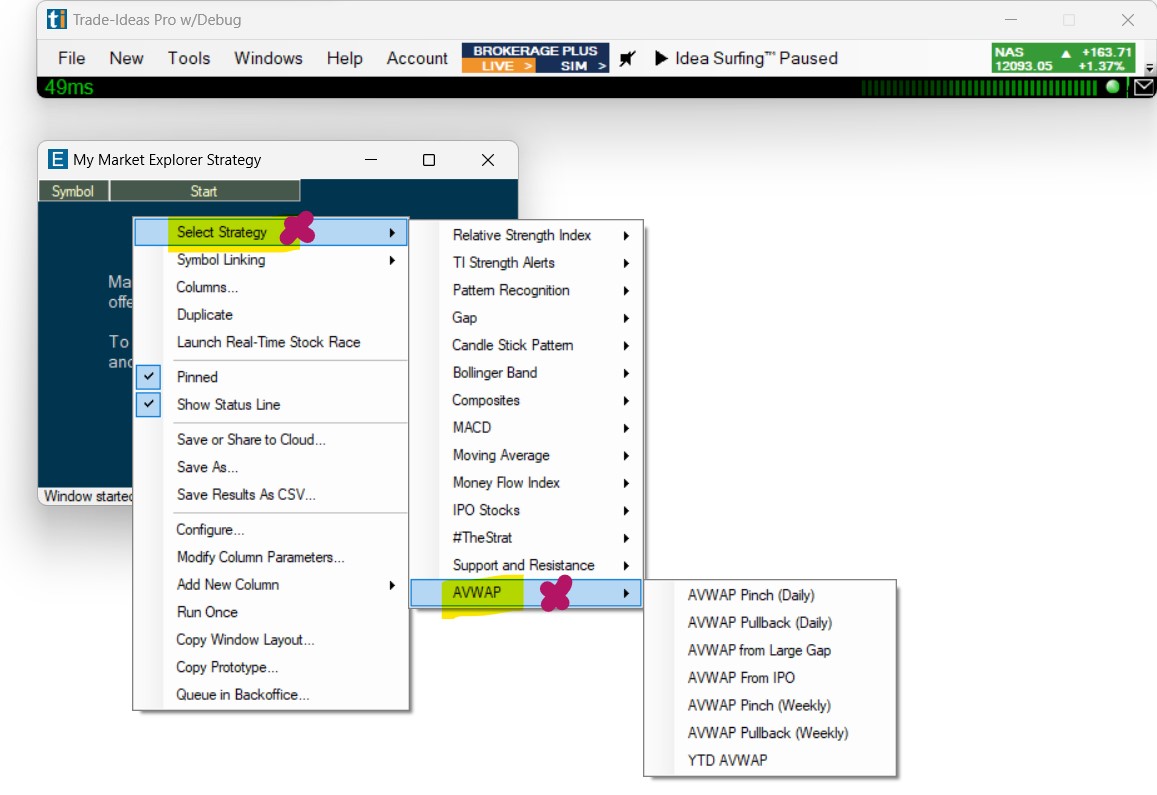
The selected scan will open as a free-floating window:
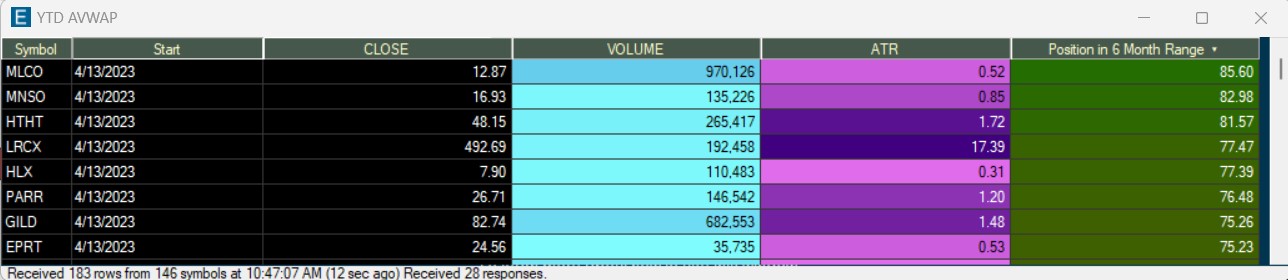
To incorporate it into an existing dock, right-click into the free-floating AVWAP window and select Duplicate into Your existing Dock Name:
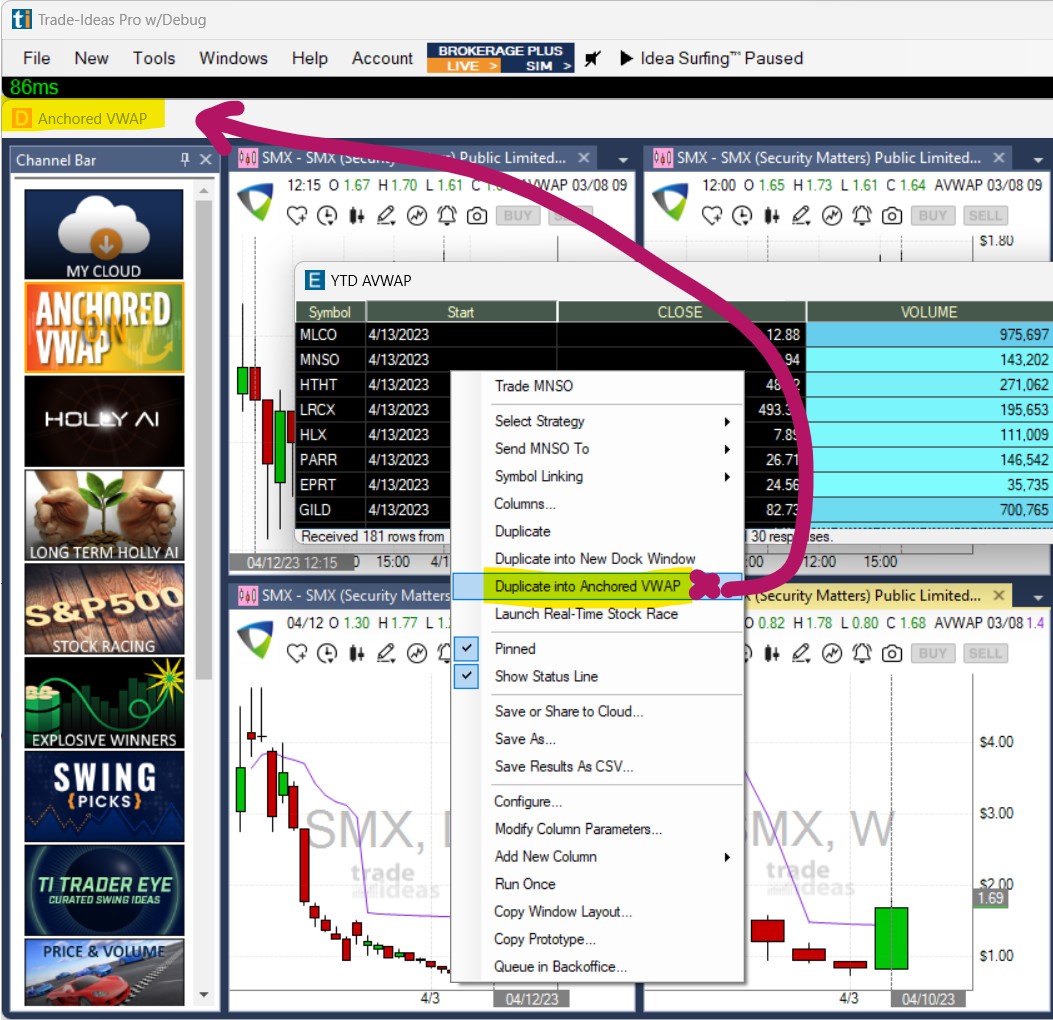
To retain any changes made to the pre-built Anchored VWAP Channel, you will need to save this new layout to your cloud by right-clicking into the header of the docked layout and selecting Save or Share to Cloud:
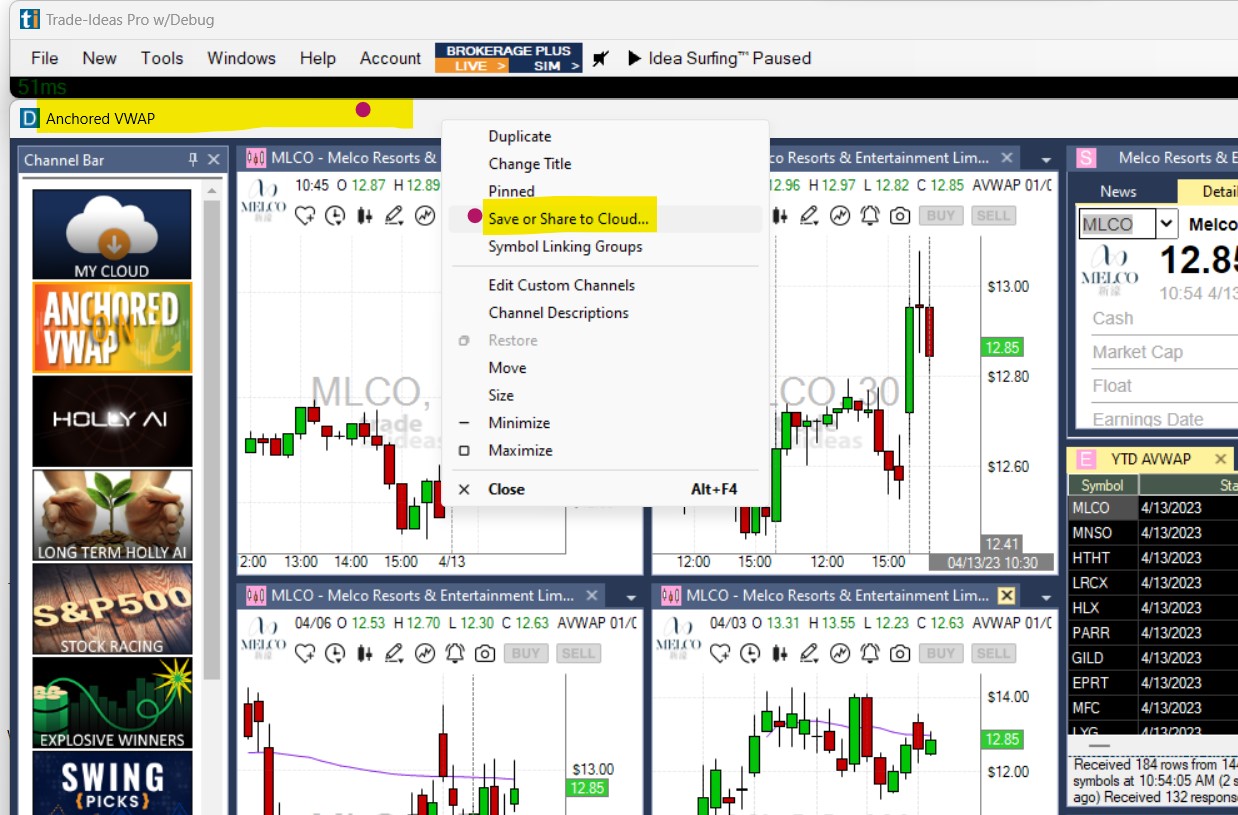
The pre-built Anchored VWAP Channel that can be accessed from the Channel Bar will always open the pre-built layout. To access your personal AVWAP layout, you will need to load it from your cloud after saving it with the changes you have made:
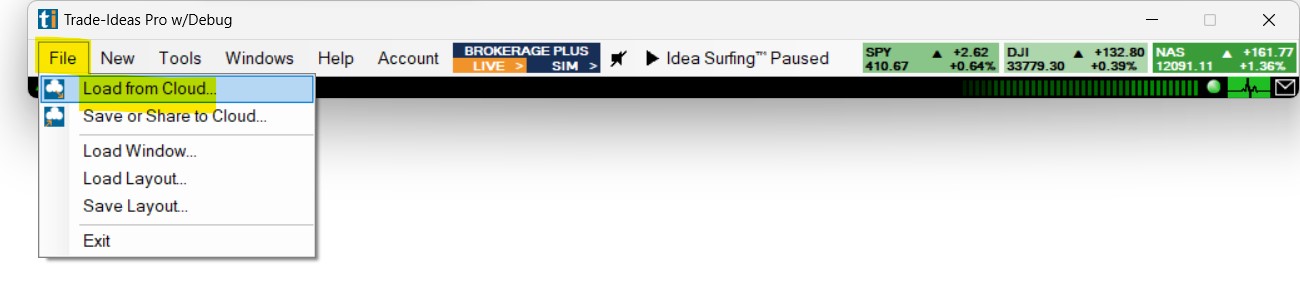
For step-by-step instructions on how to create, edit and save free-floating and docked layouts, have a look at these short videos:
How to Use the Anchored VWAP Market Explorer Scans
The 6 currently available scans include the AVWAP Pinch as well as the Pullback to AVWAP.
The list of AVWAP setups will continue to grow and different time frames, in particular intraday scans, will be added.
Watch these two short videos of TI Trader Michael Nauss on how to find and use the AlphaTrends Anchored VWAP Market Explorer Windows in the Trade Ideas platform.
For a more in-depth intro, watch the replay of the webinar Fine Tune Your Entries With The Anchored VWAP featuring Brian Shannon, Michael Nauss and Steve Gomez.
The best way to learn more about successfully using the Anchored VWAP is to read Brian Shannon's book, Maximum Trading Gains with the Anchored VWAP.
You can purchase it from the following booksellers:
Amazon, Google Books, Barns and Noble
About Brian Shannon of AlphaTrends
Brian's book Maximum Trading Gains with the Anchored VWAP results from decades of research and application. It builds on Shannon's foundational book, Technical Analysis Using Multiple Timeframes. Author Brian Shannon, CMT, explains how to use the Anchored VWAP to make better entries and exits, to time breakouts and breakdowns, and to set stop losses.
Both new and experienced traders and investors will appreciate the book's insights and systematic approach to using AVWAP in a variety of situations including IPOs, support and resistance, market direction, short sales and squeezes, and financial news.
Every chapter includes solid advice on managing risk, which Shannon emphasizes throughout the book, "is Job One." Shannon is a trader's trader who avoids jargon. The book offers over 145 color charts, tables and case studies to set out a definitive framework for understanding the three most important components in the market: price, time, and volume. Readers will learn to work with the market's psychology and their own.
To get the AVWAP Add-On, head here
Please note:
-
The Anchored VWAP Channel is available as an Add-On and requires an active Standard or Premium subscription.
-
You need to install and run Trade Ideas Pro AI version 5.6.46 or higher (Windows-only). The Web version and older software versions don't support the AVWAP.
GoNoGo: Trend Visualization Made Simple
Please Note: (GoNoGo is a TI Pro Add_On, not included in our plans)
GoNoGo Trend® is a cutting-edge charting system designed to simplify trend analysis. By using a color-coded scheme, GoNoGo makes it easy to identify the strength and direction of trends on any stock and any time frame. Whether you're a seasoned trader or just starting, GoNoGo helps eliminate chart clutter while providing actionable insights.
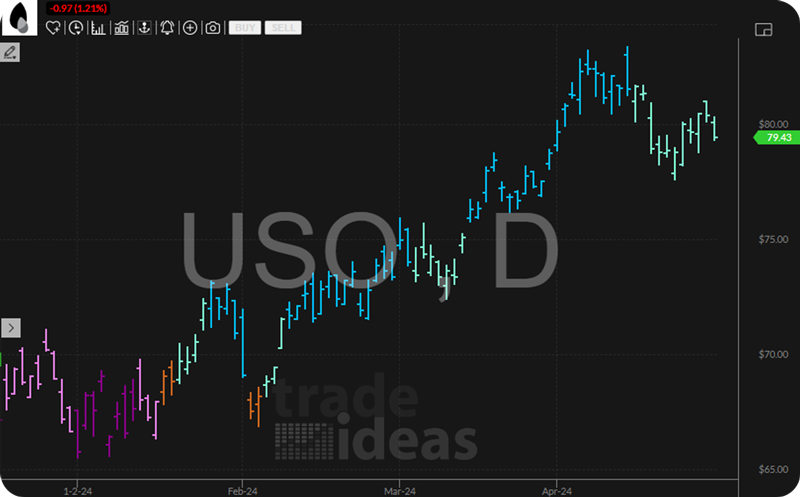

How It Works
GoNoGo evaluates multiple technical indicators and algorithms to identify trends and translates the results into easy-to-understand color-coded bars:
- Bright Blue: Strong bullish trend (Go Mode).
- Aqua: Early or weakening bullish trend.
- Amber: Neutral, uncertainty in trend direction (Go Fish Mode).
- Pink: Weak bearish trend.
- Dark Purple: Strong bearish trend (NoGo Mode).
This visualization provides a complete "weight of evidence" approach to help traders quickly determine trend direction and strength.
Getting Started with GoNoGo
Step 1: Ensure You’re using the Correct TI Pro Version
GoNoGo requires Trade Ideas version 5.6.104 or later.
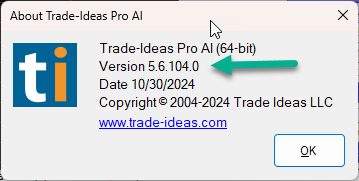
You can check your version by navigating to the Toolbar Bar > Help > About:
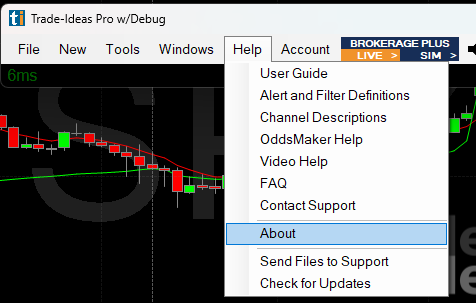
If you're on an older version, download the latest version here.
Step 2: Access the GoNoGo Channel
On the Toolbar, go to the New Tab and select Docked Channel Bar.
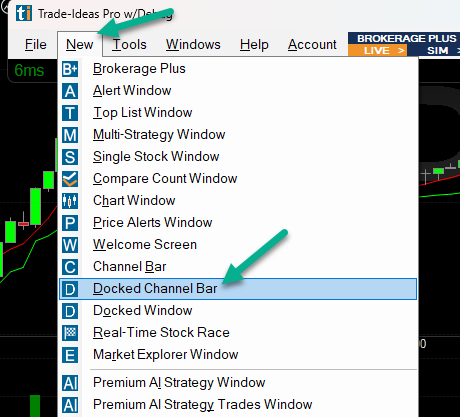
In the Docked Channel Bar, locate the GoNoGo Channel and click on it. In case the channel is not visible, scroll down to the bottom of the channel bar and click Show More.
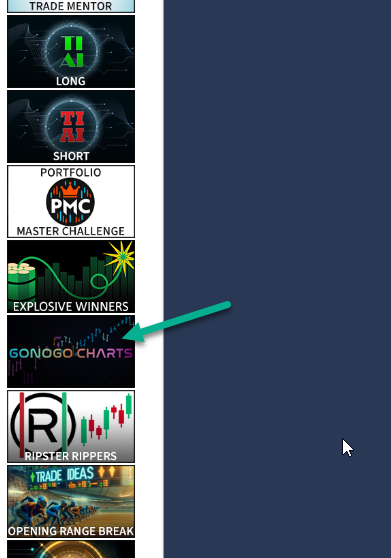
The Welcome Screen inside the GoNoGo channel contains informative videos and instructions.

Enabling GoNoGo on the Charts in the GoNoGo Channel
By default, the chart(s) in this channel are NOT GoNoGo enabled. To enable this indicator, click on one of the GoNoGo scan results. This action will convert the chart(s) to GoNoGo charts.
This is how your chart looks before clicking on a GoNoGo scan result:
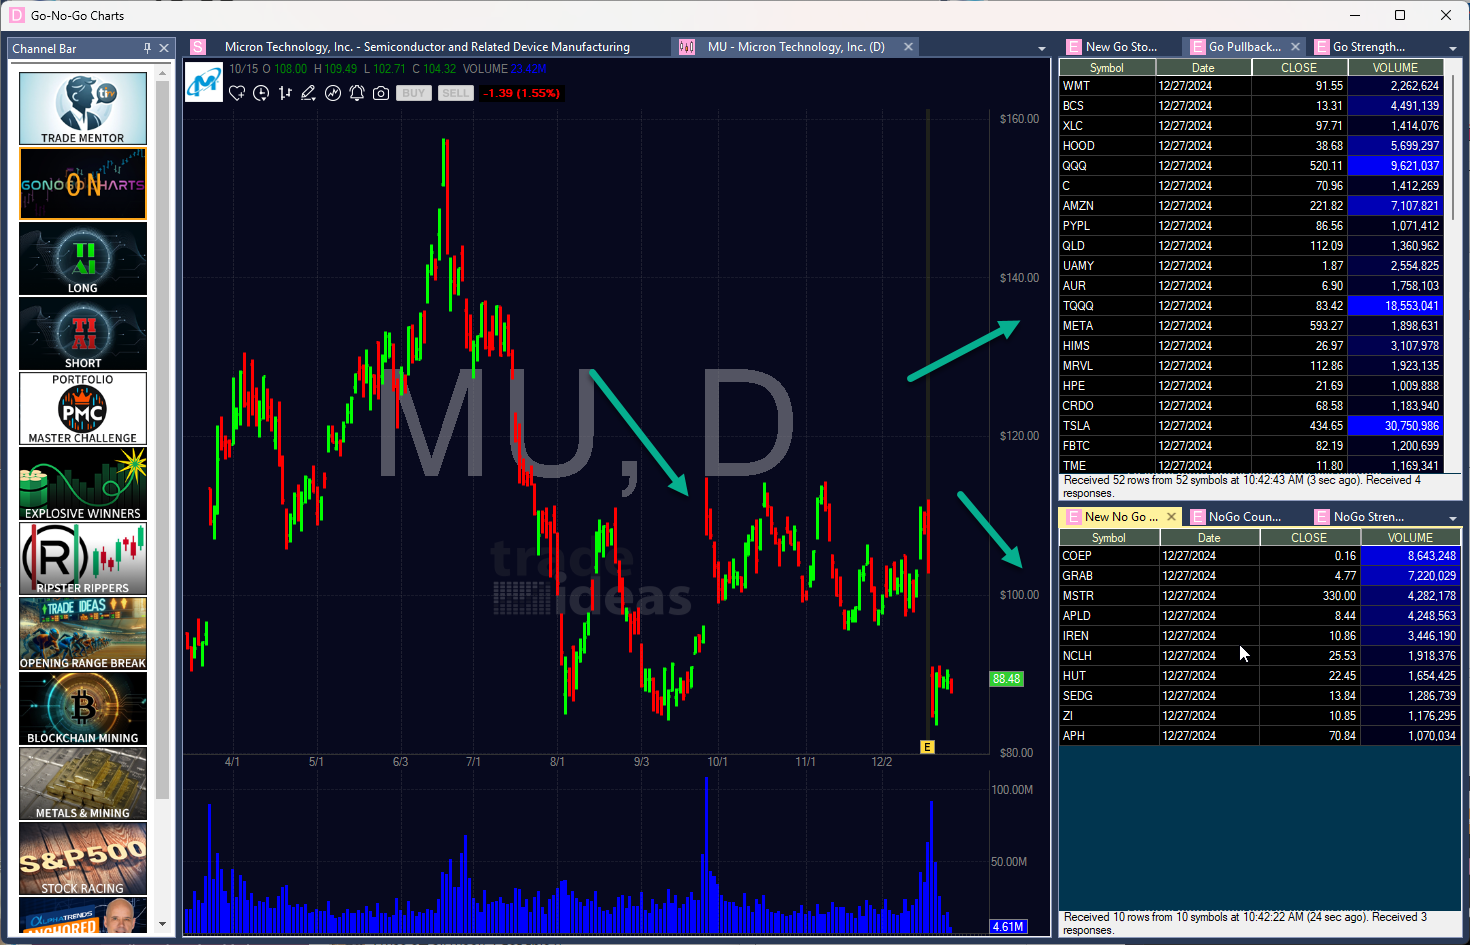
And this is how your chart will look once you selected a stock scan alert:
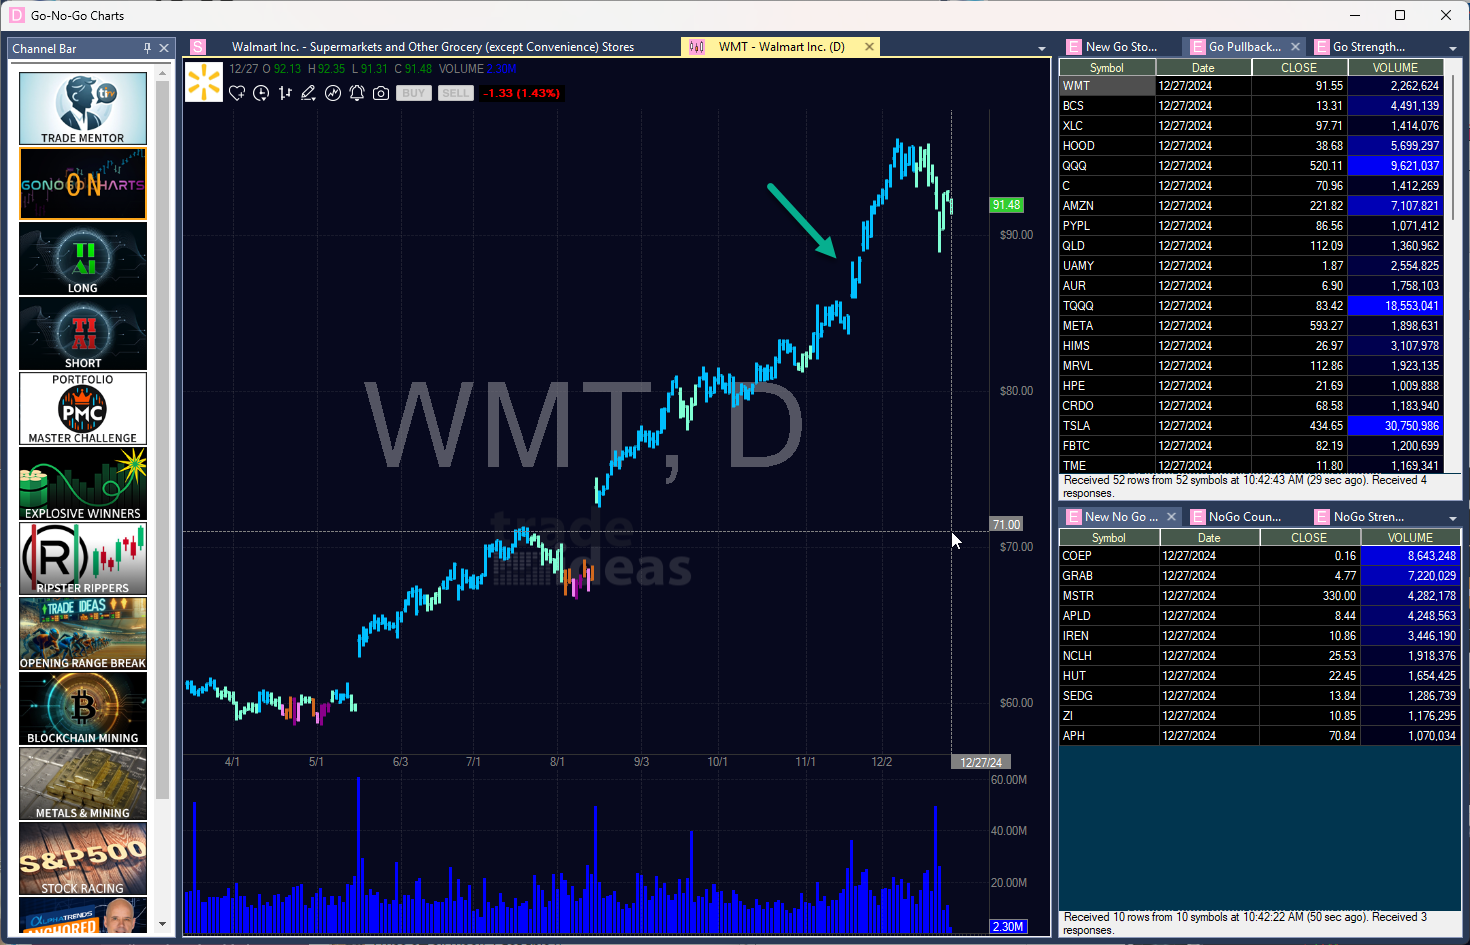
Performing these steps in the GoNoGo channel will only convert the charts in this channel.
Enabling GoNoGo on other charts (cutom layouts, free floating charts etc.)
If you would like to convert the charts in your custom layout, or any other chart to a GoNoGo chart, follow these steps:
Step 1: Load the Market Explorer
From the Toolbar Bar > New > Market Explorer Window:
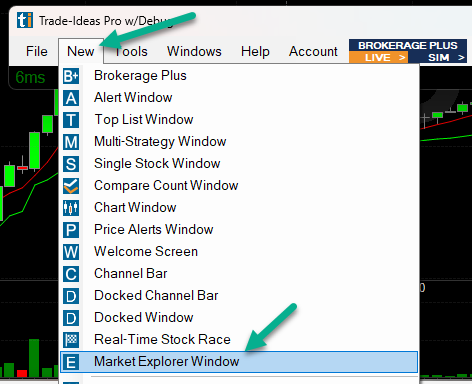
Step 2: Load a GoNoGo Scan
Right-click into the Market Explorer Window, select Strategy, then GoNoGo.
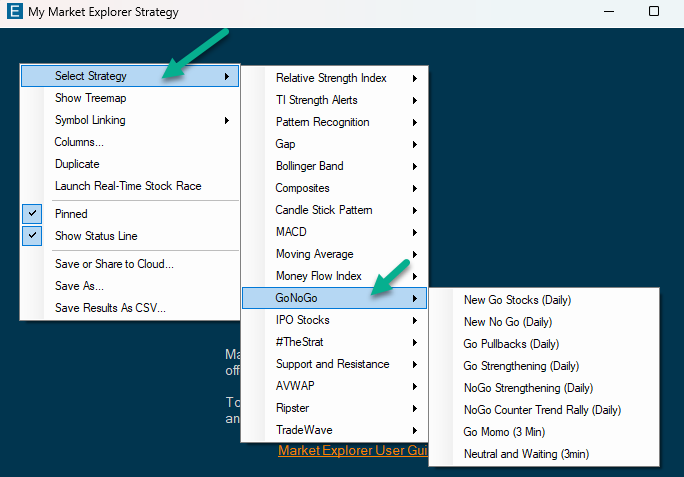
Here, you can load various GoNoGo scans. Choose one of them, then click on a GoNoGo scan result to convert your symbol linked chart to a GoNoGo chart.
By default, all Market Explorer scans will be linked to all charts that have symbol liking enabled (blue symbol linking group), with the exception of docked linked specific charts (pink linking group). To find out more about symbol linking, head here.
To disable the GoNoGo indicator in any of your charts, right click into the chart, and select Indicators.
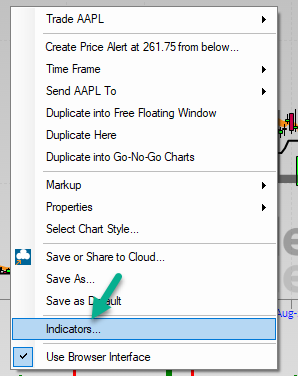
In the Indicator Window, select the Edit tab, highlight the GO_LEVEL indicator, then press the Remove button:
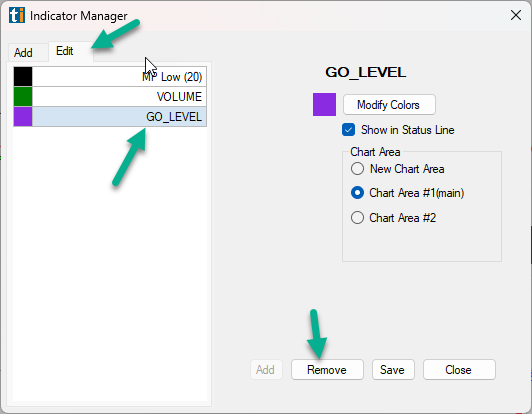
GoNoGo Walkthrough
GoNoGo Channel
GoNoGo Intro Video
Alerts & Filters Glossary
Trade Ideas Users have over 500 Alerts and Filters at their disposal to create customized scans.
Visit our Alerts & Filters page for a detailed explanation of each of them.
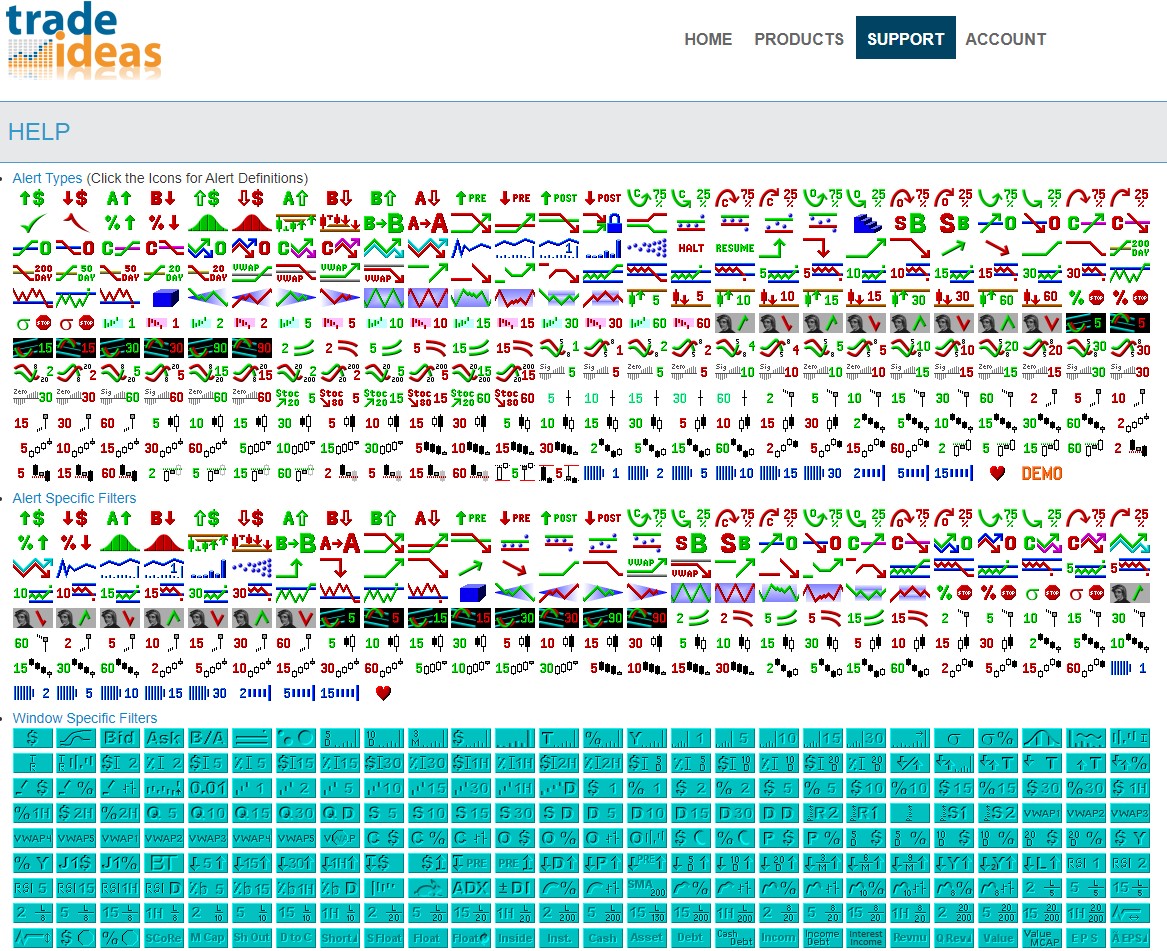
Layouts & Scans
It is our goal to make the use of our software as easy as possible, especially for trading beginners.
This section contains cloud links to premade scans and layouts, including videos and descriptions.
The layouts are so-called Starter Layouts, they are designed for new traders and are meant to serve as a good starting point.
All layouts are fully customizable, so feel free to change things around as you go along.
Day Trading Starter Layout 1: Finding Relative Strength
Day Trading Starter Layout 2: Pullbacks & Breakouts
Day Trading Starter Layout 3: Stocks in Play
Swing Trading Layout 1: Curated Stock Picks
Starter Layout 1: Finding Relative Strength with Races
>>> Load the Cloud Link
Layout Contents: Charts x 2, Stock Race x 1, Price Alerts Window x 1, Single Stock Window x 1, Brokerage Plus Module/Chart Trading x 1
There are times when the stock market can be frustrating and trading can be an emotional rollercoaster. But we can help you to succeed, no matter the market conditions! Our brand-new, unique tool is especially suited to the current market and will get you into the best trades every day, by detecting Relative Strength.
Incorporating new techniques can be daunting, but adaptation and flexibility will make you a more profitable trader, and ultimately lead to the freedom you are longing for.
Starter Layout 2: Pullbacks & Breakouts
>>> Load the Cloud Link
Layout Contents: Charts x 3, Alert Window Scans x 3, Single Stock Window x 1
Scan #1: Pullback, 5 Minute High
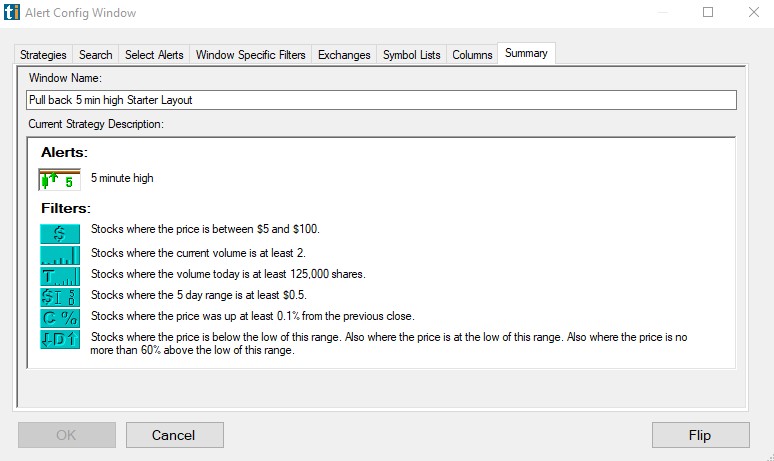
Stocks will appear on this scan, when they make a 5-Minute High and...
- Are between $5 and $100
- Have a Relative Volume of 2 or higher. The Relative Volume filter is great at finding stocks in play. It looks at the 10 Day Volume Average for this time of day of the stock and compares it to the current trading volume. A Relative Volume of 1 would be normal, we're looking for stocks that are on par to trade at least double their average volume.
- Have traded at least 125,000 shares already on the day
- Have a 5-Day Range (high to low) of at least 50 cents
- Have moved up at least 0.1% from the previous close
- Are currently at least 40% below the High of the Day. Or in other words, no more than 60% above the Low of Today's Range. This filter helps us to find stocks that are currently in a Pullback.
Scan #2: Down Yesterday, Up Today
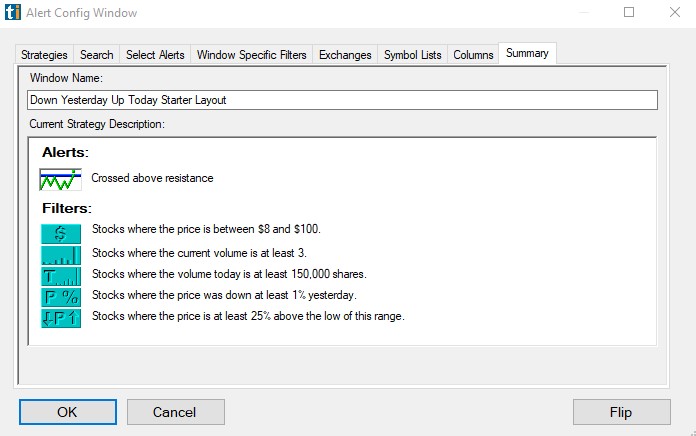
Stocks will appear on this scan, when they Cross Above Resistance and...
- Are between $8 and $100
- Have a Relative Volume of 3 or higher. The Relative Volume filter is great at finding stocks in play. It looks at the 10 Day Volume Average for this time of day of the stock and compares it to the current trading volume. A Relative Volume of 1 would be normal, we're looking for stocks that are on par to trade at least three times their average volume.
- Have traded at least 150,000 shares already on the day
- Have been down at least 1% yesterday.
- Are currently at least 25% above Yesterday's Low.
Scan #3: Crossed Resistance With Volume
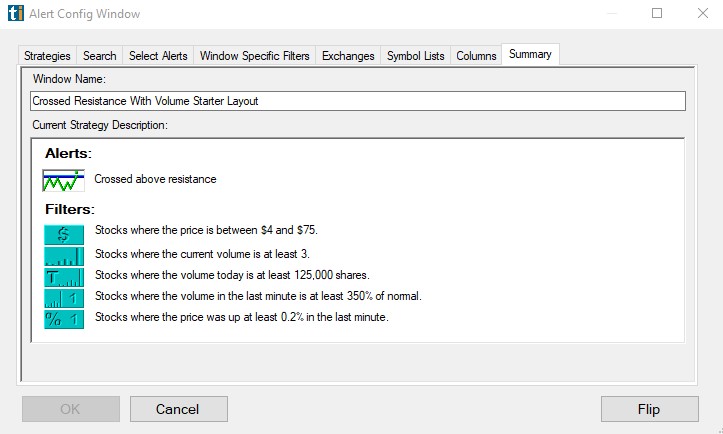
Stocks will appear on this scan, when they Cross Above Resistance and...
- Are between $4 and $75
- Have a Relative Volume of 3 or higher. The Relative Volume filter is great at finding stocks in play. It looks at the 10 Day Volume Average for this time of day of the stock and compares it to the current trading volume. A Relative Volume of 1 would be normal, we're looking for stocks that are on par to trade at least three times their average volume.
- Have traded at least 125,000 shares already on the day
- Have traded at least 3.5 times as much as normal/expected (based on a 10 Day Average) in the last minute.
- Have moved up at least 0.2% in the last minute.
Starter Layout 2: Stocks in Play Today
>>> Load the Cloud Link
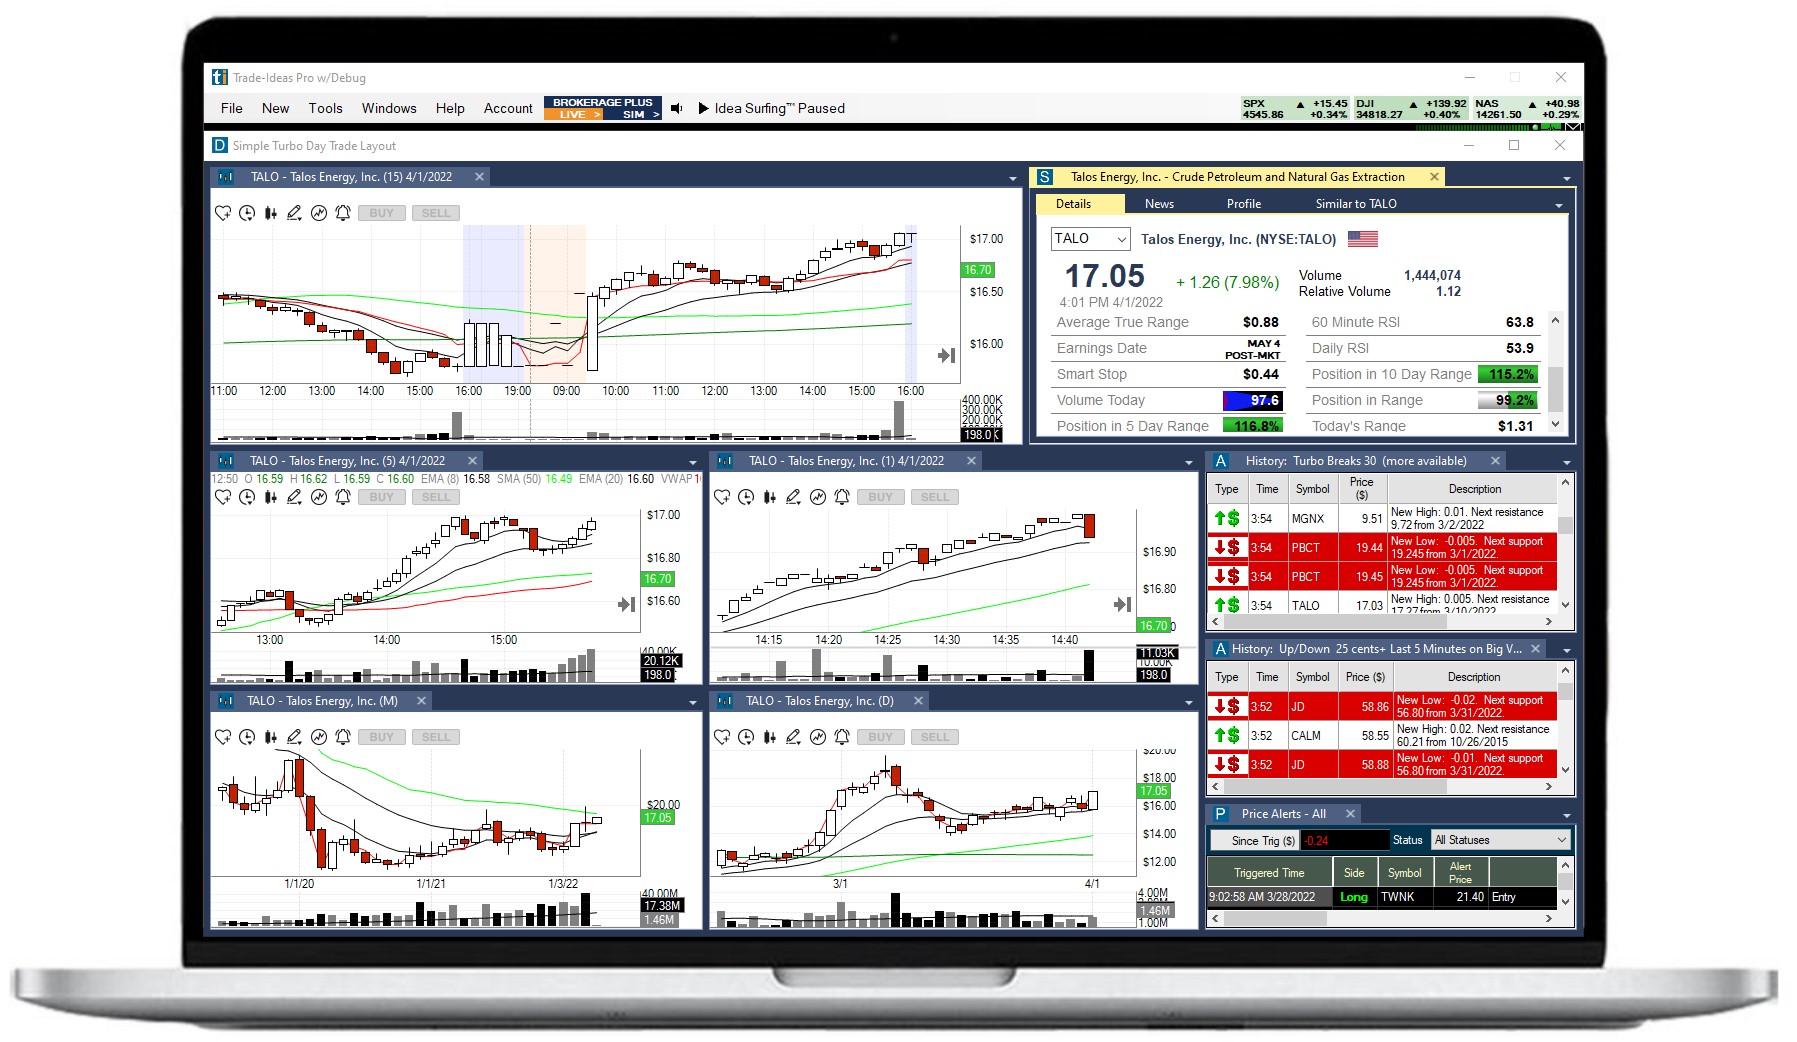
Layout Contents:
Charts x 5, Alert Window Scans x 2, Single Stock Window x 1, Price Alerts Window x 1
Scan #1: Turbo Breaks Up & Down
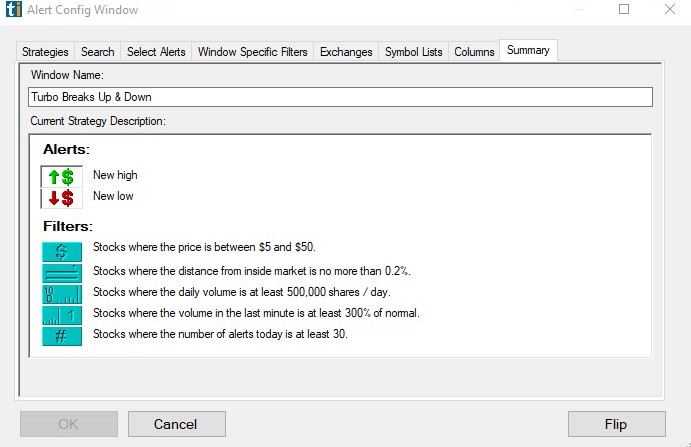
Stocks will appear on this scan, when they make a New High or a New Low and...
- Are between $5 and $50.
- With a print no more than 0.2% away from the inside market. The Distance from Inside Market filter is used to separate legitimate prints from bad prints. The further a print is from the inside market, the less reliable the alert is, so this filter helps to find tradeable alerts, and prices you can actually get.
- Have traded at least 500,000 shares per day over the last 10 days.
- Have traded at least 3 times as much as normal/expected (based on a 10 Day Average) in the last minute.
- Have made a New High or a New Low at least 30 times today already.
Scan #2: Up/Down 25 cents+ Last 5 Minutes on Big Volume
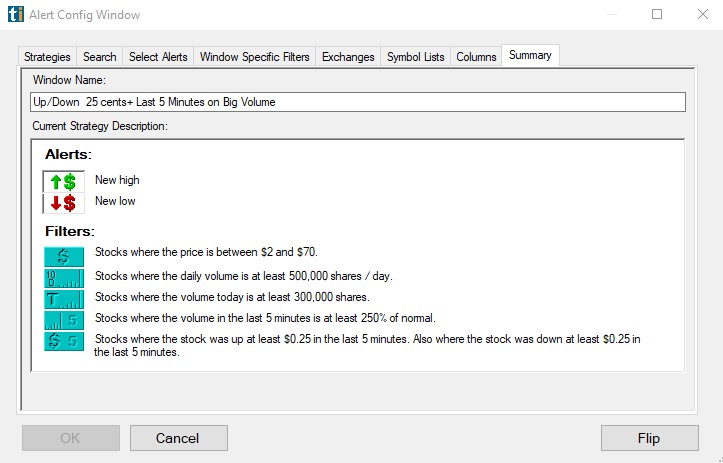
Stocks will appear on this scan, when they make a New High or a New Low and...
- Are between $5 and $70.
- Have traded at least 500,000 shares per day over the last 10 days.
- Have traded at least 300,000 shares already on the day.
- Have traded at least 2.5 times as much as normal/expected (based on a 10 Day Average) in the last 5 minutes.
- Have moved up or down at least 25 cents in the last 5 minutes.
Swing Layout 1: The Trader's Eye
>>> Load the Cloud Link
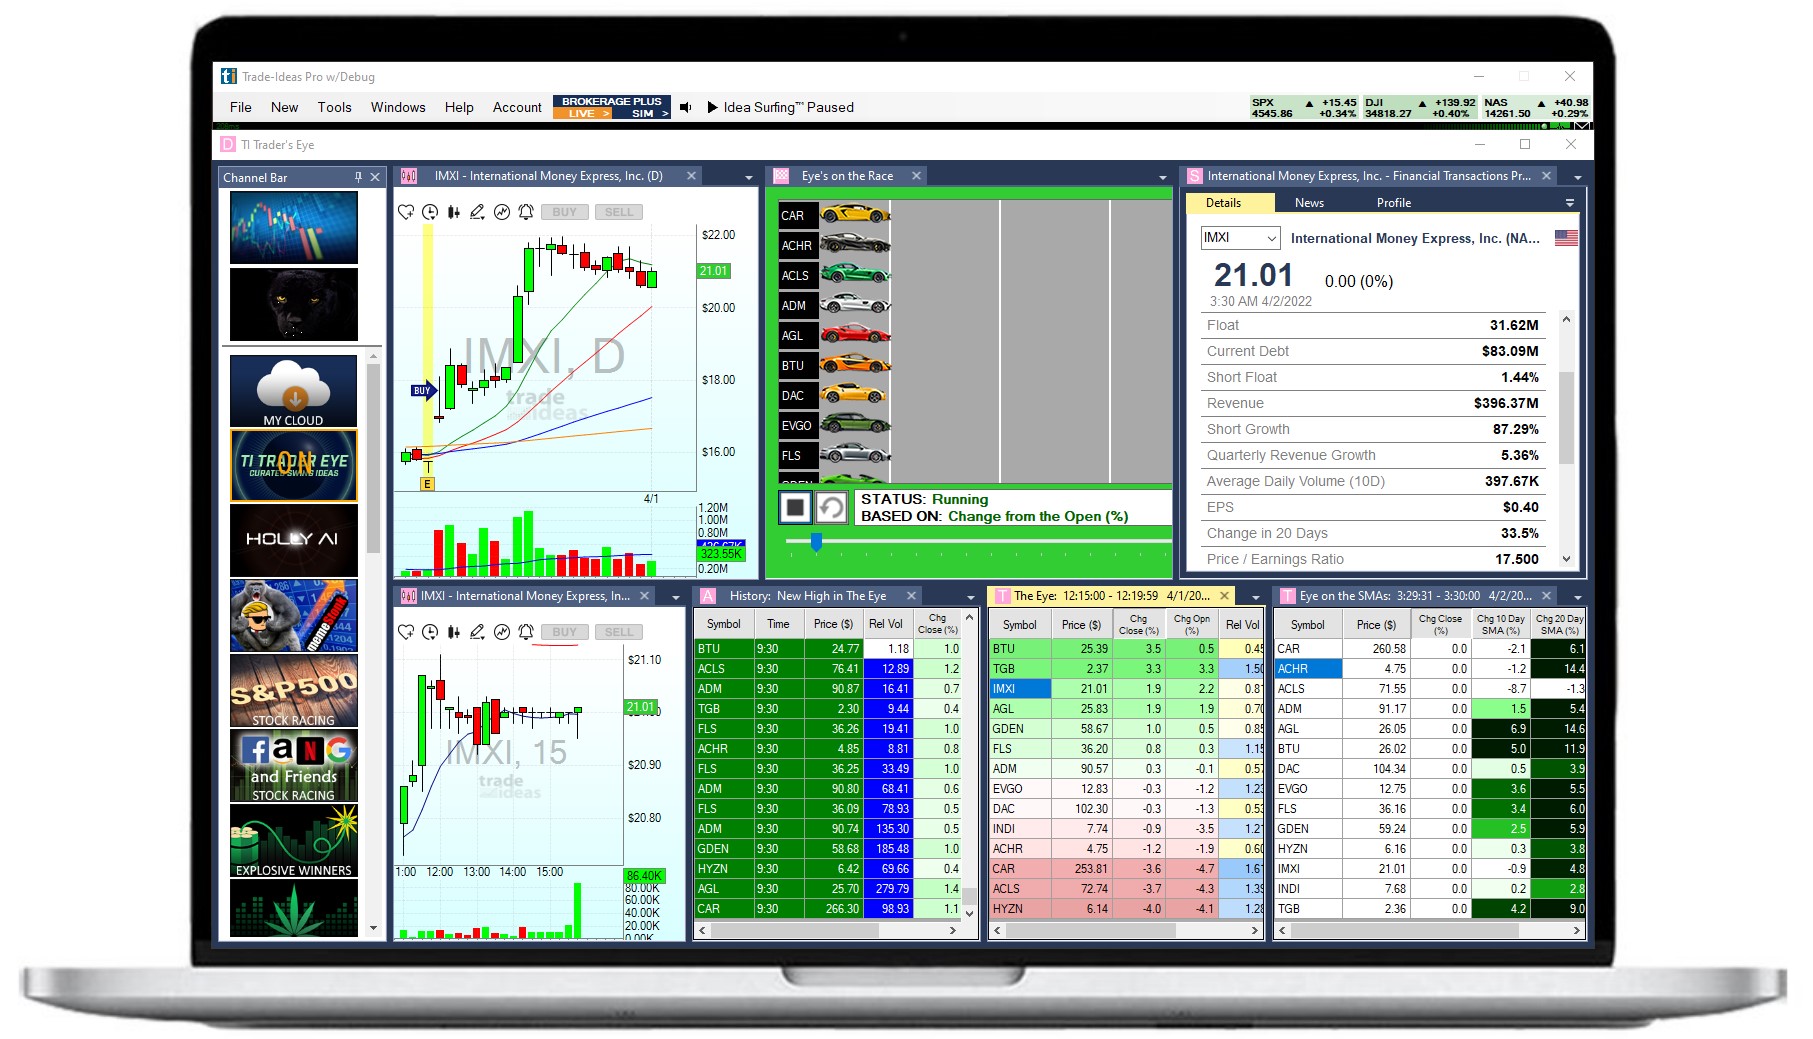
Layout Contents: Charts x 2, Alert Window Scans x 1, Top List Window Scans x 2, Single Stock Window x 1, Realtime Stock Race Window x 1
This layout can also be found in our Trader's Eye Channel. It focusses on a curated list of promising swing stocks that are expected to move higher (long trades only). All stocks have been evaluated and handpicked by our TI Traders to give you an edge and enable you to benefit from decades of trading experience.
There is, however, no guarantee that these stocks will move as expected, and the daily list does not constitute trading advice. Please also note, that trading success relies heavily on having a trading plan and sticking to it.
Scan #1: The Eye
Daily evaluated, curated list of promising swing stocks ranked by biggest Change from the Close Today.
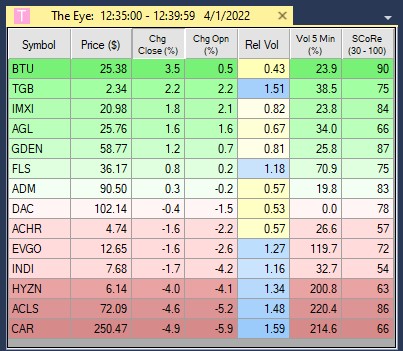
Scan #2: Eye on the SMAs
Daily evaluated, curated list of promising swing stocks ranked by biggest Change from the Close Today.
This scan is used to monitor each stocks proximity to the key moving averages (10, 20 and 50 Day SMA).
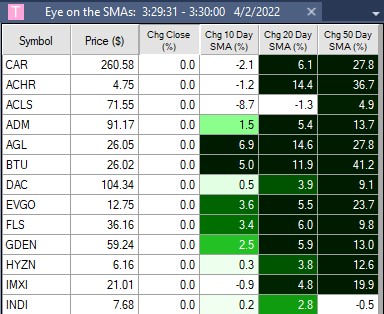
Scan #3: New High in the Eye
Daily evaluated, curated list of promising swing stocks making New Highs right now.
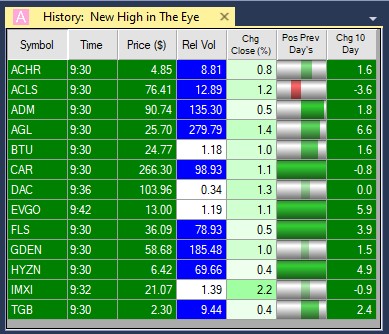
Scan #3: Eye's on the Race
Daily evaluated, curated list of promising swing stocks racing against each other in 30 minute intervals based on their real-time moves. The winner of each race will be listed on the right.
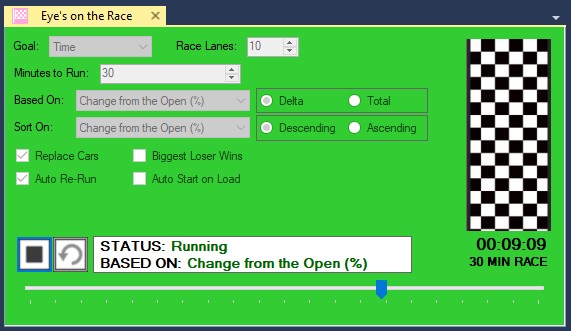
To build you own layouts and scans, have a look at Episode 4 to 9 of the Getting Started Series:
Individual Scans
Scan #1: Sector Analysis Top List
>>> Load the Cloud Link
This list of EFT’s shows the most active sectors. Its purpose is to give traders a feel for the current market. This Sector Top List contains no exclusionary filters, it simply ranks the ETFs by Change from Close % with biggest on top.
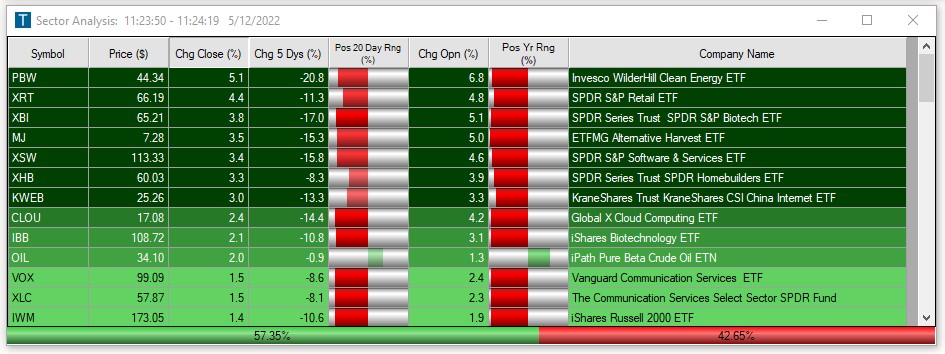
Scan #1a: Sector Analysis Stock Race
>>> Load the Cloud Link
See the strongest sector ETFs race against each other in real-time, based on their strength in the last 5 Days, 20 Days and Year.
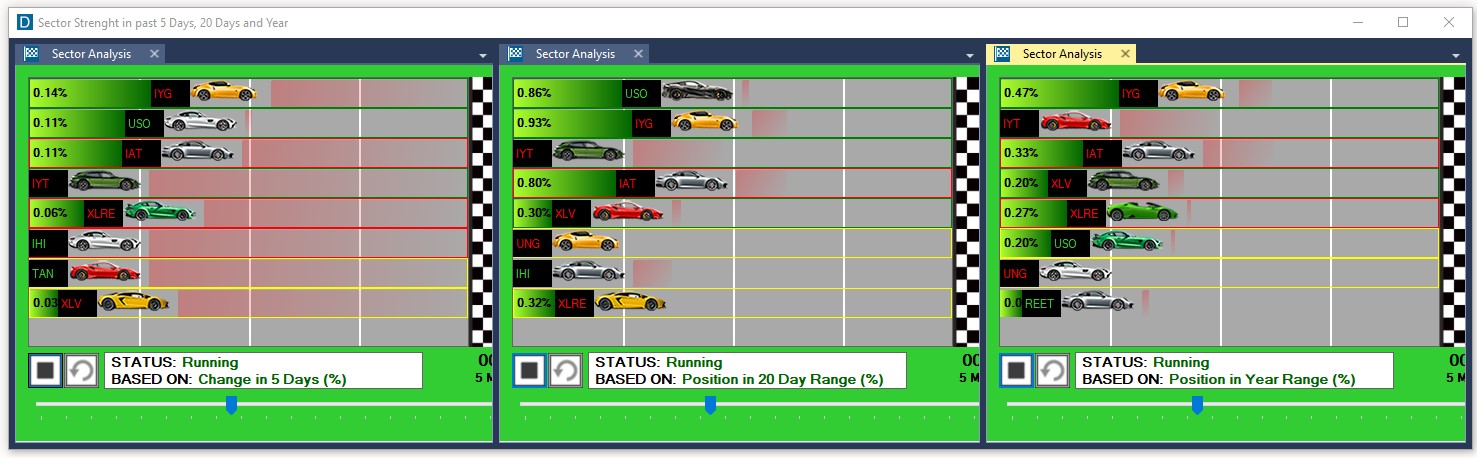
Scan #2: Parabolic Moves
>>> Load the Cloud Link
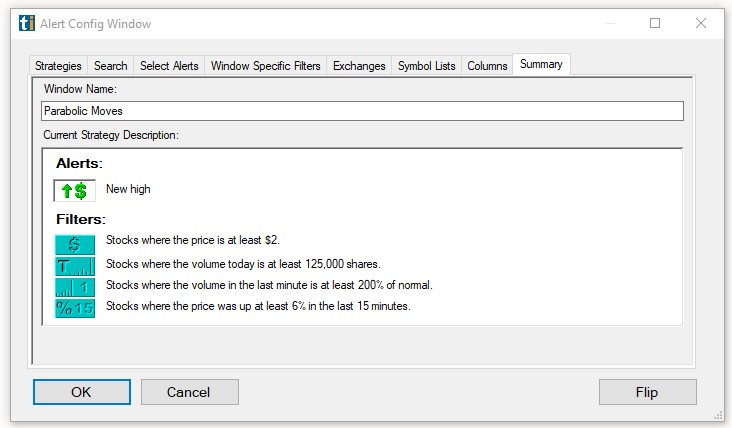
Stocks will appear on this scan, when they make a New High and...
- Are trading at $2 or more.
- Have traded at least 125,000 shares already on the day.
- Have traded at least 2 times as much as normal/expected (based on a 10 Day Average) in the last 1 minutes.
- Have moved up at least 6% in the last 15 minutes.
Watch the video to learn more about this scan:
To build you own layouts and scans, have a look at Episode 4 to 9 of the Getting Started Series:
Stocks Like This Page
Our Stocks Like This page lists all the alerts and filters a stock has met at a particular time and date. It provides a 5-minute snapshot and goes back around 60 days.
It can be a very helpful tool when building scans. When you see a stock move a particular way on a chart and would like to build a scan to catch future stock moves like this, use the Stocks Like This page. When you enter the ticker and the time you are interested in, this page will return every statistic we have on it. This will give you a good idea, which alerts and filters your scans should have had if you wanted to catch that particular move. You can use this insight to create scans that catch similar moves in the future.
The Stocks Like This page is also a good tool when you wonder why a stock didn't appear in your scan.
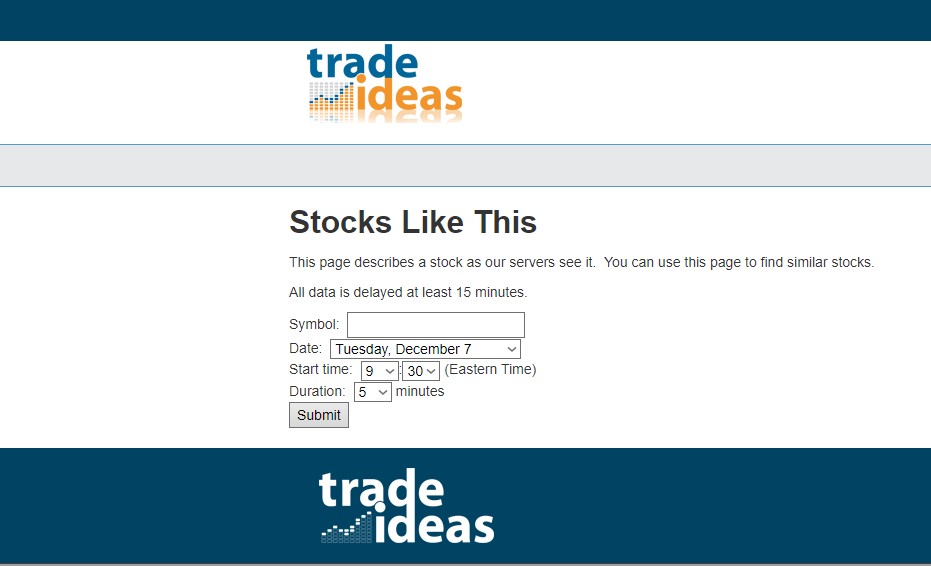
Web Version
As a Mac user or as a user of mobile devices, you have two options, you can either use our browser-based Web version or run our full-feature Windows desktop version on your device via a virtual machine like AWS/Windows 365 or software like Parallels/Bootcamp.
All our over 500 Alerts and Filters to create custom scans are available in the Web Version, and if you select the Premium Plan, you'll have access to our AI Holly's entry and exit signals.
There is no speed difference between the desktop and web versions, but the Web version is "slimmer". It doesn't have the Market Explorer, the Brokerage Plus module or external linking. Other differences are that you can only load 5 charts at a time. The Web version includes sound alerts with the exception of ticker call-outs. Certain color coding options and a few visual features like graphical indicators are also not supported in the browser-based version.
This video will guide you through the Web version:
To log into the Web Version, head here.
Running TI on a Virtual Machine:
Windows 365 or Amazon WorkSpaces are functioning as a "remote PC in the cloud running Windows". You connect to it via the internet and then you use it on your local device as if to was your local PC. You can install programs, run them and browse the web just like on any other PC. Everything displays on your screen and your keyboard and mouse are your controls. If you don't switch it off, this remote machine keeps running and also keeps connected to the internet no matter what happens to your local device.
Here are two videos that shows how you can use Trade Ideas in combination with Windows 365:
Here's a video that shows how you can use Trade Ideas in combination with an AWS:
Market Dashboards
The Trade Ideas Market Dashboards are a browser-based platform designed to offer a flexible, on-the-go solution for tracking and analyzing stock market activity from any device. Unlike the TI Pro software, which is a more feature-intensive desktop application, our Market Dashboards are streamlined for web access, allowing users to monitor essential market insights without needing a dedicated desktop setup.
Access Levels
The Market Dashboards data depth depends on your access level. We offer a total of 3 different access levels.
Level 1: Anonymous Visitor = Delayed Data + Blurred Elements
Anonymous visitors gain access to 15-minute delayed stock market data.
After a fair-usage period, certain parts of the Market Dashboards will get blurred.
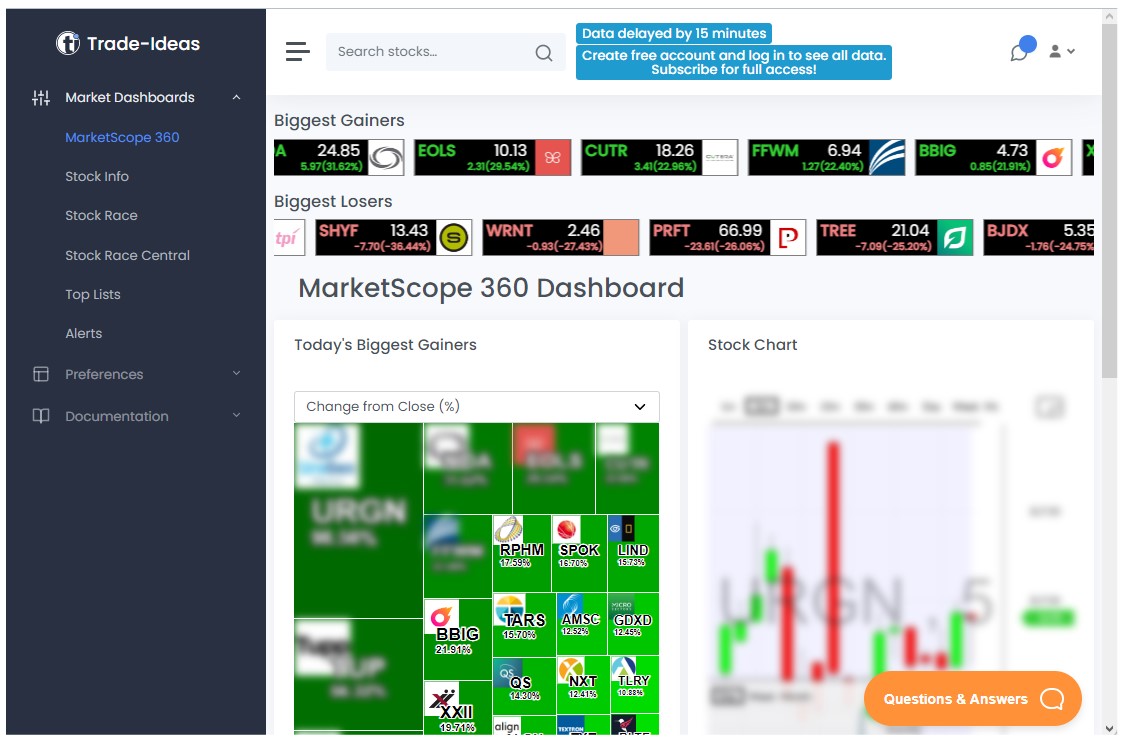
To keep enjoying access to the delayed data mode without blurred images, you'll need to create a free account.
Level 2: Free TI Membership = Delayed Data
Free Account Members gain access to 15-minute delayed stock market data without blurring.
Only your name and a valid email address are required to continuously receive on-the-go market insights.
Here's how to create a free account:
- Head to the main Market Dashboard
- Click on 'Create free account' at the top of the page.
- In the next screen, click on 'Create one for free' at the bottom.
- Fill in the form by providing your email address, creating a password, and adding your first and last names.
- After you've filled in your details, click on 'Sign up.'
- You'll receive a welcome email with an activation link. Click on the link to activate your account.
Once your free account is set up, sign in using the link on the top right-hand side. After logging in, you'll find that the blur has disappeared, and you can view all the data clearly.
Level 3: Paid TI Membership = Realtime Data
To gain access to real-time market data, sign up for our Standard Plan or Premium Plan, which includes access to our on-the-go Market Dashboards.
Please note: Since users can only run one live market data instance of TI Pro at a time, real-time data on the Market Dashboards needs to be manually enabled.
To switch from delayed to live data mode, select Preferences, and then Settings in the Sidebar. Under User Settings, select Live as the data mode.
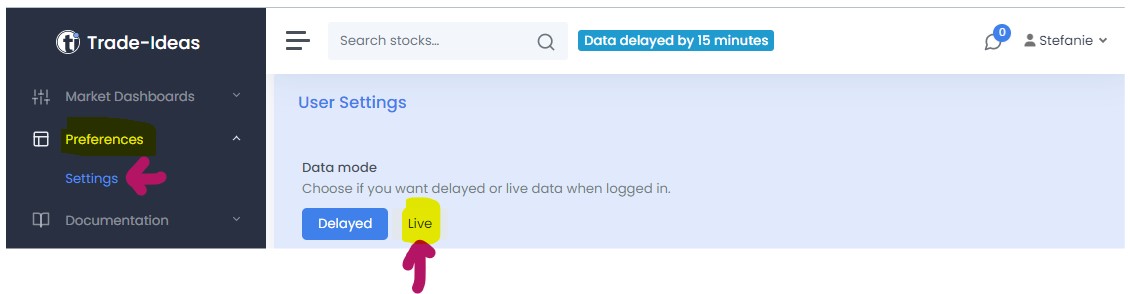
Please note: Enabling live data in the Market Dashboards will log you out of any other TI Pro session. To switch back to another instance of TI Pro, simply reset your connection on the device you would like to use next:

Trade Ideas Scope 360
The Trade Ideas Scope 360 Dashboard is designed to keep you current with the constant ebb and flow of the market through insightful real-time visualizations (with a paid account, otherwise 15-minute delayed).
Features of the Trade Ideas Scope 360 Dashboard:
Top Market Movers: At the very top of the Dashboard, you'll find continuously updating scrolling lists of the day's biggest gainers and losers. A click on a particular ticker will display it in the chart below.
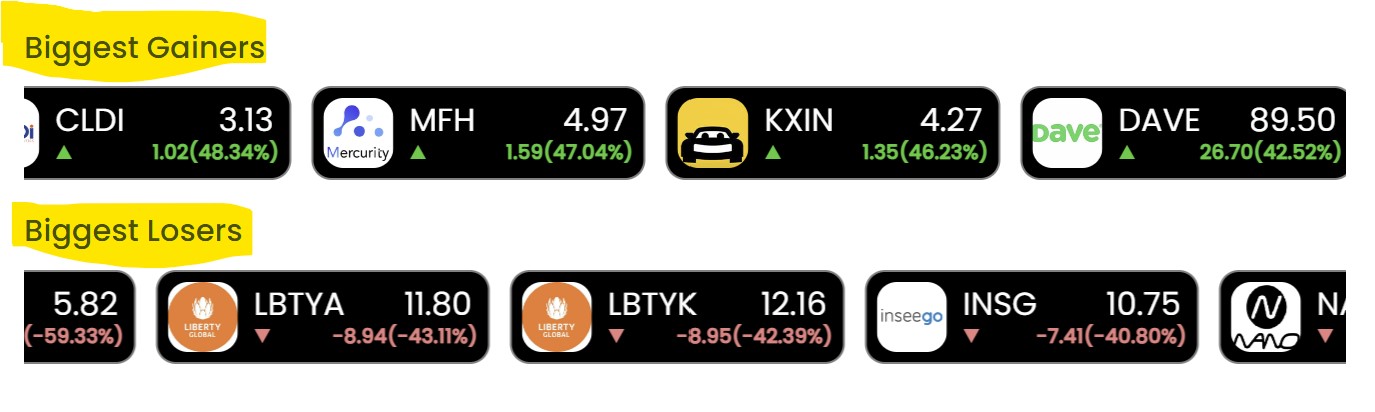
Heat Map with Money Machine: Right beneath the Top Market Movers is the Heat Map, also known as the Tree Map. This feature provides real-time visualization of significant stock movements. The Money Machine (demo mode) simulates constantly trading the top 3 stocks of the heatmap.
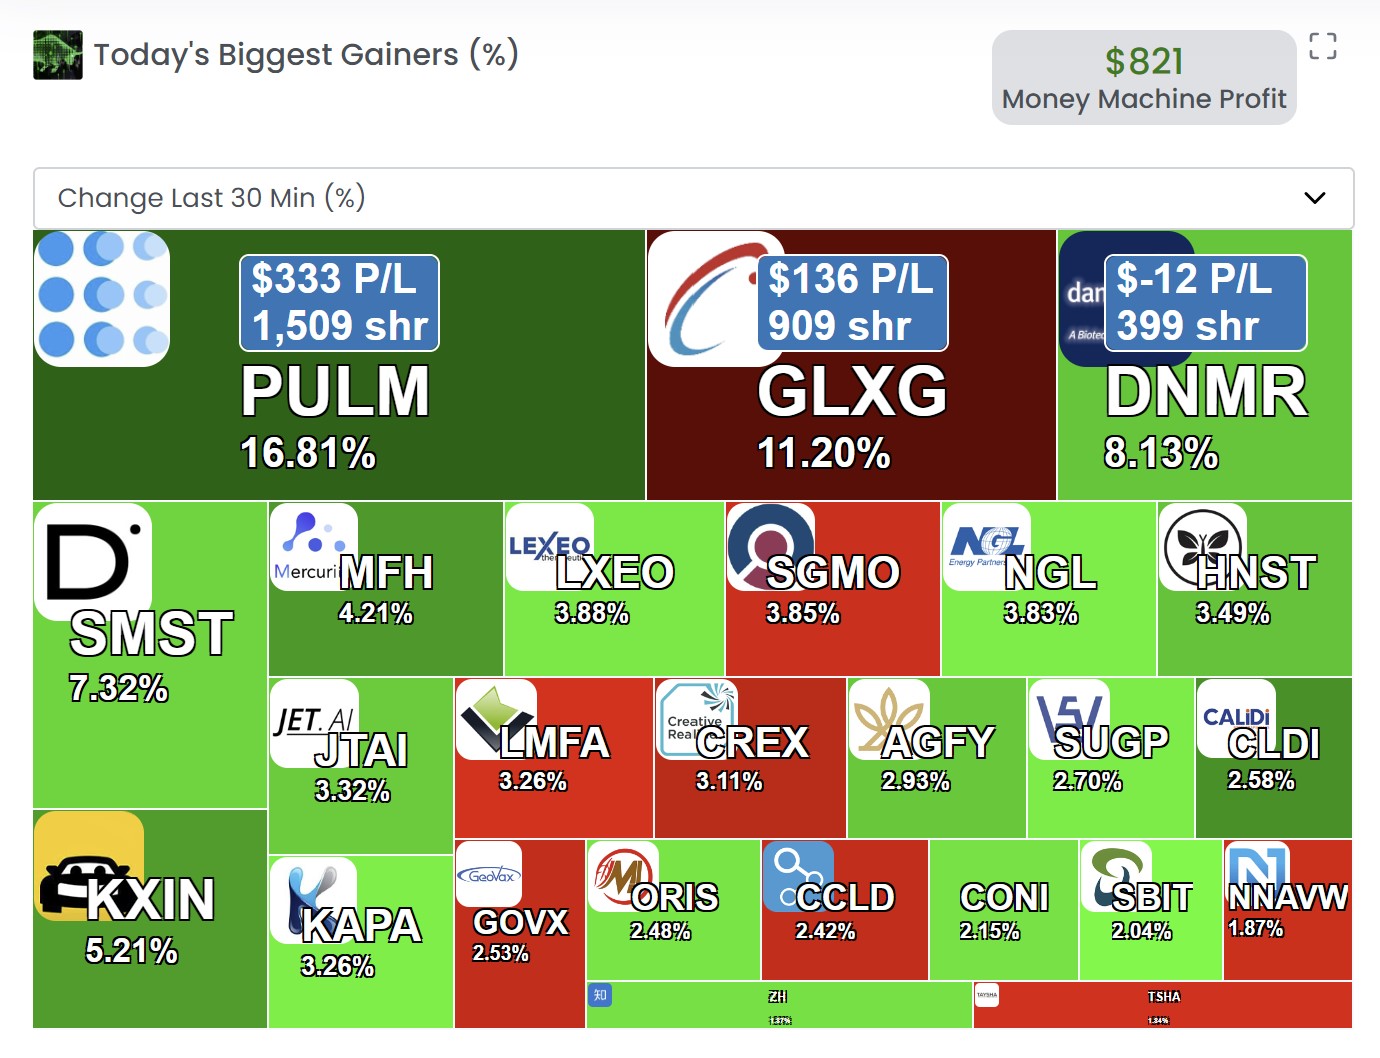
The Money Machine trade size can be adjusted under My Settings > Site Preferences > Money Machine Settings (with a paid account).
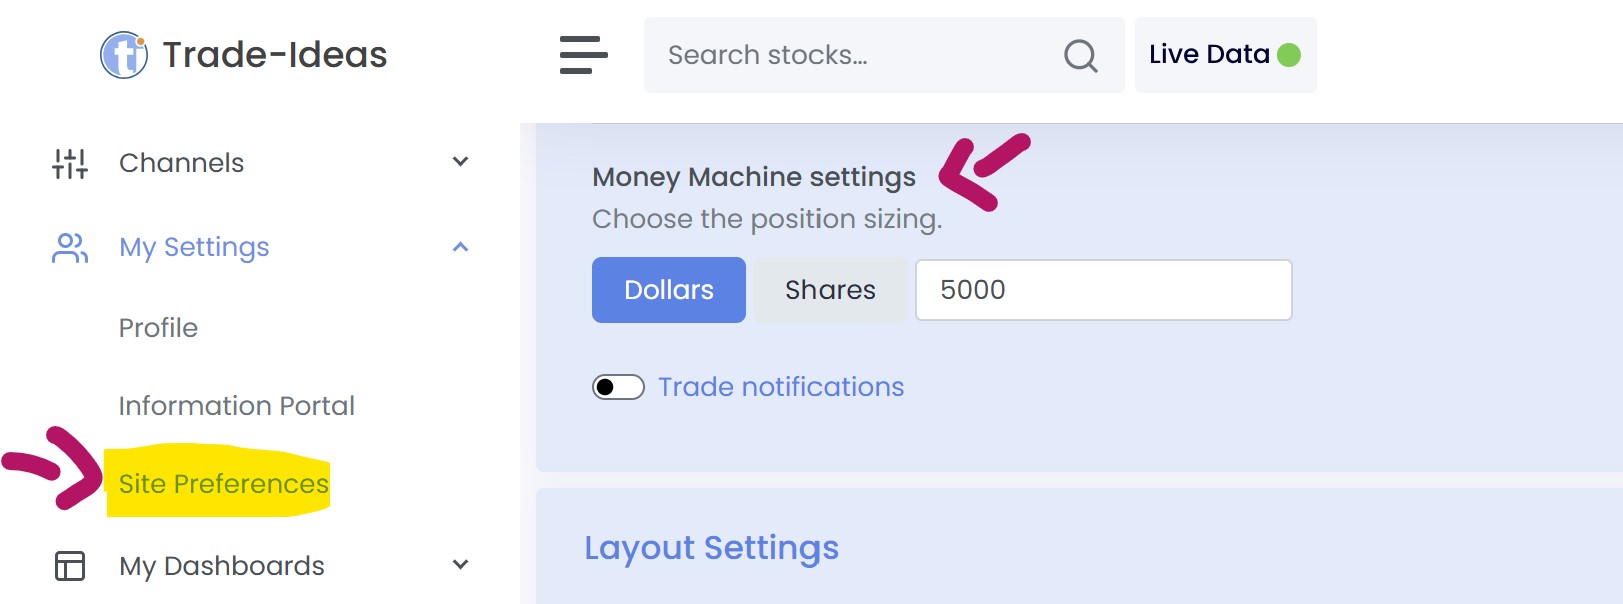
To cater to diverse trading strategies and preferences, the data display on the Heat Map can be adjusted according to 'Change from Close', 'Change from Open', 'Change in the last 30 minutes', 'Change in the last hour' etc.
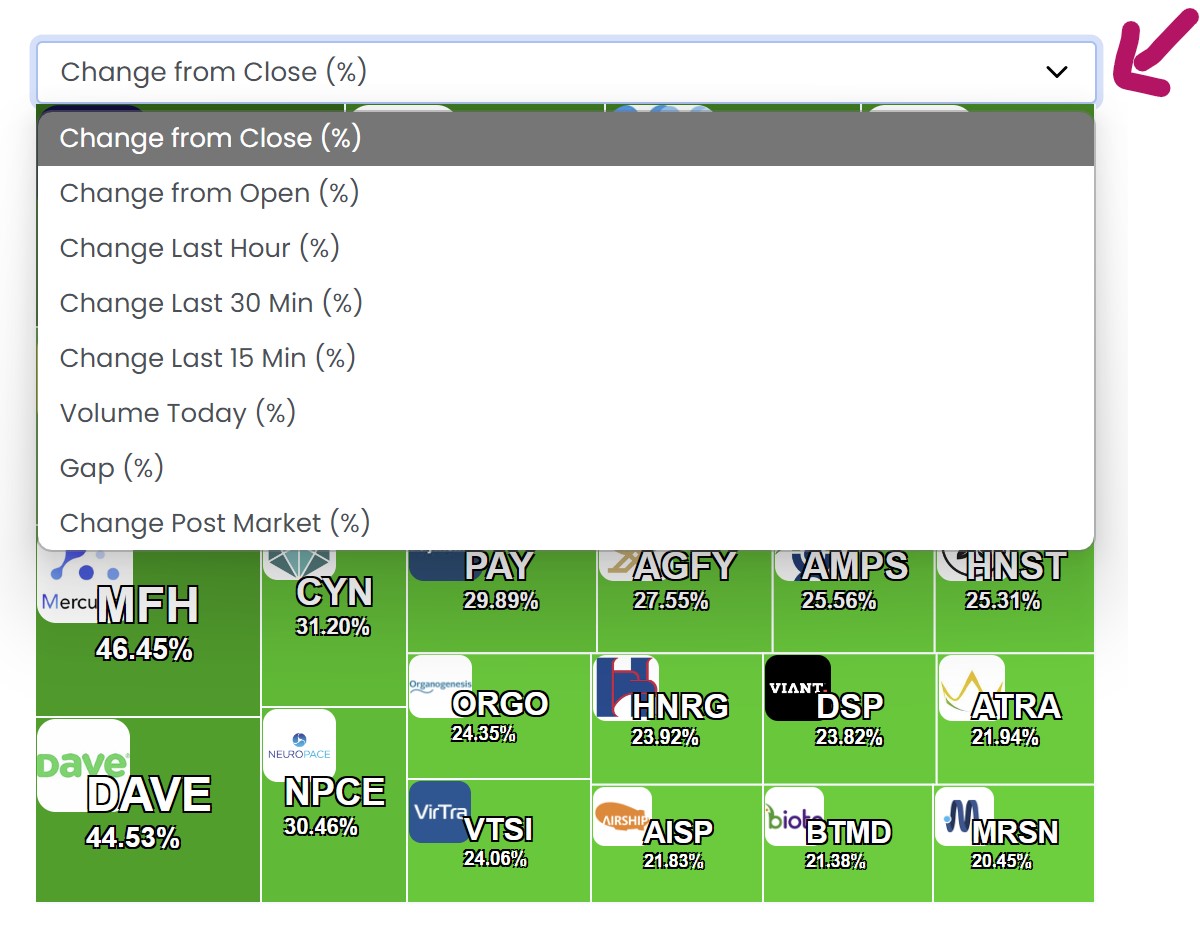
Stock Chart: The Chart allows you to adjust the time-frame from 1-minute to monthly for both the main chart as well as the smaller picture-in-picture chart.
Stock Race with Money Machine: The Stock Race provides a dynamic snapshot of the stocks currently on the move. Unlike the previous sections, the Stock Race offers a more live-action view. The Money Machine (demo mode) simulates constantly trading the top 3 stocks of the race.
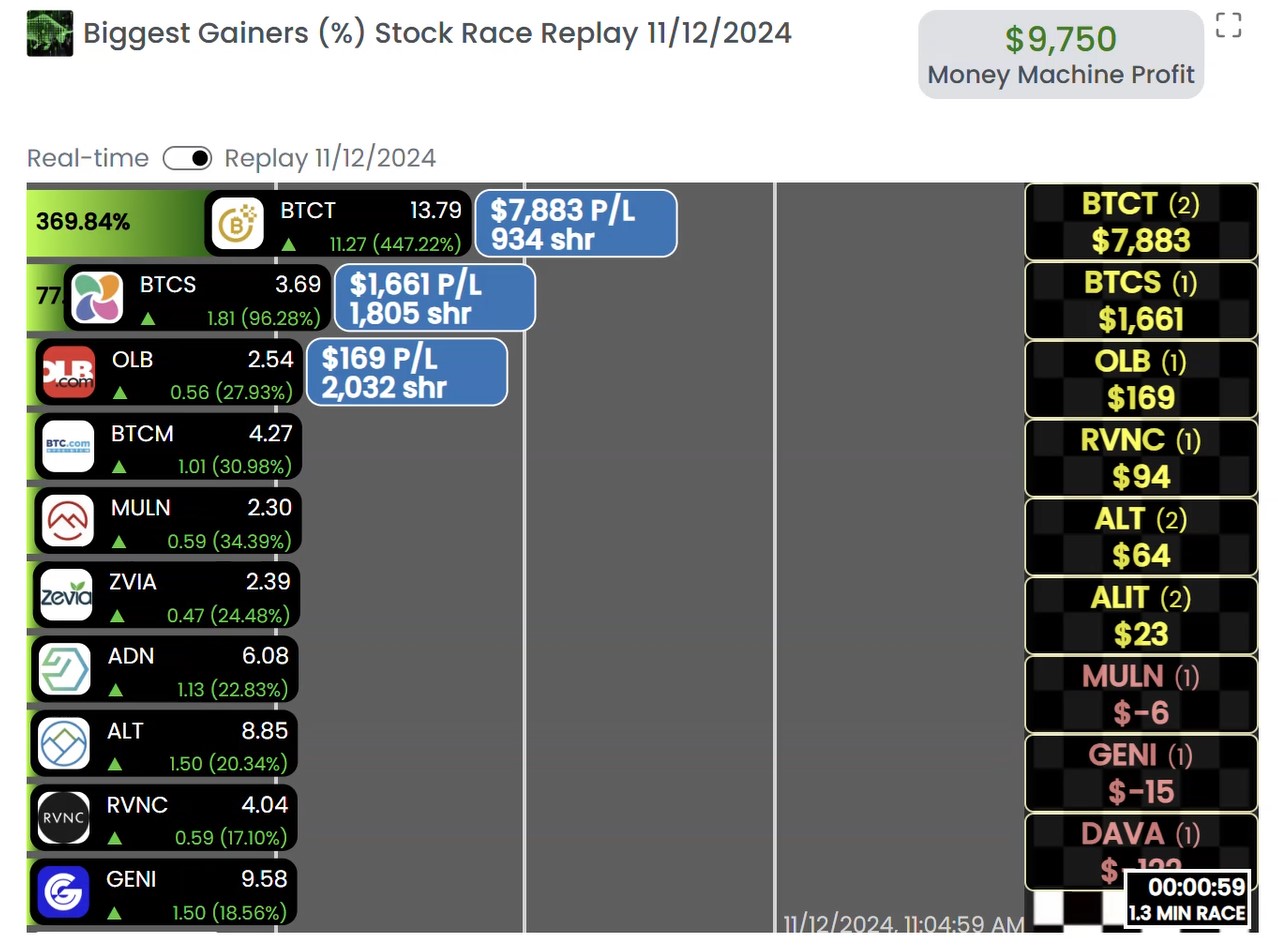
The Money Machine trade size can be adjusted under My Settings > Site Preferences > Money Machine Settings (with a paid account).
Market Pulse: The Market Pulse compares New Highs versus New Lows. It is a great visualization tool that can provide a quick indication of what the markets are up to at any given time. The green line is representing the bulls, the red line, the bears measured in Alerts/Second. You can see the lines update in real-time (with a paid account). The cylinder score on the right-hand side reflects the percentage of highs versus low or bullish versus bearish.
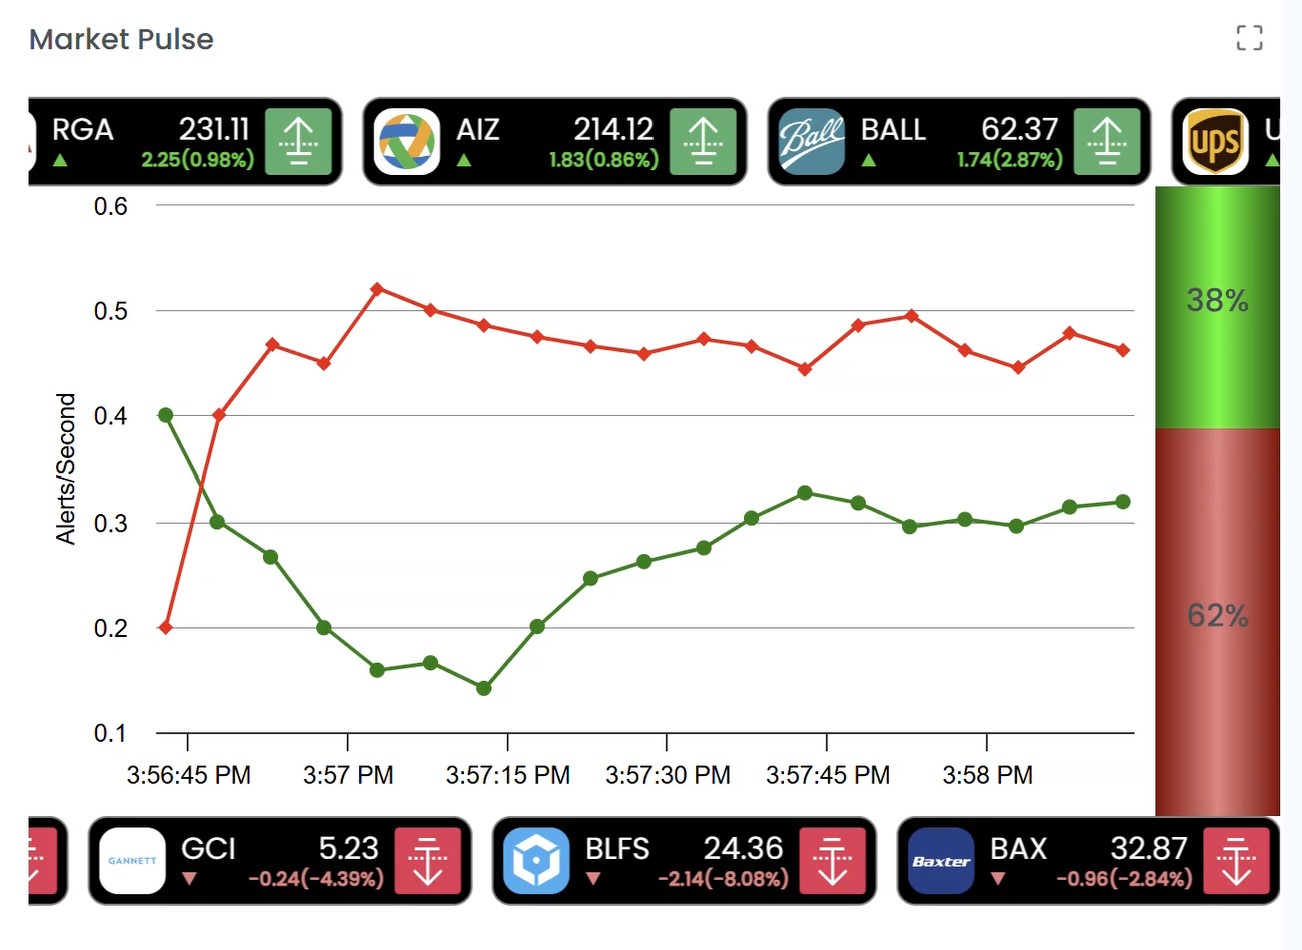
Advancers and Decliners Distribution: To the right of the Stock Race, you'll find the Advancers and Decliners Distribution. This feature gives you a clear picture of the number of stocks that are up and down for the day, alongside the degree of their change. Think of this as a diagnostic tool that lets you peek under the hood of the market's overall performance.
SectorScope360
The Sector Scope 360 Dashboards enables you to quickly and easily monitor how the different sectors are performing at any one time.

Advancers and Decliners Distribution: The Advancers and Decliners Distribution gives you a clear picture of the number of stocks that are up and down for the day, alongside the degree of their change. Think of this as a diagnostic tool that lets you peek under the hood of the market's overall performance.
Watch this video to see how this dashboard can help you to find strong stocks on red days. This is just one use-case of many:
Stock Deep Dive
The Stock Info Dashboard is your go-to hub for rapid stock intel. It provides a comprehensive snapshot of your chosen stock.
Features of the Stock Info Dashboard:
Stock Details: The cornerstone of your stock research, the Stock Info section is a snapshot containing critical metrics such as today's volume, the change from the close, earnings per share, short float, outstanding shares, as well as the company's revenue, cash and debt.
Stock Profile: The Profile tab offers valuable insights into the company's operations, location, establishment date, and the sector it operates in. So, for instance, if you're exploring Apple, all pertinent information about Apple will be neatly displayed in this section.
Stock News: For real-time updates about your chosen stock, the News section is constantly refreshed with the latest news articles from across the net. Clicking on a news headline opens up a new browser window containing the news story, keeping you informed and aiding your decision-making process.
Stock Chart: The Chart section allows you to adjust the time-frame from 1-minute to monthly for both the main chart as well as the smaller picture-in-picture chart.
Competitors Stock Race: The Competitors Race feature offers a comparison of the performance of your chosen stock against its competitors. This helps you benchmark performance and potentially uncover other high-performing stocks in the same sector. For a more in-depth understanding of any stock participating in this race, a simple click will load the ticker into the Stock Info as well as the chart.
Stock Momentum
The Stock Momentum Dashboard enables you to monitor two stock races simultaneously, providing real-time insights into relative strengths and weaknesses according to your preferences.
The intuitive and interactive drag-and-drop interface ensures a trading experience that's both engaging and enlightening.
To customize the races, simply drag and drop one of the desired icons above the races into a race field. Each icon represents a dedicated race preset.
Clicking on any stock within these races will open the Stock Info Dashboard, where you can view the stock's chart, catch up on the latest news for the ticker, and learn all the essential facts about the company.
Top Lists Dashboard
The Top Lists Dashboard is showcasing the day's biggest gainers at a glance, at the same time providing some essential metrics like Volume Today in Shares and Position in Range for each symbol.
Clicking on any ticker in this list will bring up its chart for further analysis.
Personalize this dashboard by simply dragging and dropping different presets, which are represented by the icons at the top, into the Top List.
A click on a header column will sort the Top List results accordingly, either from A to Z or from Z to A.
PositionScope
The Position Scope Dashboard enables you to efficiently manage your paper trades. Here, you can view all submitted orders, recent trade executions, and a summary of your current positions, including your P&L.

One crucial step is to switch your Dashboards to live data mode in the settings.

Watch the following tutorial for a quick walk-through of Dashboard trading and the Position Scope:
Portfolio Master Challenge
At Trade Ideas, we hold regular Portfolio Master Challenges (PMC). This Dashboard shows the top 10 traders of the currently active or last PMC on the Leaderboard as well as the stocks with the biggest moves that our top traders are trading during a competition.
For more info about our PMCs head here
Web Trading
You can paper trade directly from the charts of our Market Dashboards and check your simulated positions in the Position Scope. For anyone not on a Windows device, this is the perfect training center to hone your trading skills and do trading reps.
One crucial step is to switch your Dashboards to live data mode in the settings.
Watch the following tutorial for a quick walk-through of simulated trading on the Market Dashboards:
Preferences
You have the ability to personalize your Market Dashboards in various ways. Once you've set these preferences, the app remembers them as you navigate the different Market Dashboards ensuring a seamless, personalized experience.
To do so, access the Sidebar on the left-hand side, navigate to the Preference Tab and click on Settings.
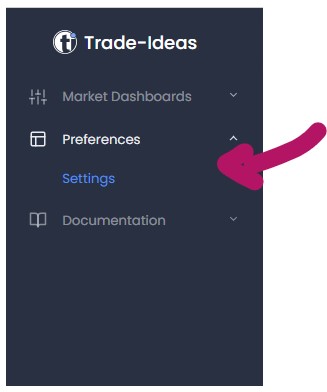
Color Scheme
You can choose from four different color options:
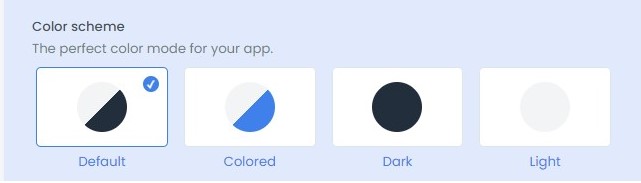
-
Default: If you want your layout to match your system settings, select 'Default'. This way, the color scheme will adjust according to your system settings, providing a seamless experience.
-
Colored: Choose 'Colored' to make your sidebar pop with a fresh blue tone.
-
Dark: If you prefer a subtler, darker look, choose the 'Dark' setting. This will instantly transform not just your sidebar, but the entire Market Dashboards Layout into a sleek, dark theme.
-
Light: If you prefer things bright and clear, the 'Light' setting is your best bet.
Sidebar Behavior
You can tailor the behavior of your sidebar according to your preferences:
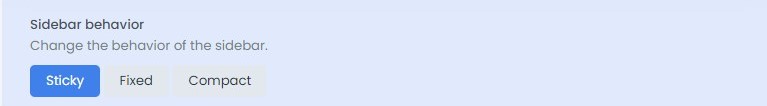
-
Sticky: This option is perfect if you want your sidebar to always stay within sight. With 'Sticky' selected, as you scroll through the page, the sidebar remains conveniently visible at the top of your viewport.
-
Fixed: With 'Fixed,' your sidebar stays exactly where it is and doesn't scroll along with the rest of the page.
-
Compact: If you appreciate a clean, uncluttered workspace, 'Compact' is the setting for you. This setting minimizes your sidebar, making it tidy and compact. All sections will still be easily accessible. Simply hover over an icon and a menu will pop up.
To hide or unhide the sidebar, simply click on the three lines at the top.
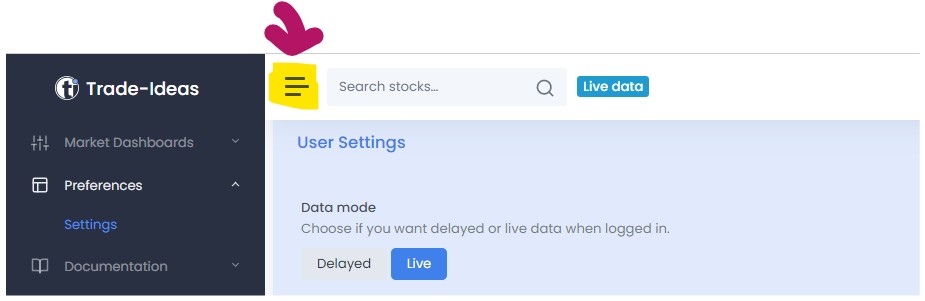
Stock Details Layout
By default the stock details, the company profile and the ticker news are separated into three different segments.
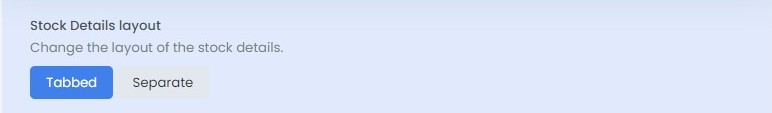
Select 'Tabbed' and all stock information will be neatly organized in individual tabs when you revisit the Market Dashboards:
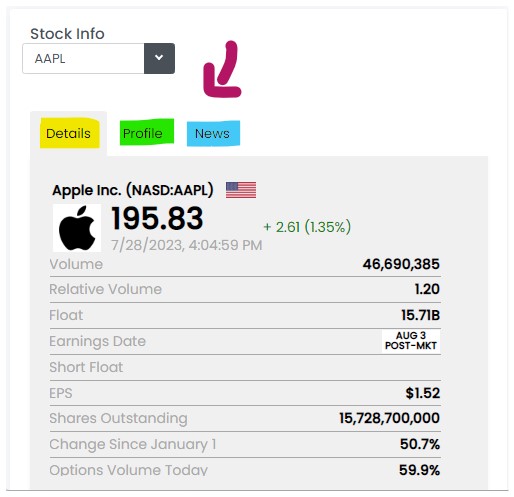
Data Mode
When you first sign into your paid account, you won't immediately receive live data. This is due to the limitation that live data can only be accessed by one instance of Trade Ideas at a time.
To prevent you from being inadvertently logged out of our Windows software or the Web version by visiting the Market Dashboards, you will need to manually enable the live data stream.
Here are the steps:
- Head to the Sidebar
- Go to 'Preferences.'
- Click on 'Settings.'
- Scroll down to the 'User Settings' section.
- Switch from 'Delayed' to 'Live Data.'
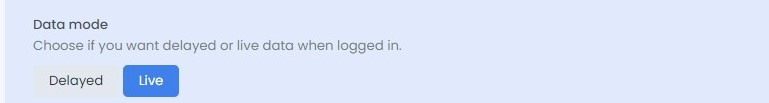
Once you've made this change, you will start receiving live data immediately. However, if you are using our Windows software at the same time, you will notice that you've been logged out, which you will see on the status bar turning red.
To log back into this instance, all you need to do is:
- Go to the Toolbar
- Open the 'Accounts' tab.
- Select 'Reset Connection'
Doing so will immediately re-enable live data on this instance of TI Pro and turn the status bar green.
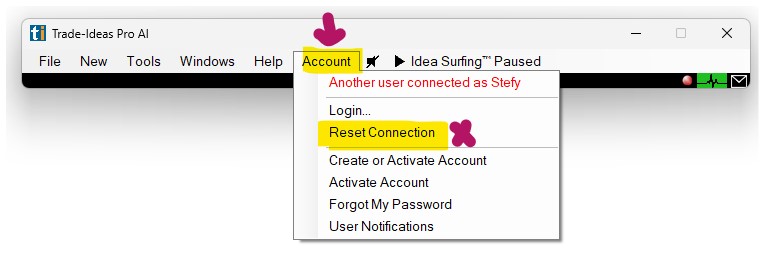
Browser Notifications
If you want to stay up to date with race winners or stocks making new Highs and Lows whilst browsing other pages, or focusing on other tasks, simply enable browser notification.
This way, the moment there's a new race winner, or a new alert, you'll get notified.
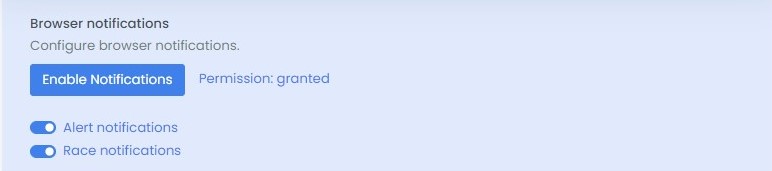
-
On Windows these notifications will appear in the bottom right-hand corner of your screen.
-
On Macs they will appear in the top right.
These browser notifications are similar to the pop-up notifications you might receive from other apps such as Slack or Gmail.
They enable you to carry on with other tasks whilst staying in the loop.
Chart Settings
You can choose from three chart preset, each tailored to a different type of trader and their preferred time frames.
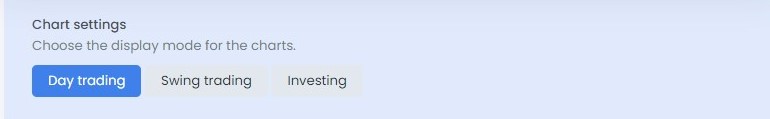
-
Day Trading: This chart preset will display a five-minute chart along with a daily picture-in-picture chart in all your Market Dashboards.
-
Swing Trading: This chart setting will load a main daily chart and a weekly picture-in-picture chart in all your Market Dashboards.
-
Investing: This chart option provides a weekly chart and a monthly picture-in-picture chart.
In-App Notifications
The Message Icon on the top right-hand side of the Market Dashboards, next to your Profile Name, will display important In-App Notifications.
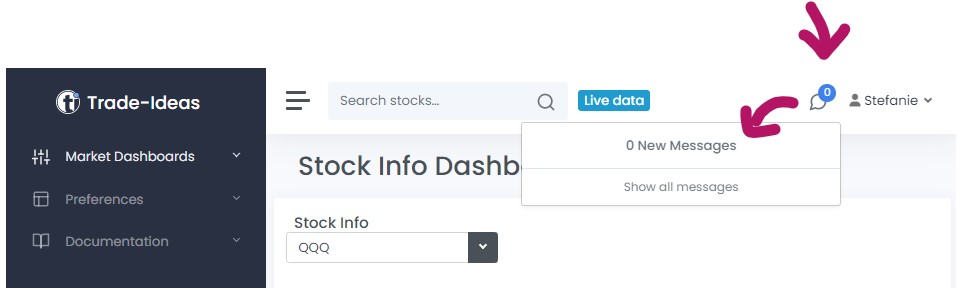
This feature is designed to serve as a direct communication channel from our team to you, the user.
These notifications could include software updates, bug fixes, critical changes, or any other relevant news we deem essential for you to know. It is your direct link to the most recent information from us and the larger market environment.