Trade Ideas Scope 360
The Trade Ideas Scope 360 Dashboard is designed to keep you current with the constant ebb and flow of the market through insightful real-time visualizations (with a paid account, otherwise 15-minute delayed).
Features of the Trade Ideas Scope 360 Dashboard:
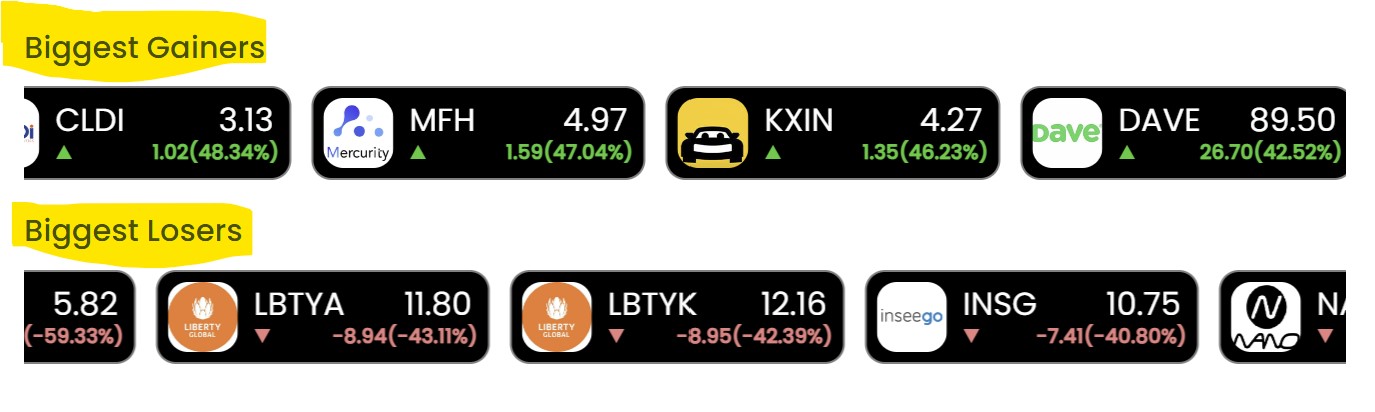
Top Market Movers: At the very top of the Dashboard, you'll find continuously updating scrolling lists of the day's biggest gainers and losers. A click on a particular ticker will display it in the chart below.
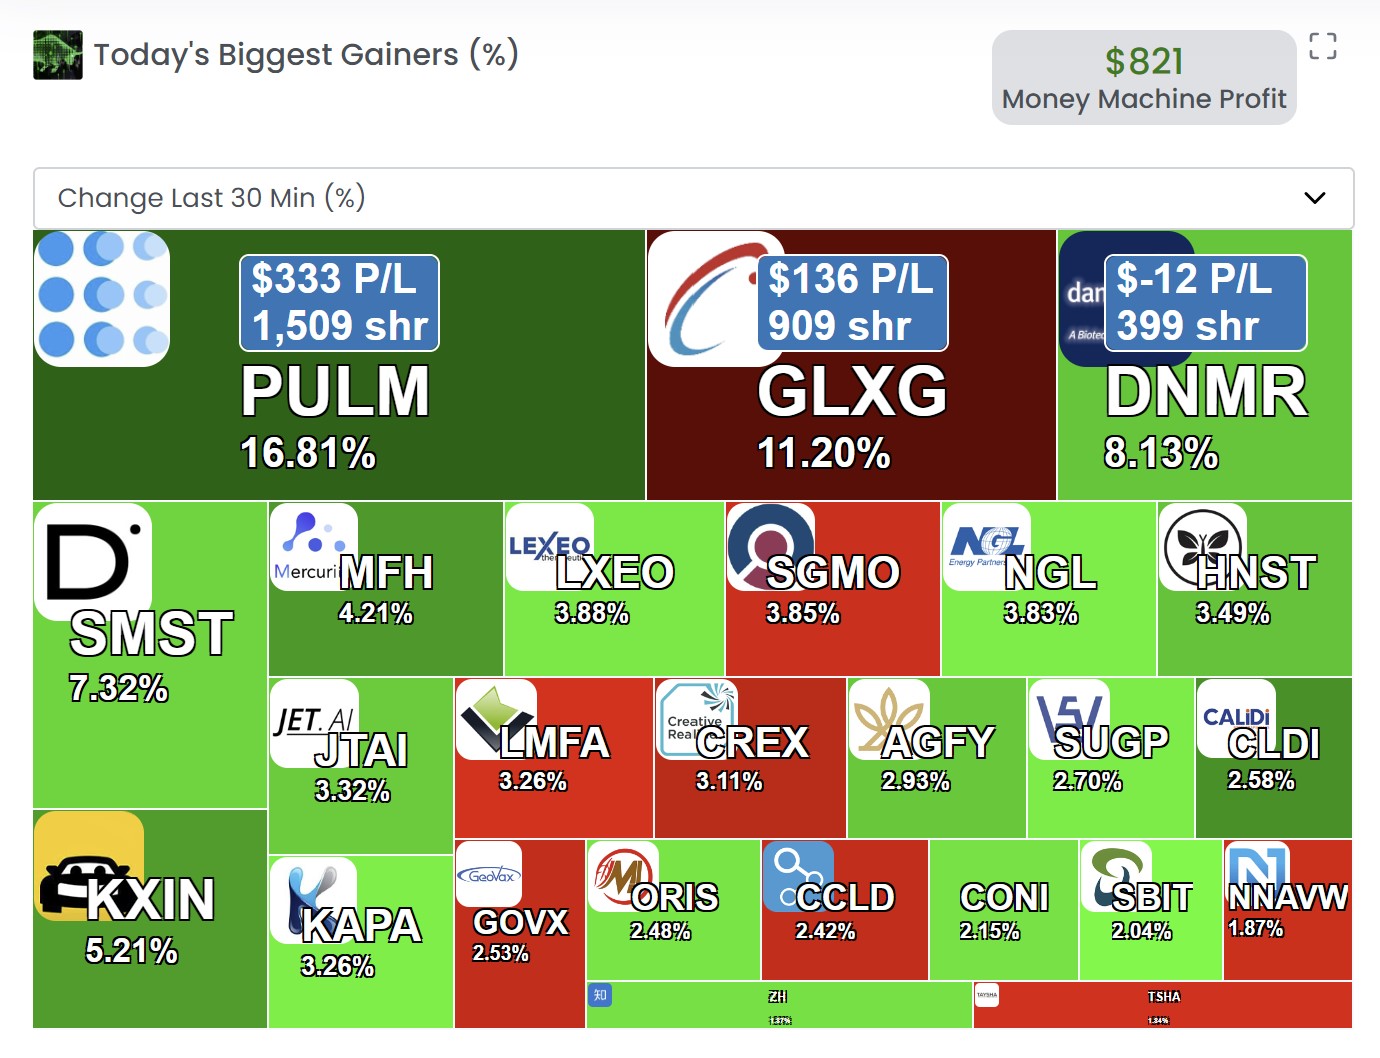
Heat Map with Money Machine: Right beneath the Top Market Movers is the Heat Map, also known as the Tree Map. This feature provides real-time visualization of significant stock movements. The Money Machine (demo mode) simulates constantly trading the top 3 stocks of the heatmap.
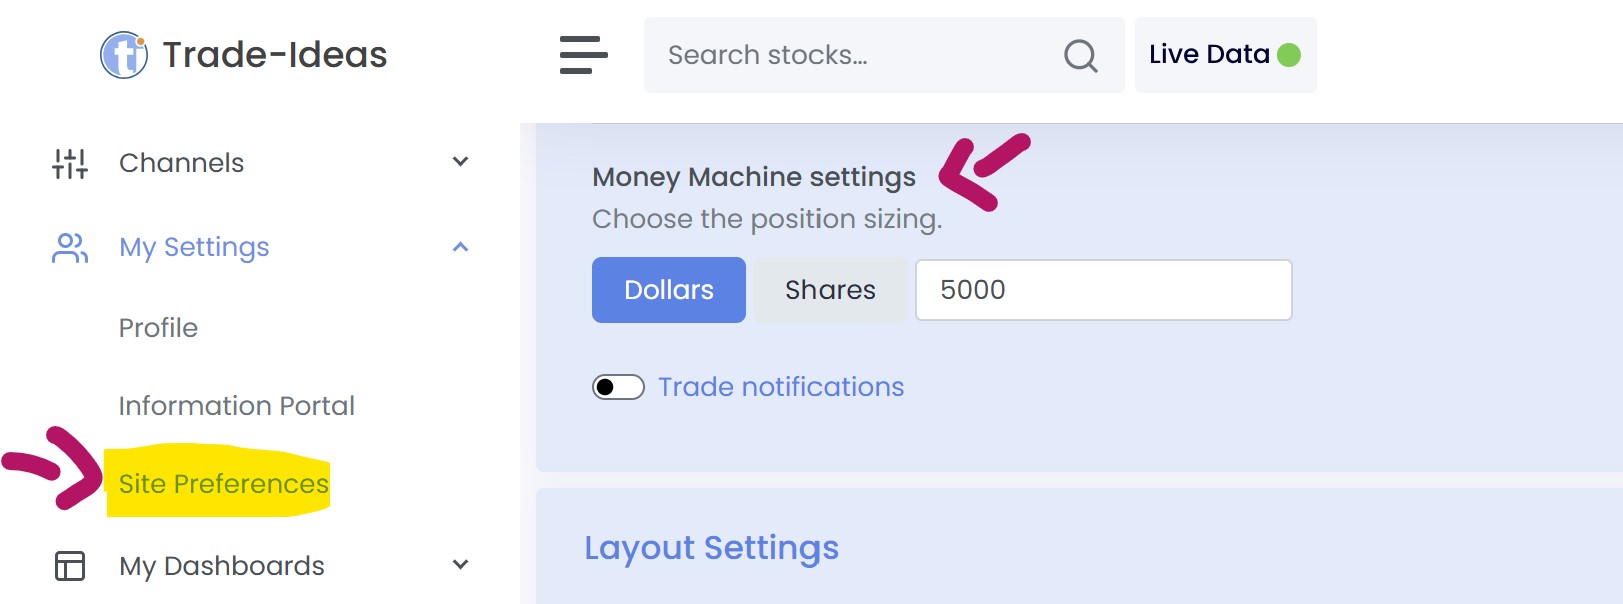
The Money Machine trade size can be adjusted under My Settings > Site Preferences > Money Machine Settings (with a paid account).
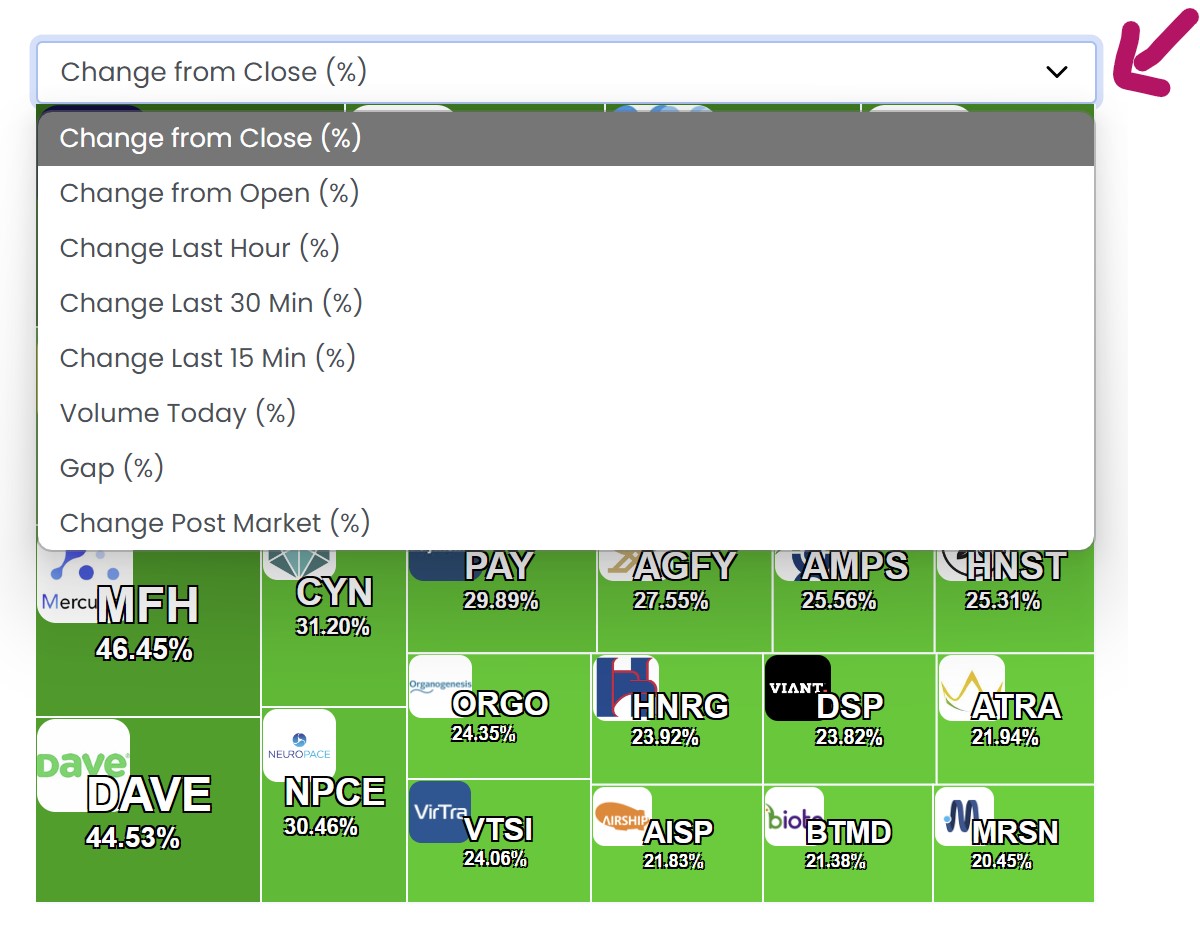
To cater to diverse trading strategies and preferences, the data display on the Heat Map can be adjusted according to 'Change from Close', 'Change from Open', 'Change in the last 30 minutes', 'Change in the last hour' etc.
Stock Chart: The Chart allows you to adjust the time-frame from 1-minute to monthly for both the main chart as well as the smaller picture-in-picture chart.
Stock Race with Money Machine: The Stock Race provides a dynamic snapshot of the stocks currently on the move. Unlike the previous sections, the Stock Race offers a more live-action view. The Money Machine (demo mode) simulates constantly trading the top 3 stocks of the race.
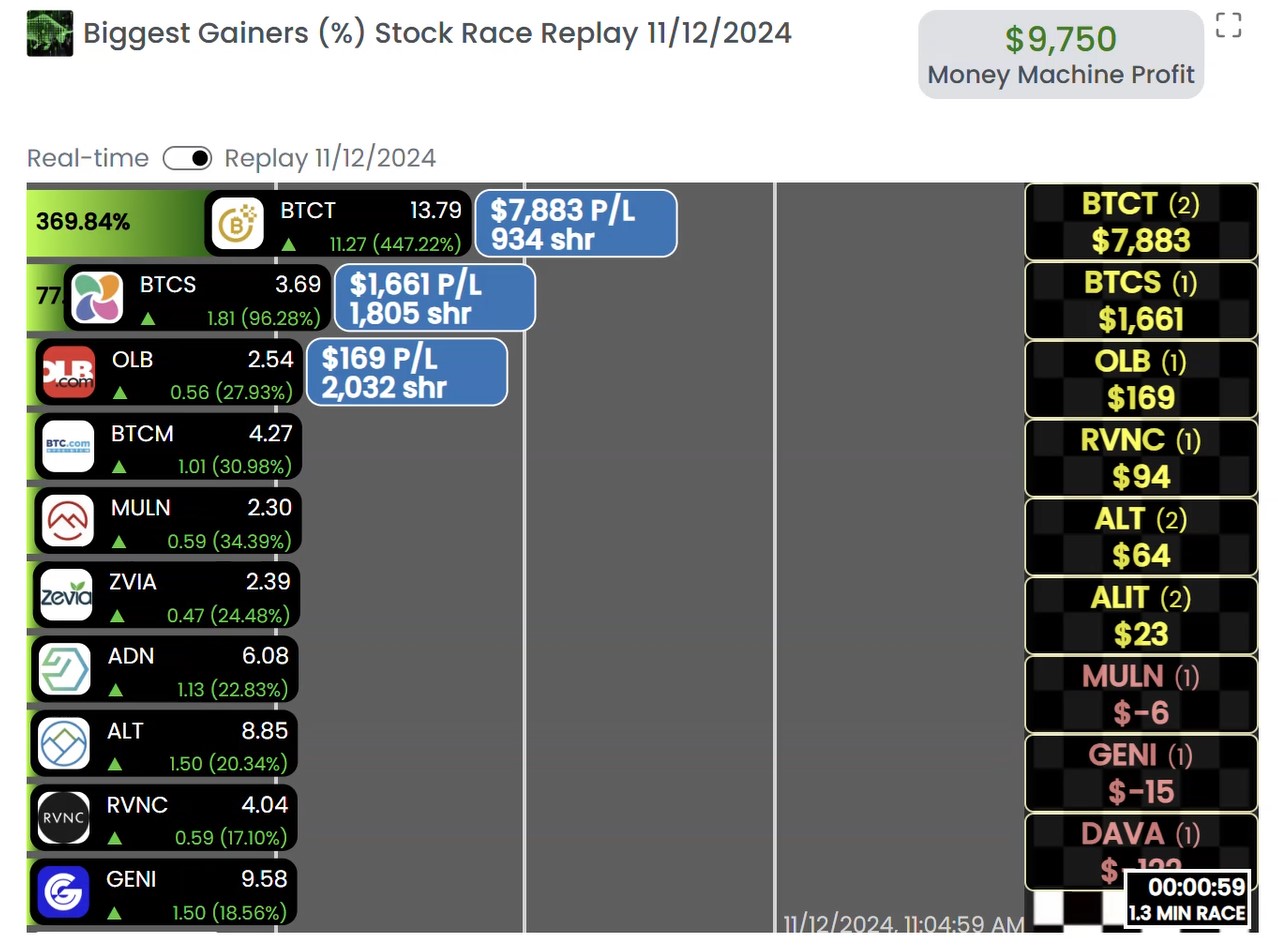
The Money Machine trade size can be adjusted under My Settings > Site Preferences > Money Machine Settings (with a paid account).
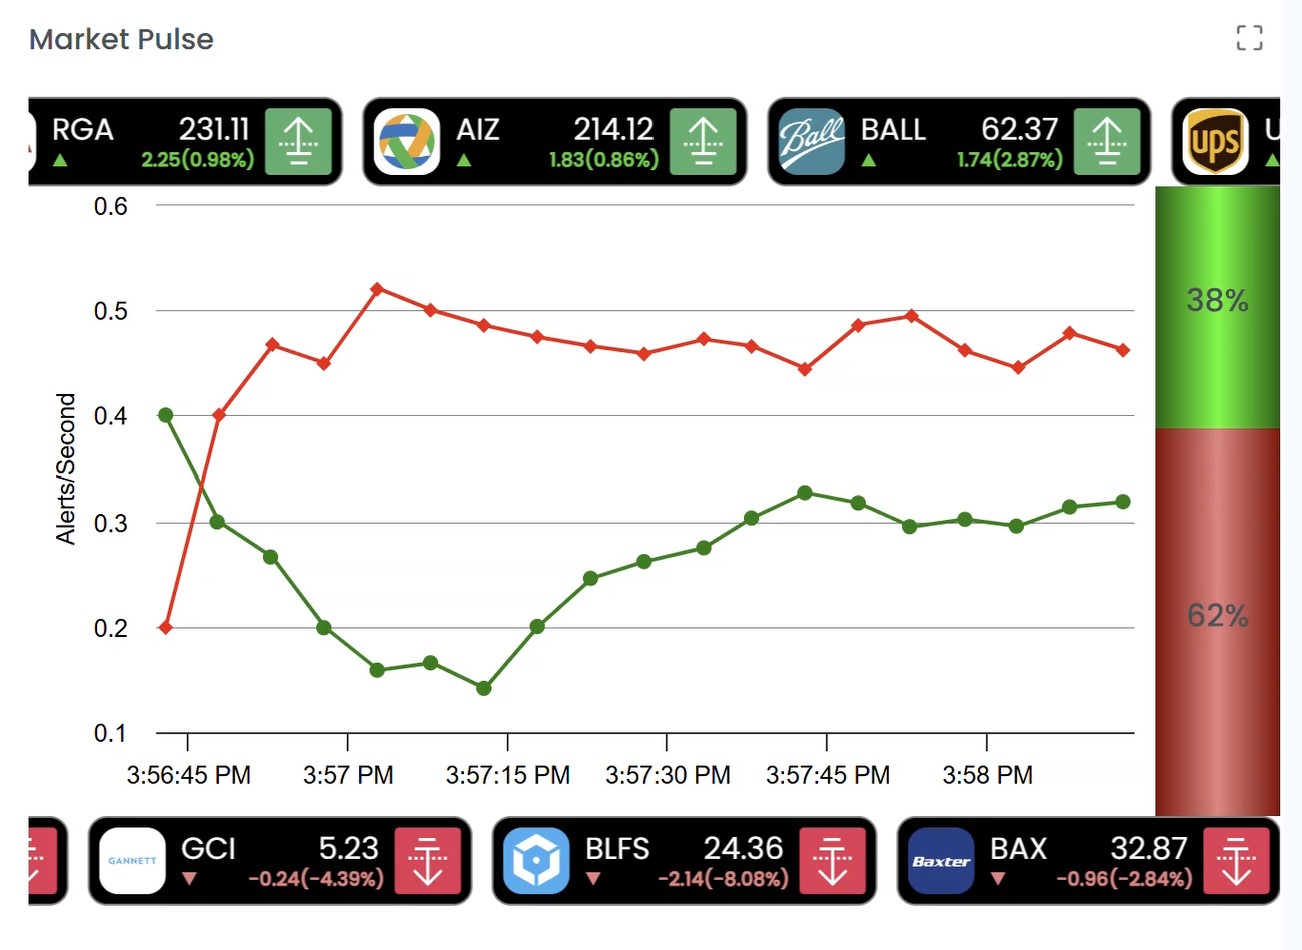
Market Pulse: The Market Pulse compares New Highs versus New Lows. It is a great visualization tool that can provide a quick indication of what the markets are up to at any given time. The green line is representing the bulls, the red line, the bears measured in Alerts/Second. You can see the lines update in real-time (with a paid account). The cylinder score on the right-hand side reflects the percentage of highs versus low or bullish versus bearish.
Advancers and Decliners Distribution: To the right of the Stock Race, you'll find the Advancers and Decliners Distribution. This feature gives you a clear picture of the number of stocks that are up and down for the day, alongside the degree of their change. Think of this as a diagnostic tool that lets you peek under the hood of the market's overall performance.