The Market Explorer
The Trade Ideas Market Explorer is a sophisticated tool that enables us to build dedicated high-performance scans for our users beyond the software’s boundaries.
To access the Market Explorer, go to the Toolbar, open the New Tab and select Market Explorer Window.
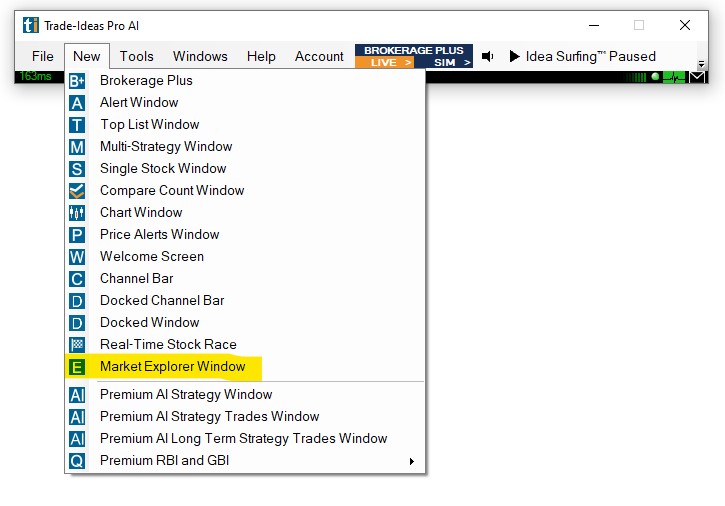
This will load the My Market Explorer Strategy Window.
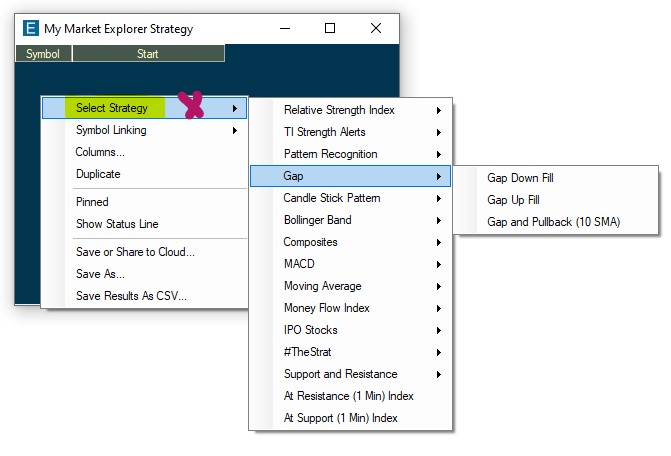
To access the available scans right-click into the window and choose Select Strategy.
Then, select a scan from the dropdown.
Current ME Scans
Relative Strength Index
TI Strength Alerts
Pattern Recognition
Gaps
Candlestick Patterns
Bollinger Band
Composites Day Trading
Composites Swing Trading
MACD
Moving Averages
Money Flow Index
IPO Stocks
The #Strat
Support and Resistance
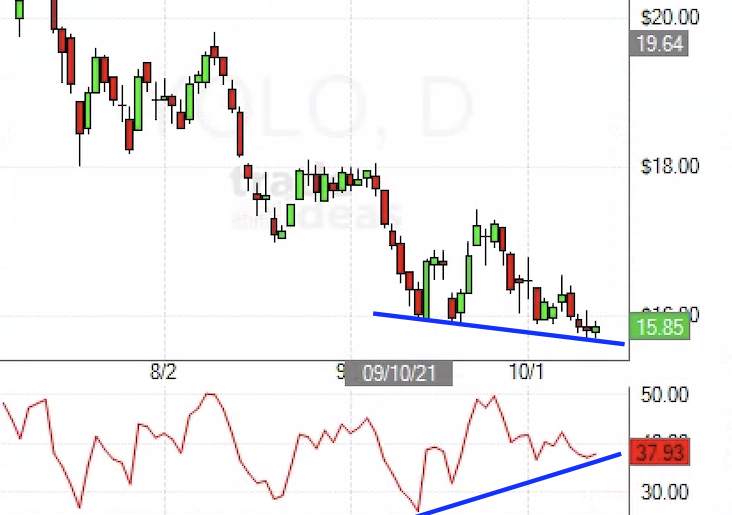
RSI Divergence Long/Short
This ME scan monitors daily charts for RSI divergences. An RSI Divergence occurs, when the Relative Strength Index starts reversing before the price does. The stock makes a new high or low in terms of price, but the RSI value does not correspondingly increasing/decreasing. This could indicate that the buyers/sellers are potentially running out of steam. Simply put, an RSI divergent strategy is a revision to the mean strategy using the Relative Strength Index as the momentum indicator. Traders often combine this strategy with technical patterns to spot reversal points.
Michael Nauss of Trade Ideas discussing RSI Divergence on Trader TV:
TI Strength
TI Strength is a relative strength system that uses a series of indicators and technical patterns to detect and trade the strongest stocks in the market. Combine this backtested system with technical analysis to ensure that you are trading the market’s current strongest names.
Michael Nauss of Trade Ideas discussing our TI Strength Alerts Scan and Newsletter:
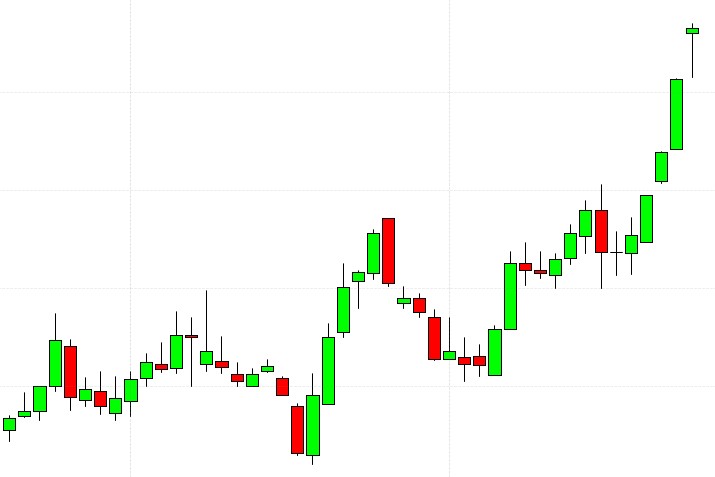
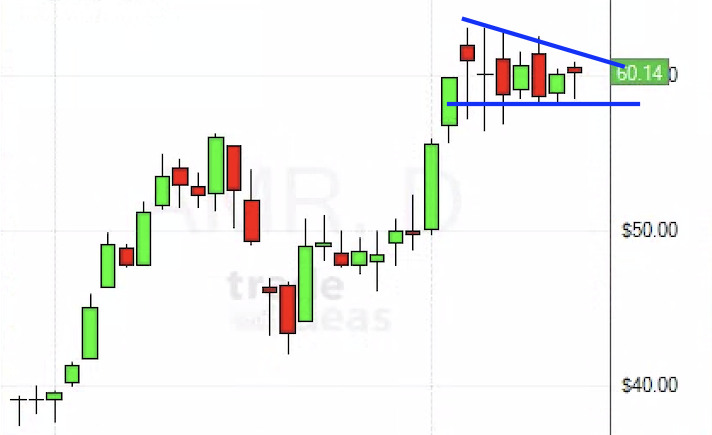
Bull/Bear Flag
Bear and Bull Flags are classic technical patterns on the daily chart. This ME strategy is looking for stocks that made a recent move higher (Bull Flag) or lower (Bear Flag) and thereafter move sideways for a few days. This consolidation gives traders a well-defined area to enter in the direction of the trend as well as a well-defined support level.
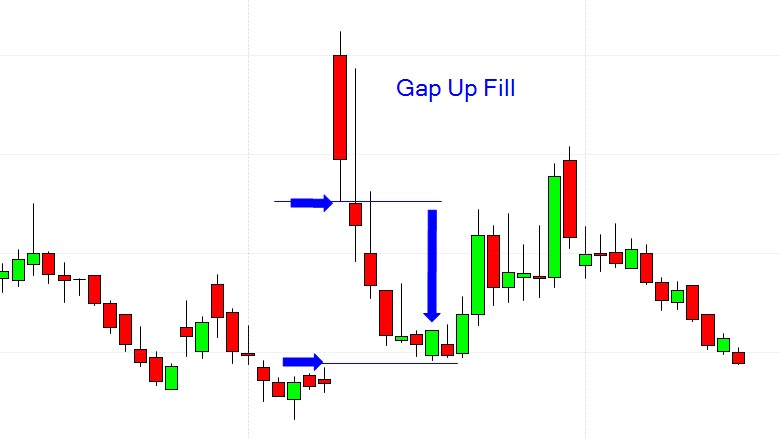
Gap Up/Gap Down Fill
This ME Strategy is looking for large gaps to be filled, meaning for the price to move back to the starting point of the gap. Gaps occur unexpectedly, they form on a chart, when the price of a stock moved sharply up or down, with little or no trading in between. These levels often act as support/resistance since funds that missed the move might get in. Due to the lack of immediate support/resistance, a stock that starts to fill the gap seldom stops. Gap-fill stocks are considered filled when their price retreats to the original pre-gap level.
Michael Nauss of Trade Ideas discussing Gap Fill Trading on Trader TV:
Gap and Pullback (10 SMA)
Here's another scan focussing on Daily Gaps, but this time, we aren't looking for gap fills, we're looking for the 10 SMA to act as a support, and the stock to hold its gap. Price can catch up to an SMA in two ways: Either by pulling back, or by moving sideways. No matter how the catch-up happens, look for the 10 Day Moving Average to act as support and to provide a good entry level.
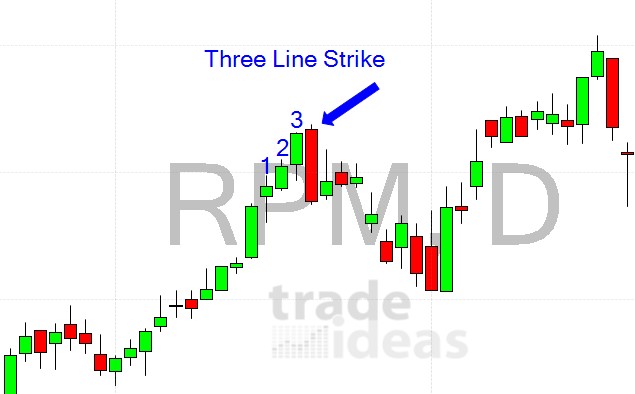
Three Line Strike (Short/Long)
The Three Line Strike ME Strategy is scanning the market for stocks that had 3 down days/up days in a row which are followed by an engulfing candle that erases all the previous selling/buying pressure in one fell swoop. The idea behind this scan is to find trapped sellers/buyers who could fuel the move.
Inside Bar & Inside Day
These scans are looking for stocks where the current bar is trading within the previous bar. Inside Bars can be very useful for trend continuation setups since any inside bar represents a consolidation on a lower timeframe.
Abandoned Baby
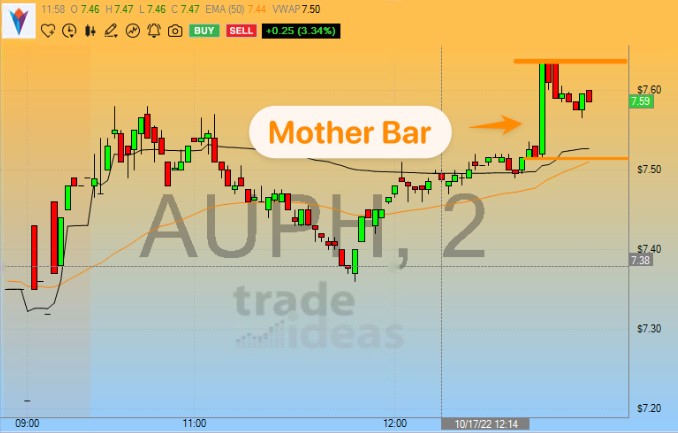
Mother Bar
In this setup we are looking for one large bar that starts to contain many small candles. The idea is that the small bars represent resting after a large move. We are looking for and are awaiting continuation of this move.
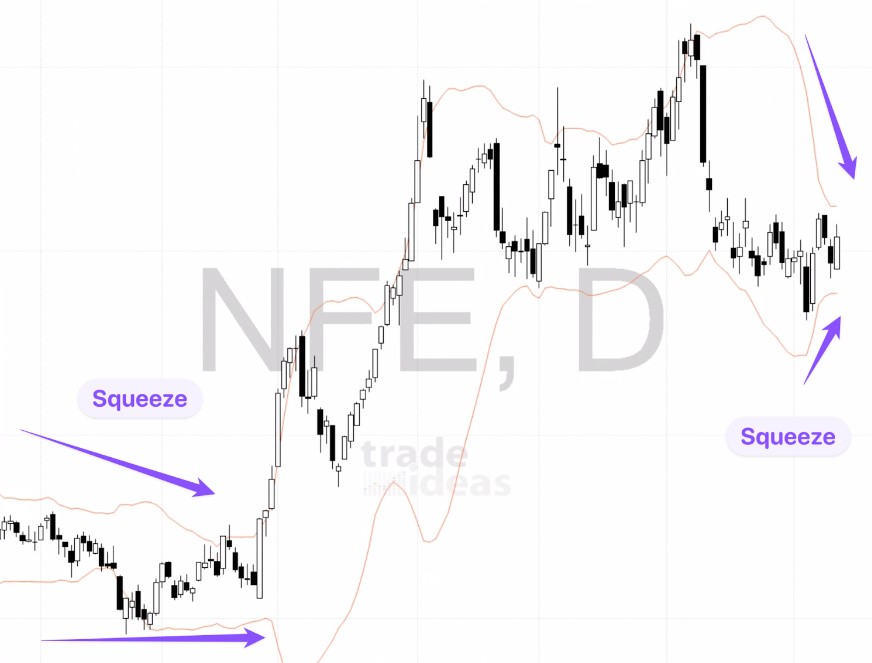
Bollinger Band Squeeze aka TTM Squeeze
The Bollinger Band Squeeze works off the idea that volatility is mean reverting. With the help of the standard Bollinger Bands, this scan detects setups where the price action is unusually tight in comparison to how the stock normally trades. Traders assume that the stock will eventually breakout in one direction or the other.
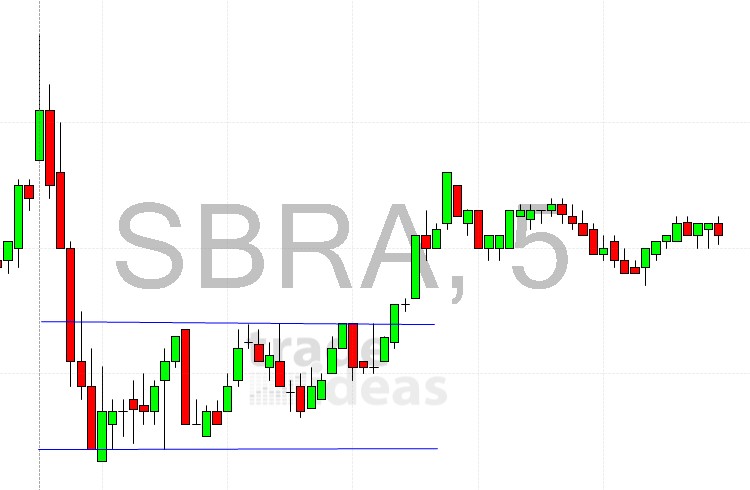
Breakdown Stabilization
This is a play from out very own CEO! The Breakdown Stabilization scan is looking for stocks that are selling off in the first 30 minutes after the open, but then start basing at the low of this range. This range often becomes well tradeable with clearly defined support levels to play off of.
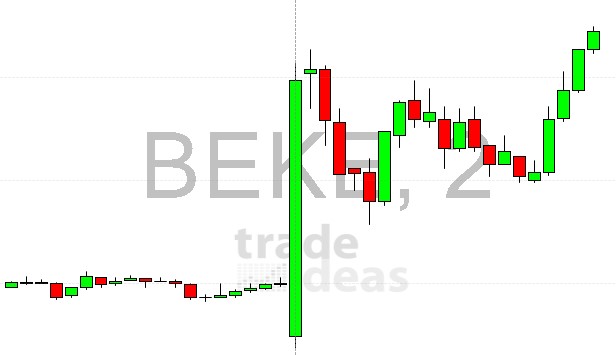
2 Minute Opening Power Bar
We define a Bullish Opening Power Bar as a wide range bar that opens near the low of its range and closes near the high of its range. A Bearish Opening Power Bar, conversly, is defined as a wide range bar that opens near the high of its range and closes near the low of its range. Traders use these Opening Power Bars as confirmation that major buying or selling is coming into a stock on the open.
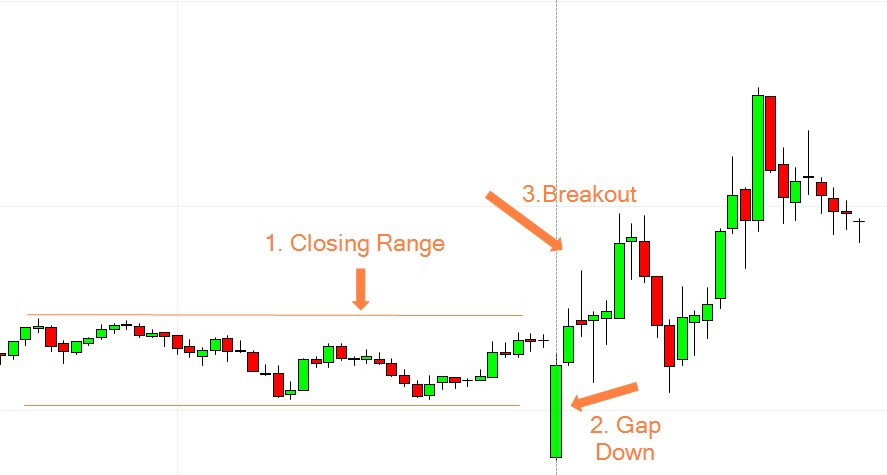
Closing Range Breakout
The ME Closing Range Breakout scan is another 3-step setup.
Step 1: Relatively narrow closing range (in the last 30 min of the trading day).
Step 2: Small gap down below the closing range
Step 3: Breakout above the closing range.
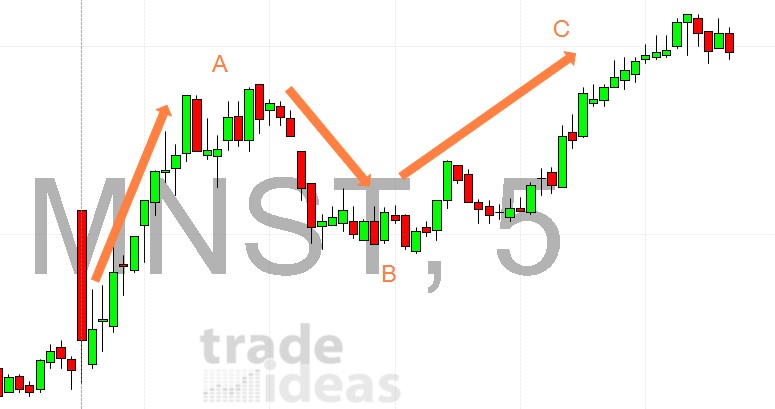
ABC Up & ABC Down
The ABC Up scan is looking for a 3 step intraday pattern:
Step 1: An initial push up
Step 2: A downward move that fails to make a new low of the day.
Step 3: The stock retracing back to highs.
The ABC Down scan is looking for a 3 step intraday pattern:
Step 1: An initial push down
Step 2: An upward move that fails to make a new high of the day.
Step 3: The stock retracing back to lows.
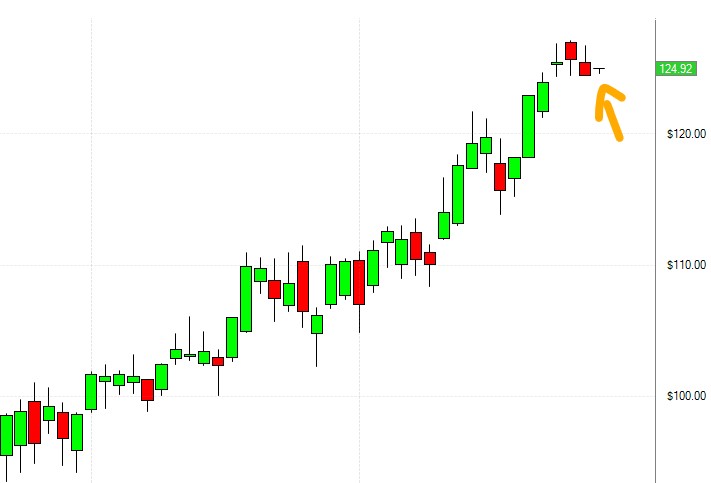
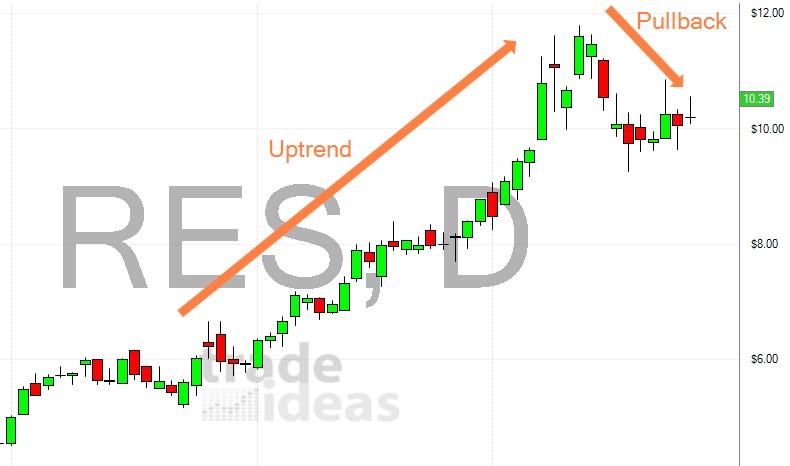
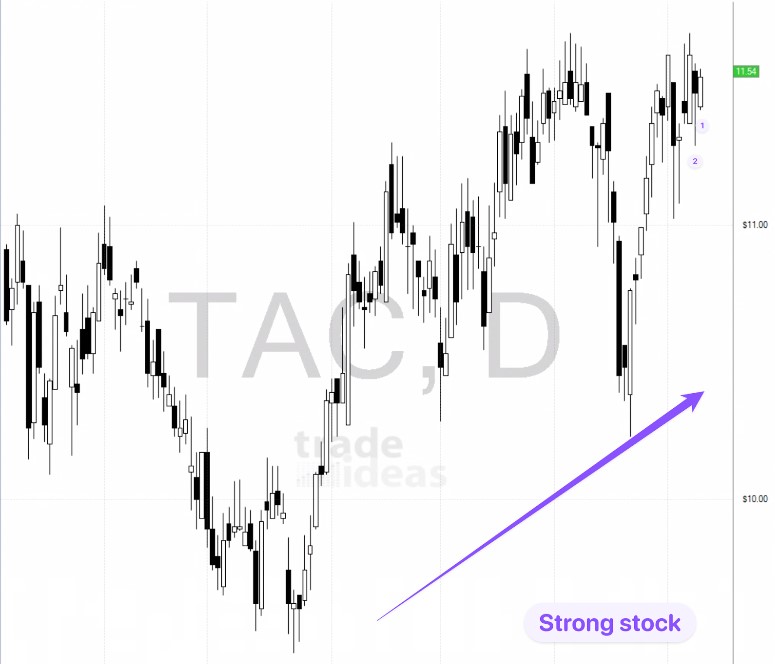
Strong Stock Pulling Back
This ME scan is looking for stocks that have been in uptrends on the daily chart, but are now pulling back sharply. This scan is very useful for trend-following pullback traders.
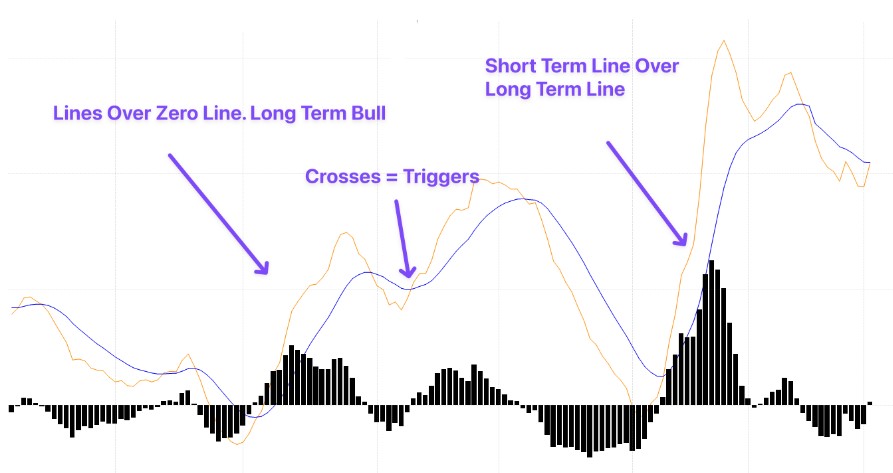
MACD Trend Play
The MACD is a trend-following indicator. This ME scan is looking for the MACD to generate a buy signal by crossing up, while already indicating an uptrend by being above the zero line.
MA Cross Buy/Sell Signal
These ME scans are looking for a simple EMA/SMA Cross of the 13 Exponential Moving Average and the 50 Simple Moving Average. Moving Average Crossovers might indicate a potential short-term trend change. Traders use these crosses as trade signals. This scan is available for different time frames.
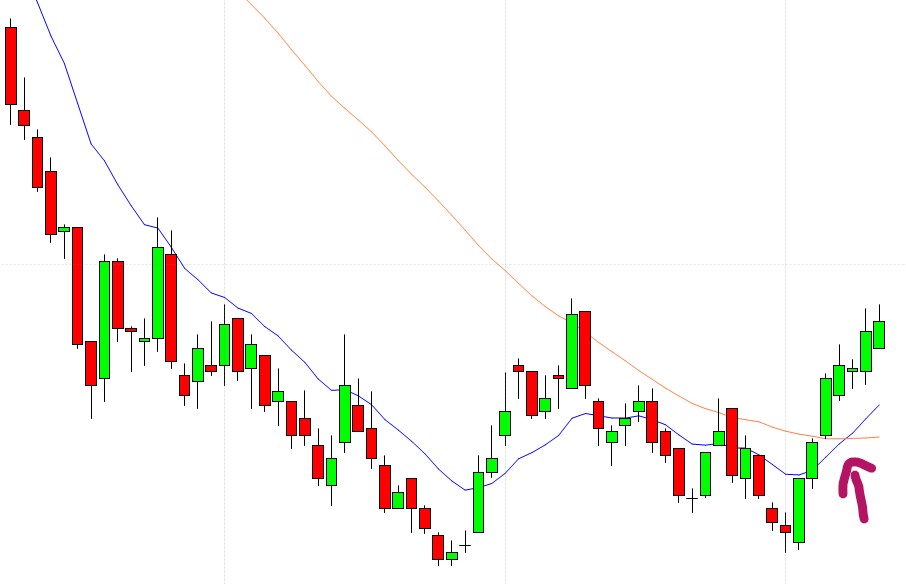
8/21 EMA Trend Pullback
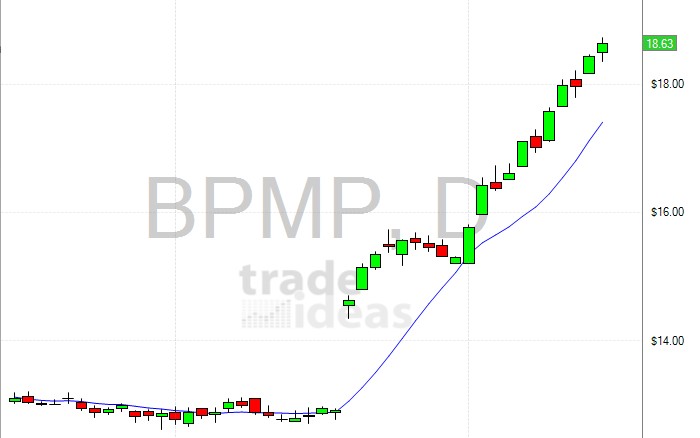
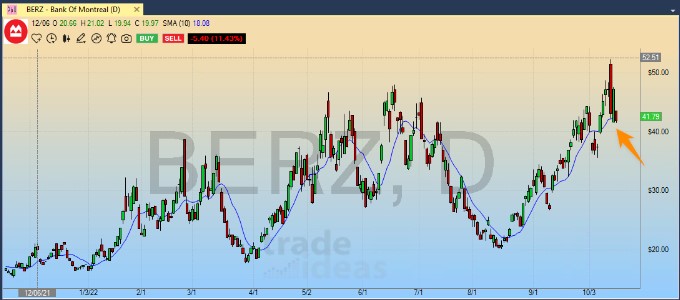
10 SMA Play
This scan uses the 10 SMA as a pullback point. We are looking for stocks to trade above the 10 SMA, and then to pullback to it. The idea is that these stocks find support at the 10 SMA as a way into a longer term trend.
Golden Cross
The Golden Cross setup is a very old trading system that is still followed today. The 50 Moving Average crossing over the 200 Moving Average is seen as a signal for a long-term bullish uptrend in this strategy. Golden Cross Traders expect a continuation of the trend.
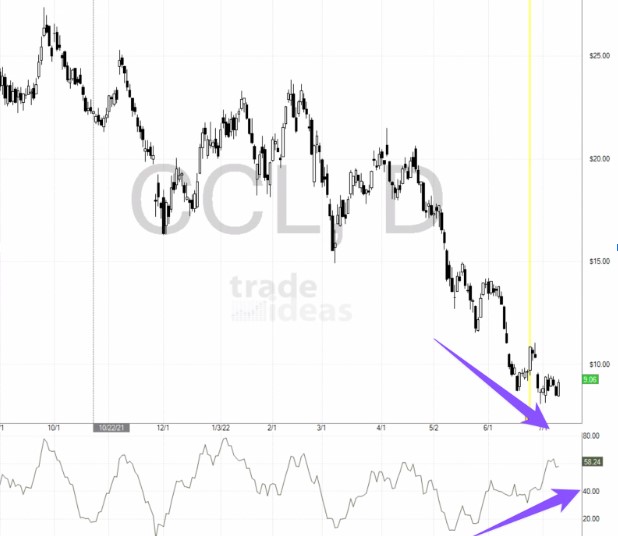
MFI Divergence Long/Short
The MFI Divergence Scan monitors daily charts for divergences between the stock's price and the Money Flow Index. A divergence occurs when the MFI indicator and the price are moving in opposite directions. The stock makes a new high or low in terms of price, but the MFI value does not correspondingly increasing/decreasing. The idea being that the most recent move took less “power” than the previous one, this divergence could be a signal for an upcoming reversal. Buyers/sellers might be running out of steam.
Recent IPOs
We define a recent IPO as a stock that has been trading for less than 400 days. This includes stocks coming back onto exchanges due to restructuring or prior SPACS.
This scan lists these IPOs as long as they trade an Average Volume of 250k. The IPOs are ranked on Distance from Lifetime High descending. You can easily change the sorting by double-clicking the header columns you wish to sort by.
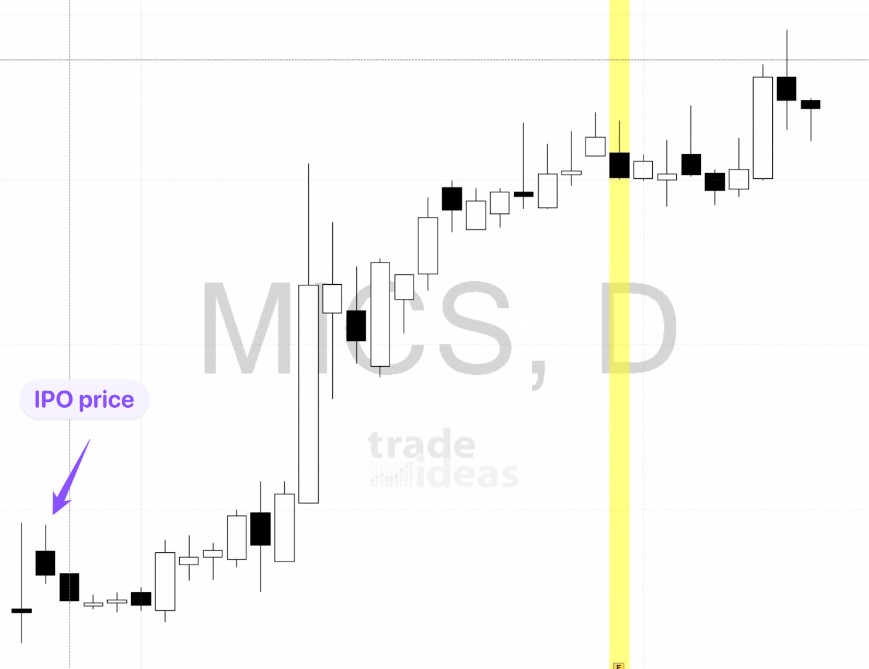
Close to IPO Price
#TheStrat
#TheStrat is a Price Action Trading Strategy developed by Rob Smith that categorizes candlesticks into three types.
In summary:
The colour of the body of the candle does not matter.
Each candle is defined by its relationship to the previous candle.
A “1” is an inside bar where neither the high nor low of today’s bar has broken yesterday’s bar. An inside candle shows the market is at a point of indecision.
A “2” is a bar that has broken either the high OR low of the prior bar, but not both. Also know as a directional bar.
A “3” is a bar that has broken both the high AND low of the bar before it. Also known as an outside bar. An outside candle shows broadening price action.
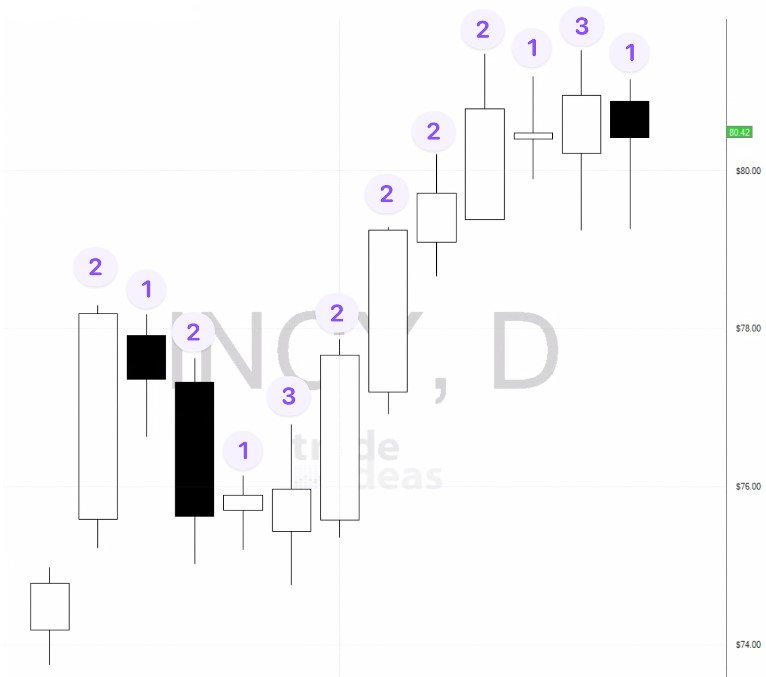
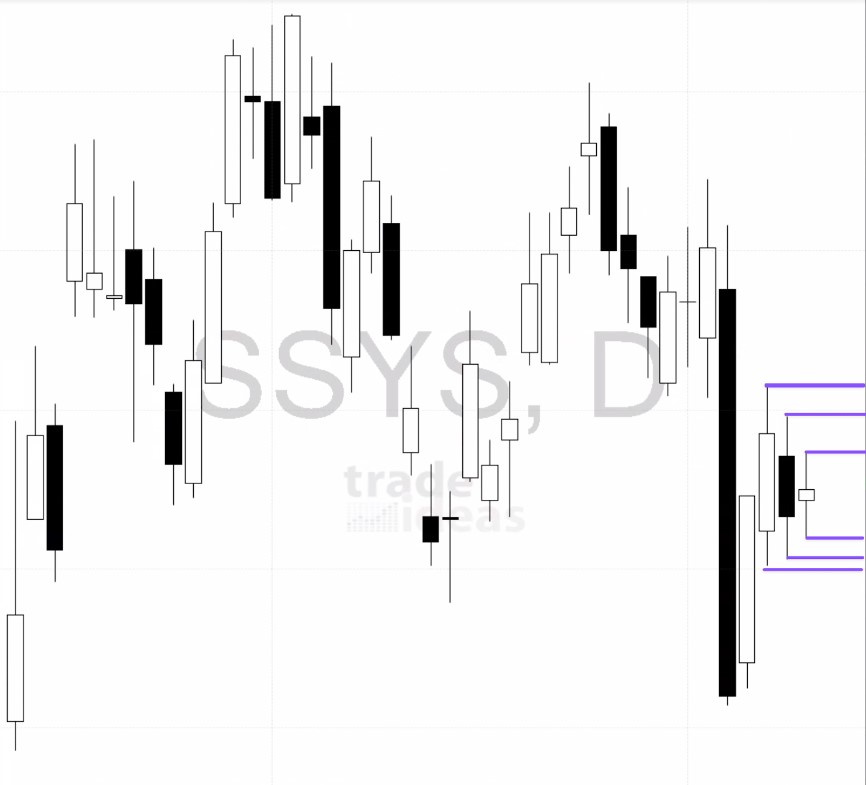
The individual #TheStrat ME scans are named according to the setup they are detecting.
The ME scan 2D-1 on Strong Stock indicates, that the prior bar is a down bar, the current bar is an inside bar and the stock is overall strong.
Double Inside Day
A daily inside bar occurs when the second days range is completely inside the first day's price range. The high of the second day is lower than the first, and the low of the second is higher than the first. Instead of one inside bar, this ME scan is looking for two consecutive inside 2 bars. The idea being that the more consecutive inside days you have the tighter price is getting, the more poised it becomes for a breakout. During the formation of this pattern, there is no clear winner in the buyer/seller battle.
Inside days show a contraction in volatility and are often a continuation pattern.
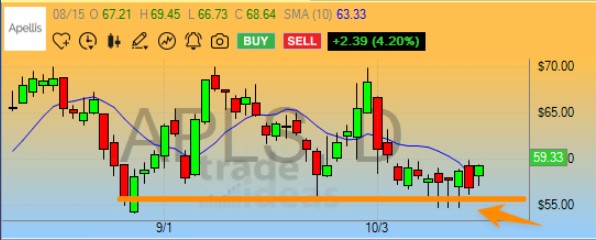
Support/Resistance.
In these scans we are using some pattern recognition algorithms to find classic support and resistance levels. We define these as areas where buyers/sellers took control to push the price up/down. This is the simplest form of trading since you are playing off areas with known buyers and sellers.

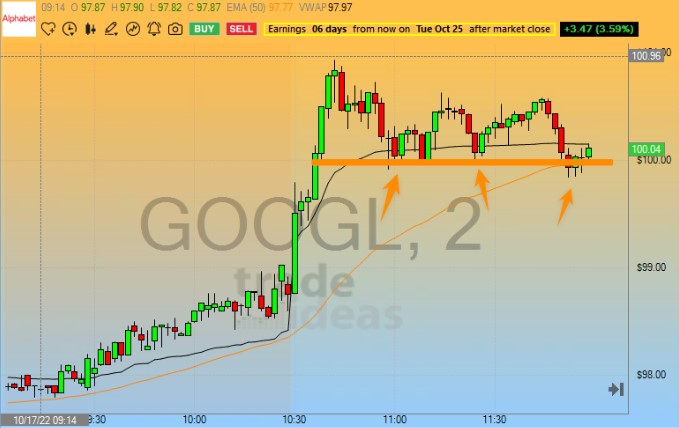
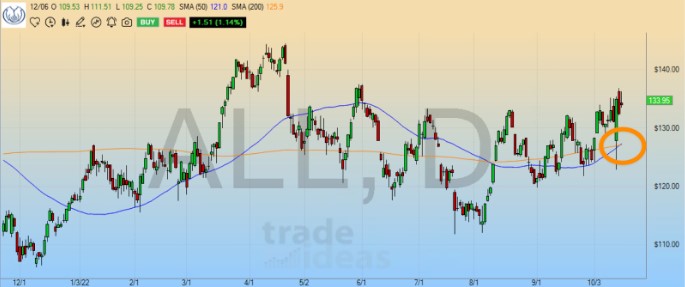
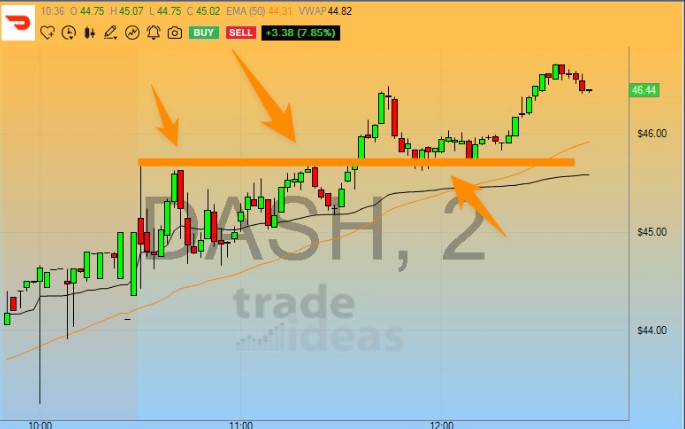
Retest of the Breakout / Throwback to the Breakdown
These ME scans are looking to find stocks that have broken out of a prior resistance area and are now finding support in that area. Traders commonly use this setup to buy into an uptrend at an important price level.
Failure to break Support/Resistance
This is a great Support/Resistance setup in which we wait for a stock to get to a support level and to breakdown, but then to quickly rally back up. A move like this can trap shorts/longs who then would fuel the move.