







Alert Index
Stock Alerts List: Every Real-Time Streaming Alert (Scanner)
Every stock on your screen. See the one that moves.
Free account, just an email. No card. Live access for a limited time.
Moves can start quickly. Real-time stock alerts show you when they begin. Find stocks the moment they qualify. Trade Ideas Streaming Alerts are the stock scanner: the servers watch every trade and send a stock the instant it matches an alert you turned on. Trade Ideas has 310 Streaming Alerts. This index links the 310 with their own pages, grouped by what they find.
How to read this list
Each card is one pattern, colored green for bullish and red for bearish. Each chip is a timeframe or code that opens that alert's own page with what it finds, its settings and the filters to pair with it. Labels show the variant: Fast fires first, Standard is the default, and Confirmed waits for extra confirmation. To run any of them live, see Trade Ideas pricing.
No alerts match that search.
Highs & Lows


Stocks breaking out.
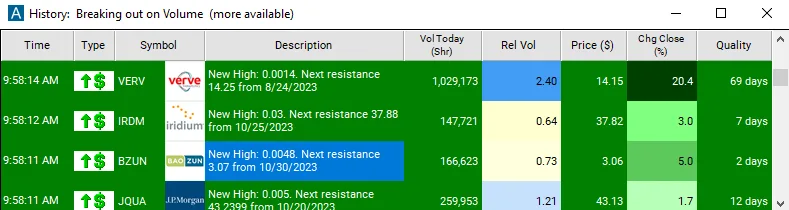
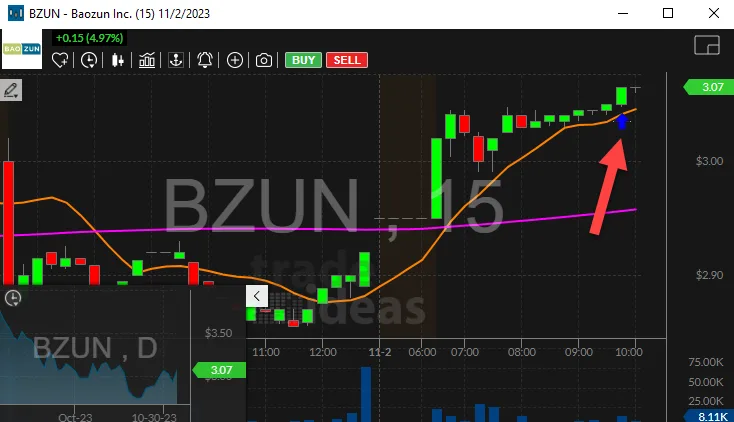
Find stocks making new highs or lows in real time, from 5-minute highs to new 52-week highs, including pre-market and post-market.
Matching filters: Highs & Lows filters
-
BullishNew HighFind stocks making new highs today or new 52-week highs as they print.
-
Bearish New Low
Find stocks making new lows today or new 52-week lows as they print.
More
Find stocks making new lows today, including new 52-week lows, in real time, with Trade Ideas Streaming Alerts. A new low is a print below every other price a stock has traded in the period you choose: today, below yesterday's low, this week, or the past 52 weeks.
-
BullishNew High (filtered)Find stocks making new highs without alert spam.
More
Find stocks making new highs, with rapid repeat alerts thinned out, in real time, with Trade Ideas Streaming Alerts. This is the filtered version of New High: when price makes several new highs in quick succession, you see one alert instead of many.
-
BearishNew Low (filtered)Find stocks making new lows without alert spam.
More
Find stocks making new lows, with rapid repeat alerts thinned out, in real time, with Trade Ideas Streaming Alerts. This is the filtered version of New Low: when price makes several new lows in quick succession, you see one alert instead of many.
-
BullishPre-market HighsFind stocks making new premarket highs before the open, as they print.
More
Find stocks making new premarket highs before the open in real time with Trade Ideas Streaming Alerts. A premarket high is the highest price a stock trades before the regular session opens. These prints are not part of the normal day high.
-
BearishPre-market LowsFind stocks making new premarket lows before the open, as they print.
More
Find stocks making new premarket lows before the open in real time with Trade Ideas Streaming Alerts. A premarket low is the lowest price a stock trades before the regular session opens. These prints are not part of the normal day low.
-
BullishPost-market HighsFind stocks making new after-hours highs, as they print.
More
Find stocks making new highs in after-hours trading in real time with Trade Ideas Streaming Alerts. A post-market high is the highest price a stock trades after the close. These prints are not part of the normal day high.
-
BearishPost-market LowsFind stocks making new after-hours lows, as they print.
More
Find stocks making new lows in after-hours trading in real time with Trade Ideas Streaming Alerts. A post-market low is the lowest price a stock trades after the close. These prints are not part of the normal day low.
-
Bullish5 Minute HighFind stocks making 5-minute highs as they print.
More
Find stocks breaking the prior 5-minute candle's high in real time with Trade Ideas Streaming Alerts. A 5 minute high is the first time the current 5 minute candle trades above the high of the previous candle. It is straight candlestick analysis of price and time.
-
Bearish5 Minute LowFind stocks making 5-minute lows as they print.
More
Find stocks breaking the prior 5-minute candle's low in real time with Trade Ideas Streaming Alerts. A 5 minute low is the first time the current 5 minute candle trades below the low of the previous candle. It is straight candlestick analysis of price and time.
-
BullishCrossed Daily Highs ResistanceFind stocks breaking above prior daily highs (5-day, 10-day, multi-day highs) as it happens.
More
Find stocks breaking above a prior day's high: 5-day, 6-day, 7-day highs and beyond, in real time, with Trade Ideas Streaming Alerts. Crossed daily highs resistance flags a stock the first time it trades above a previous day's high, for example moving from 5-day highs to 6-day highs, looking back up to a year.
-
BearishCrossed Daily Lows SupportFind stocks breaking below prior daily lows (5-day, 10-day, multi-day lows) as it happens.
More
Find stocks breaking below a prior day's low: 5-day, 6-day, 7-day lows and beyond, in real time, with Trade Ideas Streaming Alerts. Crossed daily lows support flags a stock the first time it trades below a previous day's low, for example moving from 5-day lows to 6-day lows, looking back up to a year.
Price Levels & Crossings

Stocks at key levels.
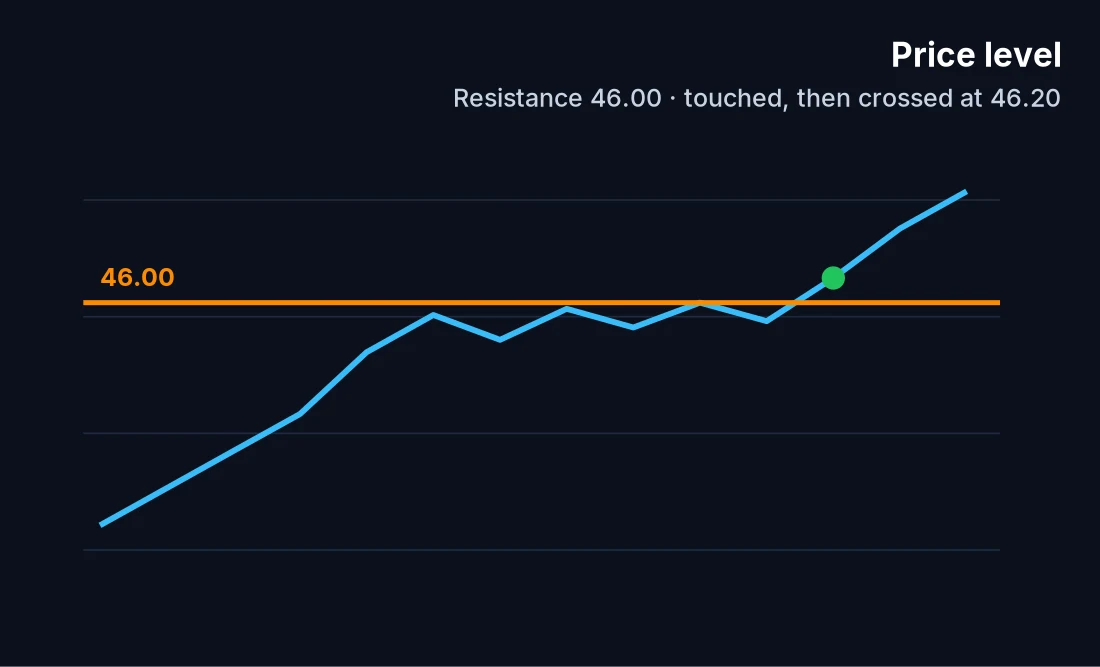
Find stocks crossing the open, the prior close, VWAP, support, resistance or a channel line the moment it happens.
Matching filters: VWAP & Pivots filters · Price & Change Today filters
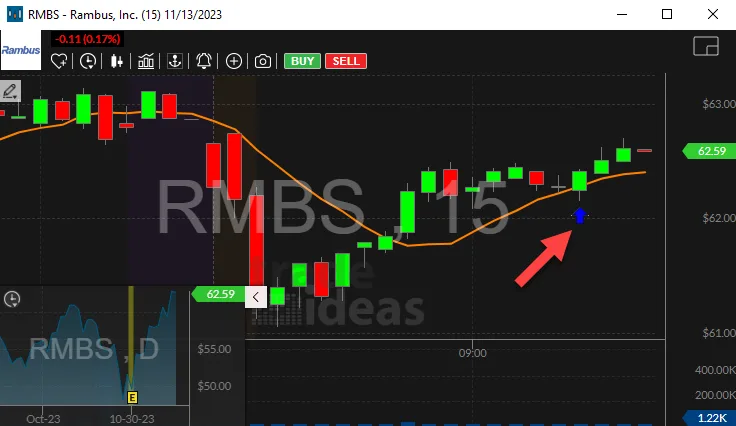
-
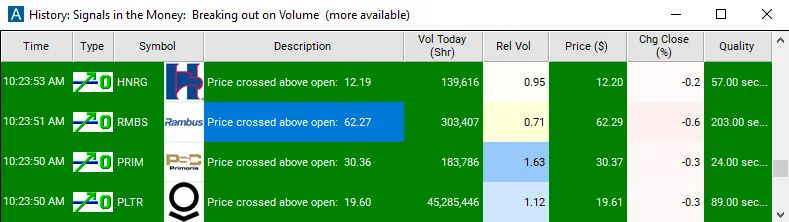
BullishCrossed Above OpenFind red to green stocks as they cross above today's open.
More
Find stocks going red to green by crossing above today's open in real time with Trade Ideas Streaming Alerts. Crossing above the open means a stock flips from down to up for the day, measured from today's open. Day traders often use the open to decide if a stock is up or down.
-
Bearish Crossed Below Open
Find green to red stocks as they cross below today's open.
More
Find stocks going green to red by crossing below today's open in real time with Trade Ideas Streaming Alerts. Crossing below the open means a stock flips from up to down for the day, measured from today's open. Day traders often use the open to decide if a stock is up or down.
-
BullishCrossed Above Open (confirmed)Find red to green stocks as they cross above today's open.
More
Find stocks going red to green by crossing above today's open, with statistical confirmation, in real time, with Trade Ideas Streaming Alerts. Crossing above the open means a stock flips from down to up for the day, measured from today's open. The confirmed version waits for price, time and volume to agree, which filters out noise.
-
BearishCrossed Below Open (confirmed)Find green to red stocks as they cross below today's open.
More
Find stocks going green to red by crossing below today's open, with statistical confirmation, in real time, with Trade Ideas Streaming Alerts. Crossing below the open means a stock flips from up to down for the day, measured from today's open. The confirmed version waits for price, time and volume to agree, which filters out noise.
-
BullishCrossed Above CloseFind red to green stocks as they cross above yesterday's close.
More
Find stocks going red to green by crossing above yesterday's close in real time with Trade Ideas Streaming Alerts. Crossing above the close means a stock flips from down to up for the day, measured from yesterday's close. Most institutional traders use the close to decide if a stock is up or down.
-
BearishCrossed Below CloseFind green to red stocks as they cross below yesterday's close.
More
Find stocks going green to red by crossing below yesterday's close in real time with Trade Ideas Streaming Alerts. Crossing below the close means a stock flips from up to down for the day, measured from yesterday's close. Most institutional traders use the close to decide if a stock is up or down.
-
BullishCrossed Above Close (confirmed)Find red to green stocks as they cross above yesterday's close.
More
Find stocks going red to green by crossing above yesterday's close, with statistical confirmation, in real time, with Trade Ideas Streaming Alerts. Crossing above the close means a stock flips from down to up for the day, measured from yesterday's close.
-
BearishCrossed Below Close (confirmed)Find green to red stocks as they cross below yesterday's close.
More
Find stocks going green to red by crossing below yesterday's close, with statistical confirmation, in real time, with Trade Ideas Streaming Alerts. Crossing below the close means a stock flips from up to down for the day, measured from yesterday's close.
-
BullishCrossed Above ResistanceFind stocks breaking above resistance as it happens.
More
Find stocks breaking above resistance in real time with Trade Ideas Streaming Alerts. A resistance line is drawn where a stock trades a lot but never goes above that price. This alert flags the break above it, with less confirmation than the volume-confirmed version, so it reports sooner.
-
BearishCrossed Below SupportFind stocks breaking below support as it happens.
More
Find stocks breaking below support in real time with Trade Ideas Streaming Alerts. A support line is drawn where a stock trades a lot but never goes below that price. This alert flags the break below it, with less confirmation than the volume-confirmed version, so it reports sooner.
-
BullishCrossed Above Resistance (confirmed)Find stocks breaking above resistance as it happens.
More
Find stocks breaking above resistance in real time with Trade Ideas Streaming Alerts. A resistance line is drawn where a stock trades a lot but never goes above that price. This alert flags the break above it and requires sufficient volume.
-
BearishCrossed Below Support (confirmed)Find stocks breaking below support as it happens.
More
Find stocks breaking below support in real time with Trade Ideas Streaming Alerts. A support line is drawn where a stock trades a lot but never goes below that price. This alert flags the break below it and requires sufficient volume.
-
BullishCrossed Above VWAPFind stocks crossing above VWAP as it happens, with statistical confirmation to filter noise.
More
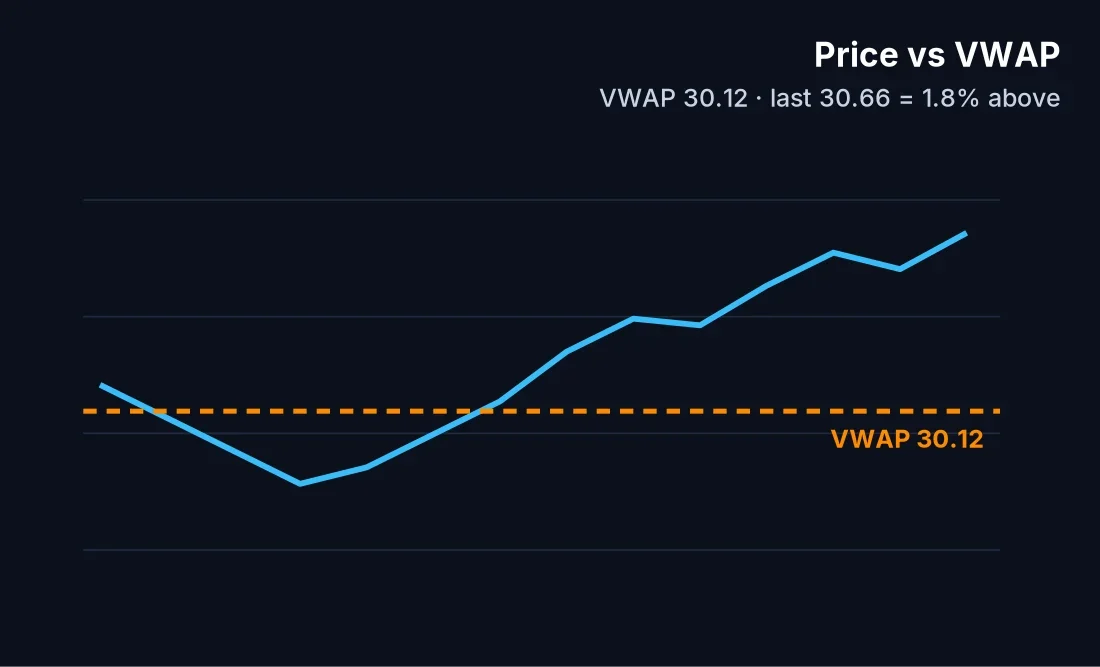
Find stocks crossing above VWAP in real time with Trade Ideas Streaming Alerts. Crossing above VWAP means price moves above the day's volume-weighted average price, a level institutions use to grade fills. This alert uses statistical confirmation of price.
-
BearishCrossed Below VWAPFind stocks crossing below VWAP as it happens, with statistical confirmation to filter noise.
More
Find stocks crossing below VWAP in real time with Trade Ideas Streaming Alerts. Crossing below VWAP means price moves below the day's volume-weighted average price, a level institutions use to grade fills. This alert uses statistical confirmation of price.
-
BullishPositive VWAP DivergenceFind stocks stretching 1%, 2%, 3%+ above VWAP, step by step.
More
Find stocks stretching each full percent above VWAP in real time with Trade Ideas Streaming Alerts. A positive VWAP divergence alert fires each time price moves another whole percentage point above the day's VWAP, and when price crosses VWAP.
-
BearishNegative VWAP DivergenceFind stocks stretching 1%, 2%, 3%+ below VWAP, step by step.
More
Find stocks stretching each full percent below VWAP in real time with Trade Ideas Streaming Alerts. A negative VWAP divergence alert fires each time price moves another whole percentage point below the day's VWAP, and when price crosses VWAP.
-
BullishChannel BreakoutFind stocks breaking out of a consolidation channel as it happens.
More
Find stocks breaking out of a consolidation channel in real time with Trade Ideas Streaming Alerts. A channel breakout is when a consolidation ends abruptly with a move up. This fast version works on about a 1 minute scale and can give some false signals.
-
BearishChannel BreakdownFind stocks breaking down from a consolidation channel as it happens.
More
Find stocks breaking down from a consolidation channel in real time with Trade Ideas Streaming Alerts. A channel breakdown is when a consolidation ends abruptly with a move down. This fast version works on about a 1 minute scale and can give some false signals.
-
BullishChannel Breakout (confirmed)Find stocks breaking out of a consolidation channel as it happens.
More
Find stocks breaking out of a consolidation channel in real time with Trade Ideas Streaming Alerts. A confirmed channel breakout is when a stock moves directly from consolidating to running up, with volume and price action confirming it, on about a 15 minute scale.
-
BearishChannel Breakdown (confirmed)Find stocks breaking down from a consolidation channel as it happens.
More
Find stocks breaking down from a consolidation channel in real time with Trade Ideas Streaming Alerts. A confirmed channel breakdown is when a stock moves directly from consolidating to running down, with volume and price action confirming it, on about a 15 minute scale.
-
BullishStandard Deviation BreakoutFind stocks breaking out 1+ standard deviations above the prior close, as it happens.
More
Find stocks moving up one standard deviation or more from yesterday's close in real time with Trade Ideas Streaming Alerts. A standard deviation breakout is a move up of at least one standard deviation from the prior close, so the bar adjusts to how volatile each stock is.
-
BearishStandard Deviation BreakdownFind stocks breaking down 1+ standard deviations below the prior close, as it happens.
More
Find stocks moving down one standard deviation or more from yesterday's close in real time with Trade Ideas Streaming Alerts. A standard deviation breakdown is a drop of at least one standard deviation from the prior close, so the bar adjusts to how volatile each stock is.
Momentum & Trend


Stocks making a run, up and down.
Find stocks running up or down right now, trending on a linear regression, thrusting through a moving average, or moving a set percent for the day.
Matching filters: Change Over Time filters · Price & Change Today filters
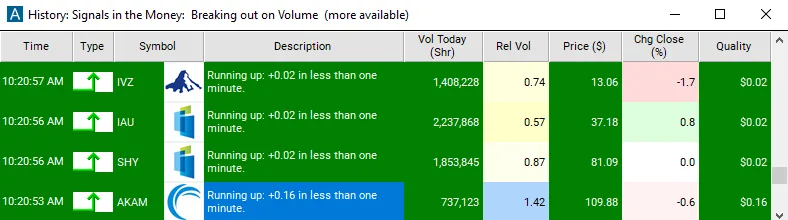
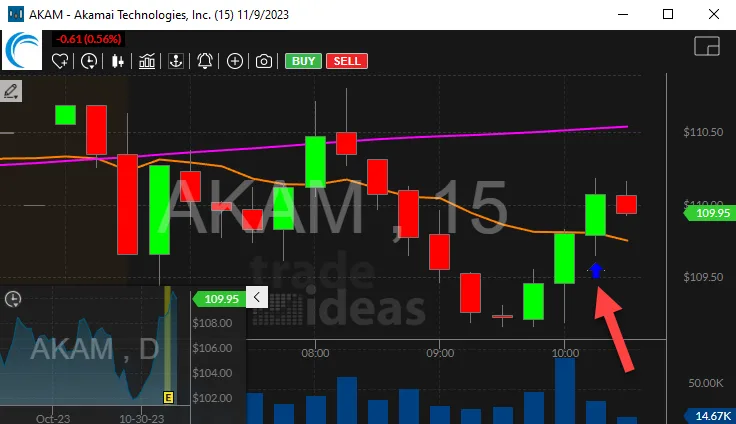
-
BullishRunning Up NowFind stocks running up fast, as the move happens.
More
Find stocks running up fast right now with Trade Ideas Streaming Alerts. Running up means a stock is trading up much faster than expected for its volatility. This version works on the shortest time frame, about what you would see on a 1 minute chart, with no confirmation, so a single print can set it off.
-
Bearish Running Down Now
Find stocks running down fast, as the move happens.
More
Find stocks running down fast right now with Trade Ideas Streaming Alerts. Running down means a stock is trading down much faster than expected for its volatility. This version works on the shortest time frame, about what you would see on a 1 minute chart, with no confirmation, so a single print can set it off.
-
BullishRunning UpFind stocks running up fast, as the move happens.
More
Find stocks running up fast in real time with Trade Ideas Streaming Alerts. Running up means a stock is trading up much faster than expected for its volatility. This version works on a time scale of about one minute and only fires on a clear, statistically validated move, with bad prints filtered out.
-
BearishRunning DownFind stocks running down fast, as the move happens.
More
Find stocks running down fast in real time with Trade Ideas Streaming Alerts. Running down means a stock is trading down much faster than expected for its volatility. This version works on a time scale of about one minute and only fires on a clear, statistically validated move, with bad prints filtered out.
-
BullishRunning Up (intermediate)Find stocks running up fast, as the move happens.
More
Find stocks running up fast in real time with Trade Ideas Streaming Alerts. Running up means a stock is trading up much faster than expected for its volatility. This version is the middle ground: price must move at least twice as far as expected for the period, roughly like watching 25 minutes of 30 second candles.
-
BearishRunning Down (intermediate)Find stocks running down fast, as the move happens.
More
Find stocks running down fast in real time with Trade Ideas Streaming Alerts. Running down means a stock is trading down much faster than expected for its volatility. This version is the middle ground: price must move at least twice as far as expected for the period, roughly like watching 25 minutes of 30 second candles.
-
BullishRunning Up (confirmed)Find stocks running up fast, as the move happens.
More
Find stocks running up fast, with volume confirmation, in real time, with Trade Ideas Streaming Alerts. Running up means a stock is trading up much faster than expected for its volatility. This version works on a minimum time frame of about 15 minutes with stricter criteria and more volume required, so fewer alerts appear.
-
BearishRunning Down (confirmed)Find stocks running down fast, as the move happens.
More
Find stocks running down fast, with volume confirmation, in real time, with Trade Ideas Streaming Alerts. Running down means a stock is trading down much faster than expected for its volatility. This version works on a minimum time frame of about 15 minutes with stricter criteria and more volume required, so fewer alerts appear.
-
Bullish% Up For The DayFind stocks up 3%, 5%, 10% or more today, alerted as each level is reached.
More
Find stocks up a set percentage since yesterday's close in real time with Trade Ideas Streaming Alerts. % up for the day is how far a stock has risen since the previous close, based on official prints. You choose the percentage; the server starts at 3%.
-
Bearish% Down For The DayFind stocks down 3%, 5%, 10% or more today, alerted as each level is reached.
More
Find stocks down a set percentage since yesterday's close in real time with Trade Ideas Streaming Alerts. % down for the day is how far a stock has fallen since the previous close, based on official prints. You choose the percentage; the server starts at 3%.
-
Bullish5 Minute Linear Regression Up TrendFind stocks turning into a 5-minute linear regression uptrend as it happens.
More
Find stocks turning into a 5-minute linear regression uptrend in real time with Trade Ideas Streaming Alerts. Linear regression fits a statistical trend line to price over time. This alert fires when short-term regression momentum moves a stock across its longer-term regression channel upward on the 5 minute chart.
-
Bearish5 Minute Linear Regression Down TrendFind stocks turning into a 5-minute linear regression downtrend as it happens.
More
Find stocks turning into a 5-minute linear regression downtrend in real time with Trade Ideas Streaming Alerts. Linear regression fits a statistical trend line to price over time. This alert fires when short-term regression momentum moves a stock across its longer-term regression channel downward on the 5 minute chart.
-
BullishUpward ThrustFind stocks in a 2-minute upward thrust: 8 and 20 period SMAs both rising for 5 straight bars.
More
Find stocks whose 8 and 20 period SMAs are both rising on the 2-minute chart in real time with Trade Ideas Streaming Alerts. An upward thrust is when a stock's 8 period SMA and 20 period SMA have both been going up for each of the last 5 periods.
-
BearishDownward ThrustFind stocks in a 2-minute downward thrust: 8 and 20 period SMAs both falling for 5 straight bars.
More
Find stocks whose 8 and 20 period SMAs are both falling on the 2-minute chart in real time with Trade Ideas Streaming Alerts. An downward thrust is when a stock's 8 period SMA and 20 period SMA have both been going down for each of the last 5 periods.
-
BullishTrailing Stop, % UpGet trailing-stop style alerts when stocks move up off a local low.
More
Find stocks moving up off their last low by a trailing-stop amount in real time with Trade Ideas Streaming Alerts. This alert uses trailing-stop logic: it reports when a stock moves up at least 0.5% from its last low, then again every further 0.25%.
-
BearishTrailing Stop, % DownGet trailing-stop style alerts when stocks move down off a local high.
More
Find stocks moving down off their last high by a trailing-stop amount in real time with Trade Ideas Streaming Alerts. This alert uses trailing-stop logic: it reports when a stock moves down at least 0.5% from its last high, then again every further 0.25%.
-
BullishTrailing Stop, Volatility UpGet trailing-stop style alerts when stocks move up off a local low.
More
Find stocks moving up off their last low by a trailing-stop amount in real time with Trade Ideas Streaming Alerts. This alert uses trailing-stop logic scaled to volatility: it reports when a stock moves one full 15 minute bar up off its last low, then every further half bar.
-
BearishTrailing Stop, Volatility DownGet trailing-stop style alerts when stocks move down off a local high.
More
Find stocks moving down off their last high by a trailing-stop amount in real time with Trade Ideas Streaming Alerts. This alert uses trailing-stop logic scaled to volatility: it reports when a stock moves one full 15 minute bar down off its last high, then every further half bar.
Opening Range & Gaps


Stocks gapping up and down.
Find stocks breaking out of the opening range, reversing a gap, or printing a power bar after the open.
Matching filters: Gap filters · Price & Change Today filters
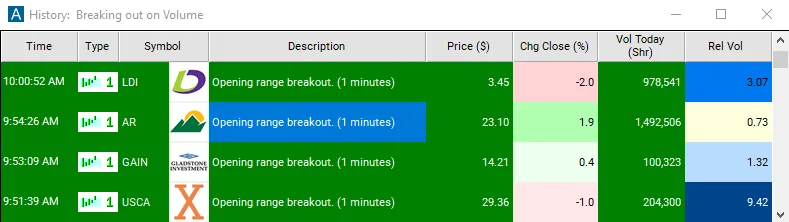
-
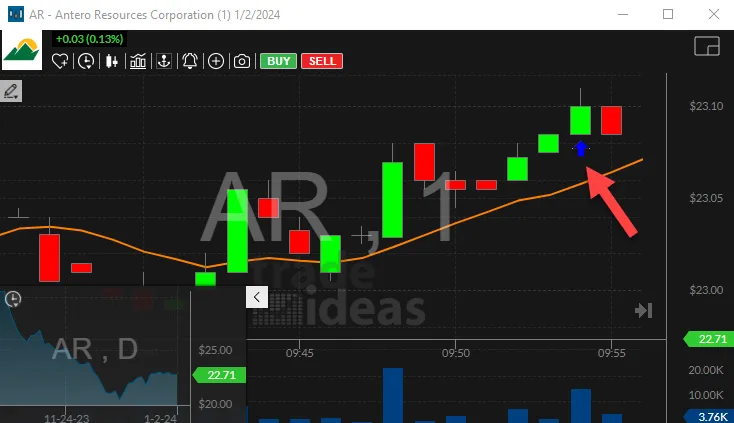
Bullish1 Minute Opening Range BreakoutFind 1-minute opening range breakouts (ORB) as they happen.
More
Find stocks breaking above their 1-minute opening range in real time with Trade Ideas Streaming Alerts. The 1-minute opening range is the high and low of the first 1 minute candle of the day. An opening range breakout is the first time price trades above that high.
-
Bearish 1 Minute Opening Range Breakdown
Find 1-minute opening range breakdowns (ORB) as they happen.
More
Find stocks breaking below their 1-minute opening range in real time with Trade Ideas Streaming Alerts. The 1-minute opening range is the high and low of the first 1 minute candle of the day. An opening range breakdown is the first time price trades below that low.
-
BullishGap Down ReversalFind gap down stocks reversing through yesterday's close, as it happens.
-
BearishGap Up ReversalFind gap up stocks reversing through yesterday's close, as it happens.
-
BullishFalse Gap Up RetracementFind gap up stocks that partly fill, then continue higher, as it happens.
-
BearishFalse Gap Down RetracementFind gap down stocks that partly fill, then continue lower, as it happens.
-
BullishBullish Opening Power BarFind bullish 5-minute opening power bar triggers as they happen.
More
Find stocks breaking above a bullish first 5-minute power bar in real time with Trade Ideas Streaming Alerts. An opening power bar is a large first 5-minute candle that opens near one extreme and closes near the other, with the market showing a matching pattern. The bullish alert fires one tick above the high of that candle.
-
BearishBearish Opening Power BarFind bearish 5-minute opening power bar triggers as they happen.
More
Find stocks breaking below a bearish first 5-minute power bar in real time with Trade Ideas Streaming Alerts. An opening power bar is a large first 5-minute candle that opens near one extreme and closes near the other, with the market showing a matching pattern. The bearish alert fires one tick below the low of that candle.
Volume & Trade Activity


Stocks trading heavy volume.
Find stocks with a volume spike, a block trade, strong or high relative volume, or an unusual number of prints.
Matching filters: Volume & Trade Activity filters
-
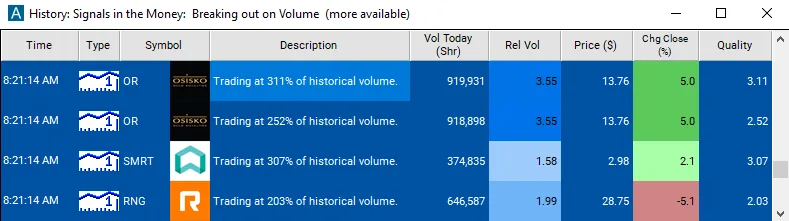
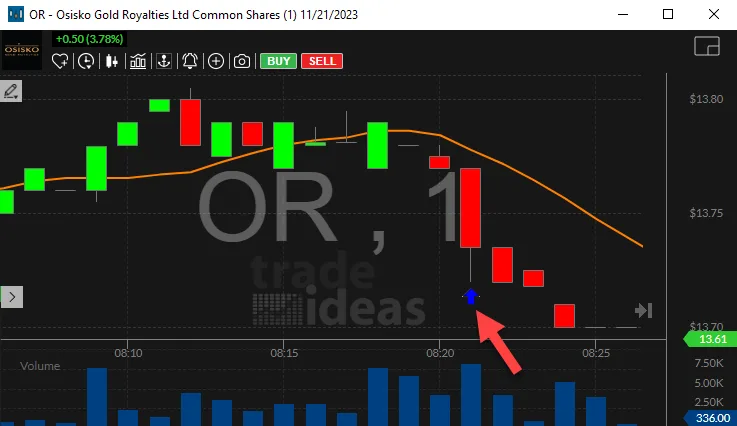
 1 Minute Volume Spike
Find stocks with sudden 1-minute volume spikes as they happen.
-
Block Trade
Find block trades as they print: single trades of 20,000+ shares, often institutional.
More
Find block trades: single prints of 20,000 shares or more, in real time, with Trade Ideas Streaming Alerts. A block trade is a single trade of at least 20,000 shares, usually a sign of institutional trading.
-
High Relative Volume
Find unusual volume stocks right now.
-
Strong Volume
Find stocks trading 1x, 2x, 3x their average daily volume today, alerted at each level.
-
Unusual Number Of Prints
Find stocks where the tape suddenly prints 5x faster than normal, as it happens.
More
Find stocks printing trades on the tape far faster than normal in real time with Trade Ideas Streaming Alerts. An unusual number of prints means a stock is printing at least 5 times faster than normal for this time of day. It counts trades, not size, over 3 minutes or less.
Bid, Ask & Order Book

Bid and ask, as it shifts.
Find stocks where the bid, ask or spread is doing something unusual: new highs on the ask, large size, crossed or locked markets, and NYSE imbalances.
Matching filters: Bid, Ask & Order Book filters
-
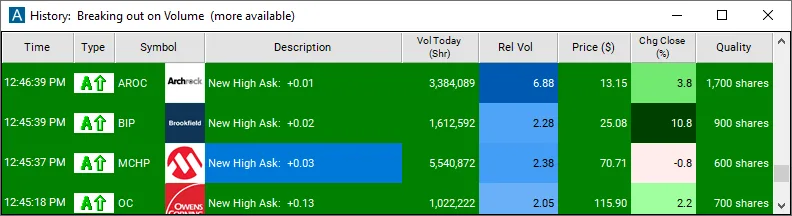
BullishNew High Ask (filtered)Find stocks whose ask is making a new high today, without alert spam.
More
Find stocks whose ask price is making a new high, with repeat alerts thinned out, in real time, with Trade Ideas Streaming Alerts. This is the filtered version of the new high ask alert: when the quote changes several times in a row, you see one alert instead of many.
-
Bearish New Low Ask (filtered)
Find stocks whose ask is making a new low today, without alert spam.
More
Find stocks whose ask price is making a new low, with repeat alerts thinned out, in real time, with Trade Ideas Streaming Alerts. This is the filtered version of the new low ask alert: when the quote changes several times in a row, you see one alert instead of many.
-
BullishNew High Bid (filtered)Find stocks whose bid is making a new high today, without alert spam.
More
Find stocks whose bid price is making a new high, with repeat alerts thinned out, in real time, with Trade Ideas Streaming Alerts. This is the filtered version of the new high bid alert: when the quote changes several times in a row, you see one alert instead of many.
-
BearishNew Low Bid (filtered)Find stocks whose bid is making a new low today, without alert spam.
More
Find stocks whose bid price is making a new low, with repeat alerts thinned out, in real time, with Trade Ideas Streaming Alerts. This is the filtered version of the new low bid alert: when the quote changes several times in a row, you see one alert instead of many.
-
BullishNew High AskFind stocks whose ask price is making a new high today, as the quote changes.
More
Find stocks whose ask price is making a new high for the day in real time with Trade Ideas Streaming Alerts. A new high ask means the best ask price just went higher than at any time today. It is a quote signal that can lead the next print.
-
BearishNew Low BidFind stocks whose bid price is making a new low today, as the quote changes.
More
Find stocks whose bid price is making a new low for the day in real time with Trade Ideas Streaming Alerts. A new low bid means the best bid price just went lower than at any time today. It is a quote signal that can lead the next print.
-
BullishLarge Bid SizeFind stocks with an unusually large bid on Level 1, as it posts.
More
Find stocks with an unusually large number of shares on the best bid in real time with Trade Ideas Streaming Alerts. A large bid size means an unusually high number of shares is sitting on the best bid, which can show a buyer defending a price.
-
BearishLarge Ask SizeFind stocks with an unusually large ask on Level 1, as it posts.
More
Find stocks with an unusually large number of shares on the best ask in real time with Trade Ideas Streaming Alerts. A large ask size means an unusually high number of shares is offered at the best ask, which can show a seller capping a price.
-
 Market Crossed
Find stocks with a crossed market (ask below bid) as it happens.
More
Find stocks with a crossed market, where the ask is below the bid, in real time, with Trade Ideas Streaming Alerts. A crossed market is when the ask price is lower than the bid price. It happens when a stock is unusually active and often signals a turning point.
-
BullishMarket Crossed UpFind stocks where the bid just crossed above the ask, as it happens.
More
Find stocks where the bid rises above the ask in real time with Trade Ideas Streaming Alerts. Market crossed up is when the bid rises above the ask, a sign that demand is outrunning supply at the current price.
-
BearishMarket Crossed DownFind stocks where the ask just crossed below the bid, as it happens.
More
Find stocks where the ask drops below the bid in real time with Trade Ideas Streaming Alerts. Market crossed down is when the ask falls below the bid, a sign that supply is outrunning demand at the current price.
-
Market Locked
Find stocks with a locked market (bid equals ask) as it happens.
More
Find stocks with a locked market, where the bid and ask are the same price, in real time, with Trade Ideas Streaming Alerts. A locked market is when the bid and the ask are exactly the same price. Like a crossed market, it usually means the stock is especially volatile.
-
Large Spread
Find NYSE stocks whose bid-ask spread suddenly widens to 50 cents or more.
More
Find NYSE stocks whose spread suddenly widens to 50 cents or more in real time with Trade Ideas Streaming Alerts. The Large Spread alert flags an NYSE stock when the specialist's spread suddenly becomes large, defined as at least 50 cents.
-
BullishTrading AboveFind stocks where buyers are paying above the ask, a leading sign of a fast move.
More
Find stocks where buyers are paying more than the best offer in real time with Trade Ideas Streaming Alerts. Trading above means someone bought a stock for more than the best offer price, often because they expect a fast move and want the quickest fill.
-
BearishTrading BelowFind stocks where sellers are hitting below the bid, a leading sign of a fast drop.
More
Find stocks where sellers are selling for less than the best bid in real time with Trade Ideas Streaming Alerts. Trading below means someone sold a stock for less than the best bid price, often because they expect a fast drop and want the quickest fill.
-
BullishTrading Above SpecialistFind NYSE and AMEX stocks printing above the specialist's offer in regular hours.
More
Find NYSE and AMEX stocks printing above the specialist's offer in real time with Trade Ideas Streaming Alerts. Trading above specialist is a subset of Trading Above for NYSE and AMEX stocks: a print above the specialist's offer during normal market hours.
-
BearishTrading Below SpecialistFind NYSE and AMEX stocks printing below the specialist's bid in regular hours.
More
Find NYSE and AMEX stocks printing below the specialist's bid in real time with Trade Ideas Streaming Alerts. Trading below specialist is a subset of Trading Below for NYSE and AMEX stocks: a print below the specialist's bid during normal market hours.
-
BullishNYSE Buy ImbalanceFind NYSE stocks with a market-on-close buy imbalance near the end of the day.
More
Find NYSE stocks with a market-on-close buy imbalance in real time with Trade Ideas Streaming Alerts. A buy imbalance means more market-on-close orders are trying to buy a stock than sell it, which often pushes price higher into the close.
-
BearishNYSE Sell ImbalanceFind NYSE stocks with a market-on-close sell imbalance near the end of the day.
More
Find NYSE stocks with a market-on-close sell imbalance in real time with Trade Ideas Streaming Alerts. A sell imbalance means more market-on-close orders are trying to sell a stock than buy it, which often pushes price lower into the close.
Moving Averages & Indicators
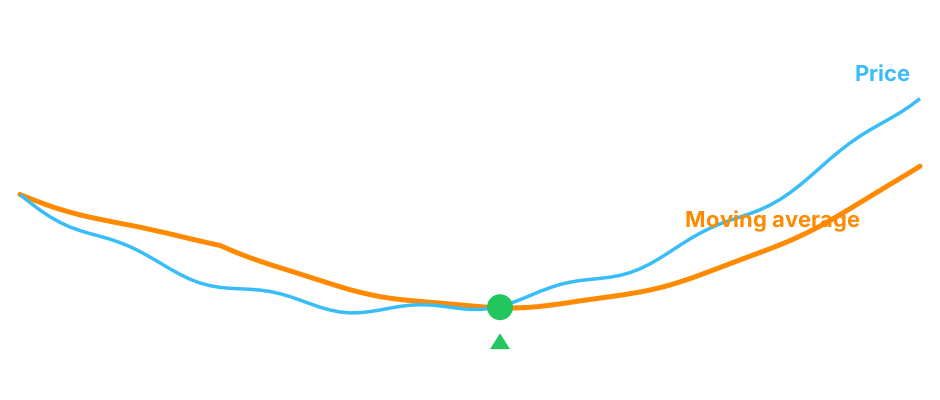

Stocks crossing their moving averages.
Find stocks crossing moving averages, MACD signal and zero lines, and stochastic levels on intraday and daily charts.
Matching filters: Moving Averages filters · Indicators & Ratings filters (RSI, Bollinger Bands)
-
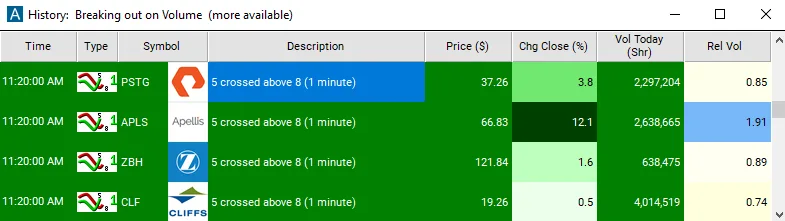
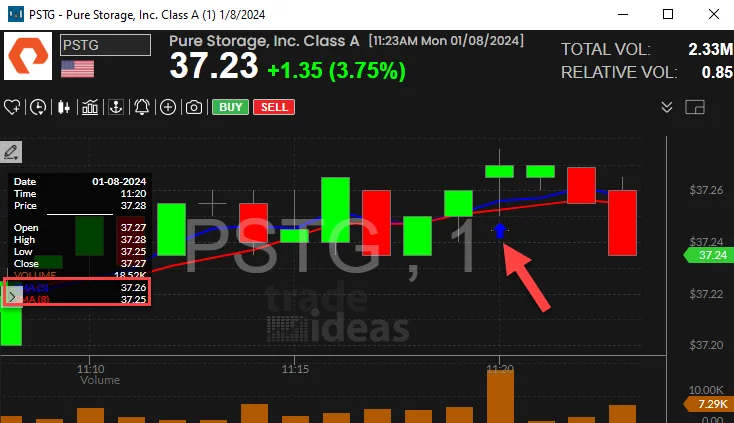
Bullish5 Period SMA Crossed Above 8 Period SMAFind bullish 5/8 SMA crossovers on the 1-minute chart as they happen.
More
Find stocks where the 5 period SMA crosses above the 8 period SMA on the 1-minute chart in real time with Trade Ideas Streaming Alerts. A 5/8 SMA crossover is when the 5 period simple moving average crosses above the 8 period SMA. Most traders read that as a bullish short-term signal.
-
Bearish 5 Period SMA Crossed Below 8 Period SMA
Find bearish 5/8 SMA crossovers on the 1-minute chart as they happen.
More
Find stocks where the 5 period SMA crosses below the 8 period SMA on the 1-minute chart in real time with Trade Ideas Streaming Alerts. A 5/8 SMA crossover is when the 5 period simple moving average crosses below the 8 period SMA. Most traders read that as a bearish short-term signal.
-
Bullish8 Period SMA Crossed Above 20 Period SMAFind bullish 8/20 SMA crossovers on the 2-minute chart as they happen.
More
Find stocks where the 8 period SMA crosses above the 20 period SMA on the 2-minute chart in real time with Trade Ideas Streaming Alerts. A 8/20 SMA crossover is when the 8 period simple moving average crosses above the 20 period SMA. Most traders read that as a bullish short-term signal.
-
Bearish8 Period SMA Crossed Below 20 Period SMAFind bearish 8/20 SMA crossovers on the 2-minute chart as they happen.
More
Find stocks where the 8 period SMA crosses below the 20 period SMA on the 2-minute chart in real time with Trade Ideas Streaming Alerts. A 8/20 SMA crossover is when the 8 period simple moving average crosses below the 20 period SMA. Most traders read that as a bearish short-term signal.
-
Bullish20 Period SMA Crossed Above 200 Period SMAFind bullish 20/200 SMA crossovers on the 2-minute chart as they happen.
More
Find stocks where the 20 period SMA crosses above the 200 period SMA on the 2-minute chart in real time with Trade Ideas Streaming Alerts. A 20/200 SMA crossover is when the 20 period simple moving average crosses above the 200 period SMA. Most traders read that as a bullish longer-trend signal.
-
Bearish20 Period SMA Crossed Below 200 Period SMAFind bearish 20/200 SMA crossovers on the 2-minute chart as they happen.
More
Find stocks where the 20 period SMA crosses below the 200 period SMA on the 2-minute chart in real time with Trade Ideas Streaming Alerts. A 20/200 SMA crossover is when the 20 period simple moving average crosses below the 200 period SMA. Most traders read that as a bearish longer-trend signal.
-
BullishCrossed Above 20 Day Moving AverageFind stocks crossing above their 20-day moving average intraday, with volume confirmation.
More
Find stocks crossing above their 20-day moving average in real time with Trade Ideas Streaming Alerts. A 20-day moving average cross is when price moves above the stock's 20-day simple moving average. This alert requires sufficient volume.
-
BearishCrossed Below 20 Day Moving AverageFind stocks crossing below their 20-day moving average intraday, with volume confirmation.
More
Find stocks crossing below their 20-day moving average in real time with Trade Ideas Streaming Alerts. A 20-day moving average cross is when price moves below the stock's 20-day simple moving average. This alert requires sufficient volume.
-
BullishCrossed Above 50 Day Moving AverageFind stocks crossing above their 50-day moving average intraday, with volume confirmation.
-
BearishCrossed Below 50 Day Moving AverageFind stocks crossing below their 50-day moving average intraday, with volume confirmation.
-
BullishCrossed Above 200 Day Moving AverageFind stocks crossing above their 200-day moving average intraday, with volume confirmation.
More
Find stocks crossing above their 200-day moving average in real time with Trade Ideas Streaming Alerts. A 200-day moving average cross is when price moves above the stock's 200-day simple moving average, the traditional line for whether a stock is up or down long term. This alert requires sufficient volume.
-
BearishCrossed Below 200 Day Moving AverageFind stocks crossing below their 200-day moving average intraday, with volume confirmation.
More
Find stocks crossing below their 200-day moving average in real time with Trade Ideas Streaming Alerts. A 200-day moving average cross is when price moves below the stock's 200-day simple moving average, the traditional line for whether a stock is up or down long term. This alert requires sufficient volume.
-
Bullish5 Minute MACD Crossed Above SignalFind stocks with a 5-minute MACD cross above the signal line as it happens.
More
Find stocks where MACD crosses above the signal line on the 5-minute chart in real time with Trade Ideas Streaming Alerts. A MACD bullish crossover is when the MACD line (12 EMA minus 26 EMA) crosses above its 9-period signal line.
-
Bearish5 Minute MACD Crossed Below SignalFind stocks with a 5-minute MACD cross below the signal line as it happens.
More
Find stocks where MACD crosses below the signal line on the 5-minute chart in real time with Trade Ideas Streaming Alerts. A MACD bearish crossover is when the MACD line (12 EMA minus 26 EMA) crosses below its 9-period signal line.
-
Bullish5 Minute MACD Crossed Above ZeroFind stocks with a 5-minute MACD cross above zero as it happens.
More
Find stocks where MACD crosses above zero on the 5-minute chart in real time with Trade Ideas Streaming Alerts. A MACD zero-line cross is when the MACD line (12 EMA minus 26 EMA) crosses above zero, which means the 12 EMA has moved above the 26 EMA.
-
Bearish5 Minute MACD Crossed Below ZeroFind stocks with a 5-minute MACD cross below zero as it happens.
More
Find stocks where MACD crosses below zero on the 5-minute chart in real time with Trade Ideas Streaming Alerts. A MACD zero-line cross is when the MACD line (12 EMA minus 26 EMA) crosses below zero, which means the 12 EMA has moved below the 26 EMA.
-
Bullish5 Minute Stochastic Crossed Above 20Find stocks crossing above 20 (leaving oversold) on the 5-minute stochastic, as it happens.
More
Find stocks leaving stochastic oversold territory on the 5-minute chart in real time with Trade Ideas Streaming Alerts. Stochastics treat readings below 20 as oversold and above 80 as overbought. This alert fires as soon as a stock is no longer oversold, crossing back above 20.
-
Bearish5 Minute Stochastic Crossed Below 80Find stocks crossing below 80 (leaving overbought) on the 5-minute stochastic, as it happens.
More
Find stocks leaving stochastic overbought territory on the 5-minute chart in real time with Trade Ideas Streaming Alerts. Stochastics treat readings below 20 as oversold and above 80 as overbought. This alert fires as soon as a stock is no longer overbought, crossing back below 80.
Candlestick Patterns
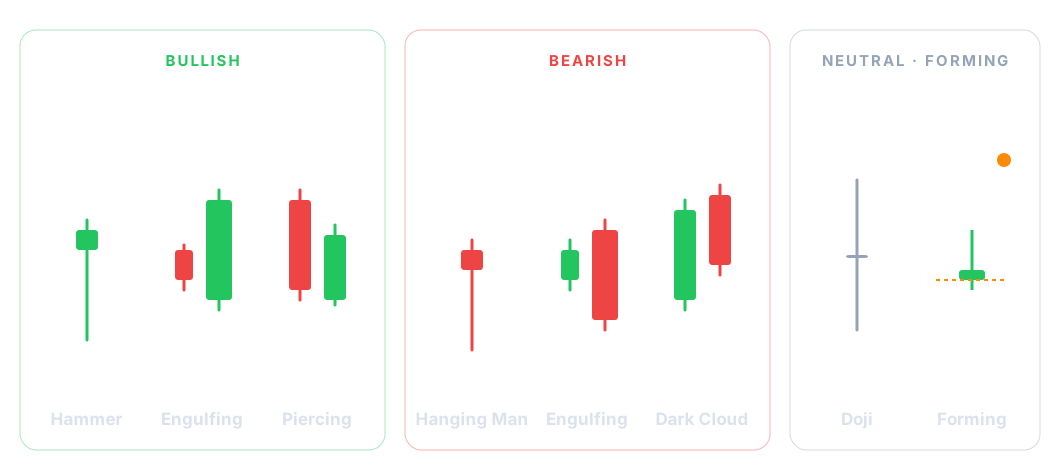

Candle patterns as they form.
Find stocks forming doji, hammer, engulfing, tail and other candlestick patterns as each candle completes.
-
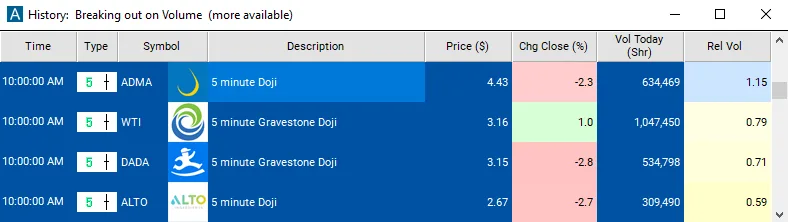
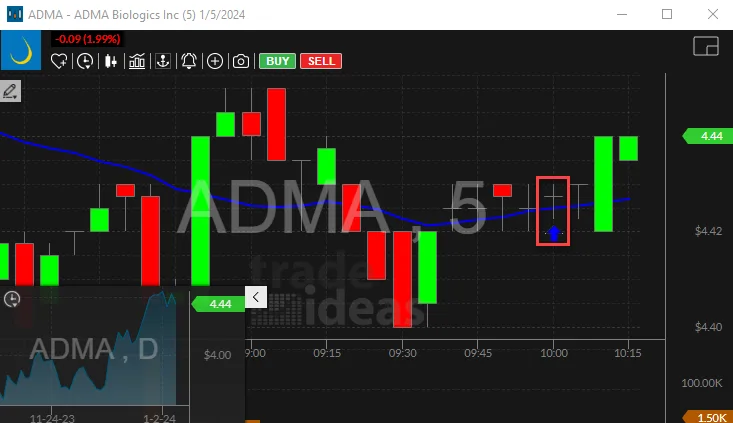
 Doji
Find stocks forming a doji candlestick on the 5-minute chart as each candle completes.
-
Bullish2 Minute HammerFind stocks forming a hammer candlestick on the 2-minute chart as each candle completes.
More
Find stocks printing a hammer candle on the 2-minute chart in real time with Trade Ideas Streaming Alerts. A hammer is a candle with no upper wick, a small body and a large lower wick that appears in a downtrend; most traders read it as a bullish reversal. This alert checks 2 minute candles.
-
Bearish 2 Minute Hanging Man
Find stocks forming a hanging man candlestick on the 2-minute chart as each candle completes.
More
Find stocks printing a hanging man candle on the 2-minute chart in real time with Trade Ideas Streaming Alerts. A hanging man is a hammer-shaped candle that appears in an uptrend; most traders read it as a bearish reversal. This alert checks 2 minute candles.
-
Bullish5 Minute Bullish EngulfingFind stocks forming a bullish engulfing candlestick on the 5-minute chart as each candle completes.
-
Bearish5 Minute Bearish EngulfingFind stocks forming a bearish engulfing candlestick on the 5-minute chart as each candle completes.
-
Bullish5 Minute Piercing PatternFind stocks forming a piercing pattern candlestick on the 5-minute chart as each candle completes.
-
Bearish5 Minute Dark Cloud CoverFind stocks forming a dark cloud cover candlestick on the 5-minute chart as each candle completes.
-
Bullish2 Minute Bottoming TailFind stocks forming a bottoming tail candlestick on the 2-minute chart as each candle completes.
More
Find stocks printing a bottoming tail candle on the 2-minute chart in real time with Trade Ideas Streaming Alerts. A bottoming tail is a small-bodied candle with a long lower tail after 3 red candles. This alert checks 2 minute candles.
-
Bearish2 Minute Topping TailFind stocks forming a topping tail candlestick on the 2-minute chart as each candle completes.
More
Find stocks printing a topping tail candle on the 2-minute chart in real time with Trade Ideas Streaming Alerts. A topping tail is a small-bodied candle with a long upper tail after 3 green candles. This alert checks 2 minute candles.
-
Bullish5 Minute Narrow Range Buy BarFind stocks forming a narrow range buy bar candlestick on the 5-minute chart as each candle completes.
More
Find stocks printing a narrow range buy bar candle on the 5-minute chart in real time with Trade Ideas Streaming Alerts. A narrow range buy bar is three or more green bars followed by a bar smaller than 25% of the average range of the past 5 bars. This alert checks 5 minute candles.
-
Bearish5 Minute Narrow Range Sell BarFind stocks forming a narrow range sell bar candlestick on the 5-minute chart as each candle completes.
More
Find stocks printing a narrow range sell bar candle on the 5-minute chart in real time with Trade Ideas Streaming Alerts. A narrow range sell bar is three or more red bars followed by a bar smaller than 25% of the average range of the past 5 bars. This alert checks 5 minute candles.
-
Bullish2 Minute Green Bar ReversalFind stocks forming a green bar reversal candlestick on the 2-minute chart as each candle completes.
More
Find stocks printing a green bar reversal candle on the 2-minute chart in real time with Trade Ideas Streaming Alerts. A green bar reversal is a green candle after three or more consecutive down candles. This alert checks 2 minute candles.
-
Bearish2 Minute Red Bar ReversalFind stocks forming a red bar reversal candlestick on the 2-minute chart as each candle completes.
More
Find stocks printing a red bar reversal candle on the 2-minute chart in real time with Trade Ideas Streaming Alerts. A red bar reversal is a red candle after three or more consecutive up candles. This alert checks 2 minute candles.
-
NR7 (narrowest range in 7 bars)
Find stocks with an NR7 (narrowest range in 7 bars) on the 1-minute chart as each candle completes.
More
Find stocks printing an NR7, the narrowest range of the last 7 bars, on the 1-minute chart, in real time, with Trade Ideas Streaming Alerts. NR7 means the last candle has the narrowest high-to-low range of the last 7 candles, a sign of shrinking volatility that often comes before a bigger move. It does not predict direction by itself.
-
Wide range bar
Find stocks forming a wide range bar candlestick on the 2-minute chart as each candle completes.
More
Find stocks printing a wide range bar candle on the 2-minute chart in real time with Trade Ideas Streaming Alerts. A wide range bar is a bar whose range is much greater than the average bar. This alert checks 2 minute candles.
Chart Patterns
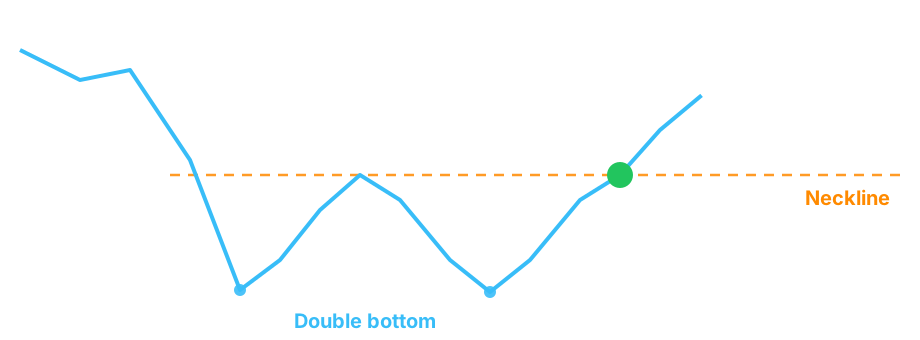

Chart patterns as they complete.
Find stocks forming double tops and bottoms, head and shoulders, triangles, rectangles, consolidations and 1-2-3 continuations.
Matching filters: Range & Volatility filters (consolidation)
-
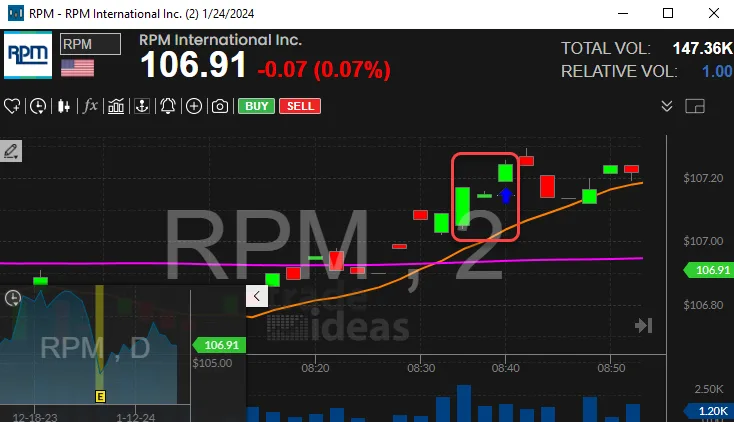
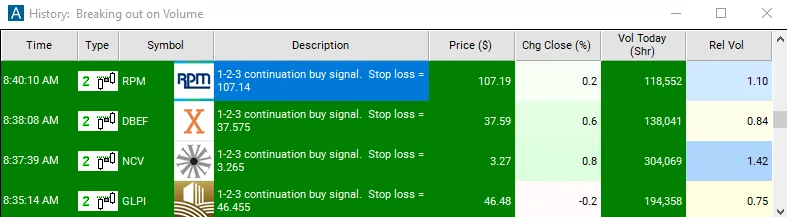
Bullish2 Minute 1-2-3 Continuation Buy SignalFind 2-minute 1-2-3 continuation buy signals as they form.
More
Find stocks triggering a 1-2-3 continuation buy on the 2-minute chart in real time with Trade Ideas Streaming Alerts. The 1-2-3 continuation buy pattern is a tall green bar, then a smaller bar that forms a mini double-top, then a break above bars 1 and 2. The signal fires as price clears that level.
-
Bearish 2 Minute 1-2-3 Continuation Sell Signal
Find 2-minute 1-2-3 continuation sell signals as they form.
More
Find stocks triggering a 1-2-3 continuation sell on the 2-minute chart in real time with Trade Ideas Streaming Alerts. The 1-2-3 continuation sell pattern is a tall red bar, then a smaller bar that forms a mini double-bottom, then a break below bars 1 and 2. The signal fires as price clears that level.
-
Bullish2 Minute 1-2-3 Continuation Buy SetupFind 2-minute 1-2-3 continuation buy setups as they form.
More
Find stocks setting up a 1-2-3 continuation buy on the 2-minute chart in real time with Trade Ideas Streaming Alerts. The 1-2-3 continuation buy pattern is a tall green bar, then a smaller bar that forms a mini double-top, then a break above bars 1 and 2.
-
Bearish2 Minute 1-2-3 Continuation Sell SetupFind 2-minute 1-2-3 continuation sell setups as they form.
More
Find stocks setting up a 1-2-3 continuation sell on the 2-minute chart in real time with Trade Ideas Streaming Alerts. The 1-2-3 continuation sell pattern is a tall red bar, then a smaller bar that forms a mini double-bottom, then a break below bars 1 and 2.
-
BullishCheck MarkFind stocks forming a check mark continuation pattern as it completes: a push, a pullback, then new highs.
-
BearishInverted Check MarkFind stocks forming an inverted check mark as it completes: a drop, a bounce, then new lows.
-
 Consolidation
Find stocks consolidating in a tight range, as it forms.
More
Find stocks consolidating in an unusually tight range in real time with Trade Ideas Streaming Alerts. A consolidation is when a stock's price is changing significantly less than normal for its volatility, a coiled range that often comes before a breakout.
-
Bullish5 Minute Consolidation BreakoutFind 5-minute consolidation breakouts as they happen.
More
Find stocks breaking out above a 5-minute consolidation range in real time with Trade Ideas Streaming Alerts. A 5-minute consolidation breakout is when price moves up out of a consolidation range on the 5-minute chart. It is traditional chart analysis on one time frame, and a single print can trigger it.
-
Bearish5 Minute Consolidation BreakdownFind 5-minute consolidation breakdowns as they happen.
More
Find stocks breaking down below a 5-minute consolidation range in real time with Trade Ideas Streaming Alerts. A 5-minute consolidation breakdown is when price moves down out of a consolidation range on the 5-minute chart. It is traditional chart analysis on one time frame, and a single print can trigger it.
-
BullishDouble BottomFind stocks forming a double bottom pattern as it completes.
-
BearishDouble TopFind stocks forming a double top pattern as it completes.
-
BullishInverted Head and ShouldersFind stocks forming an inverted head and shoulders pattern as it completes.
-
BearishHead and ShouldersFind stocks forming a head and shoulders pattern as it completes.
-
BullishTriangle BottomFind stocks forming a triangle bottom pattern as it completes.
-
BearishTriangle TopFind stocks forming a triangle top pattern as it completes.
-
BullishRectangle BottomFind stocks forming a rectangle bottom pattern as it completes.
-
BearishRectangle TopFind stocks forming a rectangle top pattern as it completes.
-
BullishBroadening BottomFind stocks forming a broadening bottom pattern as it completes.
-
BearishBroadening TopFind stocks forming a broadening top pattern as it completes.
Fibonacci & Pullbacks
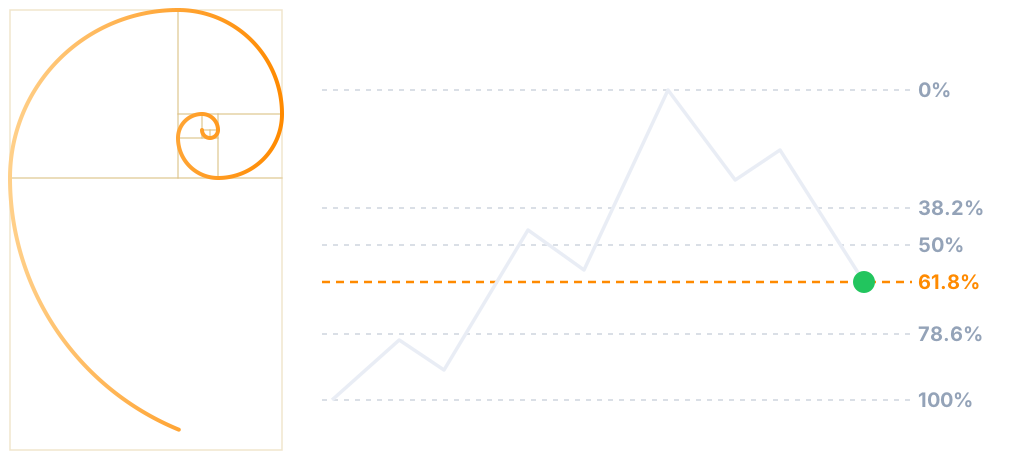

Pullbacks to Fibonacci levels.
Find stocks pulling back 25% or 75% of a move, or reaching the 38%, 50%, 62% and 79% Fibonacci levels.
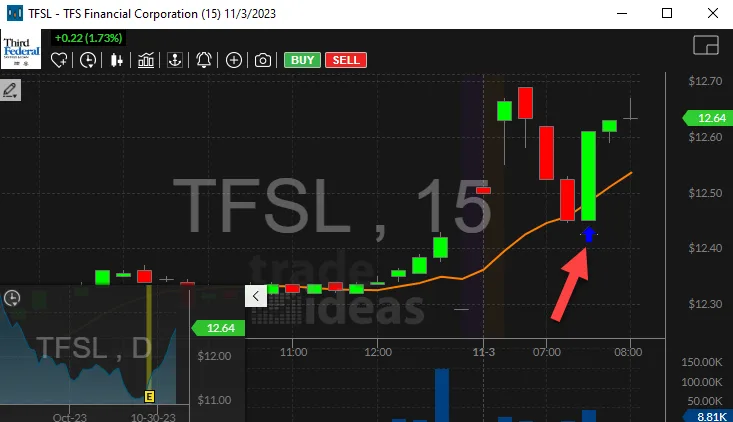
-
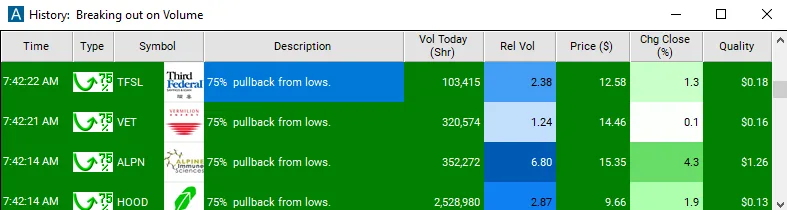
Bullish75% Pullback From LowsFind stocks pulling back 75% from today's low toward the open or prior close, print by print.
More
Find stocks that have given back 75% of the move between the open or prior close and today's low in real time with Trade Ideas Streaming Alerts. A 75% pullback from lows measures the move from the open or prior close to today's low, then flags the stock when it returns 75% of the way back.
-
Bearish 75% Pullback From Highs
Find stocks pulling back 75% from today's high toward the open or prior close, print by print.
More
Find stocks that have given back 75% of the move between the open or prior close and today's high in real time with Trade Ideas Streaming Alerts. A 75% pullback from highs measures the move from the open or prior close to today's high, then flags the stock when it returns 75% of the way back.
-
Bullish25% Pullback From LowsFind stocks pulling back 25% from today's low toward the open or prior close, print by print.
More
Find stocks that have given back 25% of the move between the open or prior close and today's low in real time with Trade Ideas Streaming Alerts. A 25% pullback from lows measures the move from the open or prior close to today's low, then flags the stock when it returns 25% of the way back.
-
Bearish25% Pullback From HighsFind stocks pulling back 25% from today's high toward the open or prior close, print by print.
More
Find stocks that have given back 25% of the move between the open or prior close and today's high in real time with Trade Ideas Streaming Alerts. A 25% pullback from highs measures the move from the open or prior close to today's high, then flags the stock when it returns 25% of the way back.
-
Bullish75% Pullback From Lows (Close)Find stocks pulling back 75% from today's low toward yesterday's close, print by print.
More
Find stocks that have given back 75% of the move between yesterday's close and today's low in real time with Trade Ideas Streaming Alerts. A 75% pullback from lows measures the move from yesterday's close to today's low, then flags the stock when it returns 75% of the way back.
-
Bearish75% Pullback From Highs (Close)Find stocks pulling back 75% from today's high toward yesterday's close, print by print.
More
Find stocks that have given back 75% of the move between yesterday's close and today's high in real time with Trade Ideas Streaming Alerts. A 75% pullback from highs measures the move from yesterday's close to today's high, then flags the stock when it returns 75% of the way back.
-
Bullish25% Pullback From Lows (Close)Find stocks pulling back 25% from today's low toward yesterday's close, print by print.
More
Find stocks that have given back 25% of the move between yesterday's close and today's low in real time with Trade Ideas Streaming Alerts. A 25% pullback from lows measures the move from yesterday's close to today's low, then flags the stock when it returns 25% of the way back.
-
Bearish25% Pullback From Highs (Close)Find stocks pulling back 25% from today's high toward yesterday's close, print by print.
More
Find stocks that have given back 25% of the move between yesterday's close and today's high in real time with Trade Ideas Streaming Alerts. A 25% pullback from highs measures the move from yesterday's close to today's high, then flags the stock when it returns 25% of the way back.
-
Bullish75% Pullback From Lows (Open)Find stocks pulling back 75% from today's low toward today's open, print by print.
More
Find stocks that have given back 75% of the move between today's open and today's low in real time with Trade Ideas Streaming Alerts. A 75% pullback from lows measures the move from today's open to today's low, then flags the stock when it returns 75% of the way back.
-
Bearish75% Pullback From Highs (Open)Find stocks pulling back 75% from today's high toward today's open, print by print.
More
Find stocks that have given back 75% of the move between today's open and today's high in real time with Trade Ideas Streaming Alerts. A 75% pullback from highs measures the move from today's open to today's high, then flags the stock when it returns 75% of the way back.
-
Bullish25% Pullback From Lows (Open)Find stocks pulling back 25% from today's low toward today's open, print by print.
More
Find stocks that have given back 25% of the move between today's open and today's low in real time with Trade Ideas Streaming Alerts. A 25% pullback from lows measures the move from today's open to today's low, then flags the stock when it returns 25% of the way back.
-
Bearish25% Pullback From Highs (Open)Find stocks pulling back 25% from today's high toward today's open, print by print.
More
Find stocks that have given back 25% of the move between today's open and today's high in real time with Trade Ideas Streaming Alerts. A 25% pullback from highs measures the move from today's open to today's high, then flags the stock when it returns 25% of the way back.
-
BullishFibonacci 38% Buy SignalFind stocks hitting the 38% Fibonacci retracement level as it happens.
More
Find stocks reaching the 38% Fibonacci retracement of today's range in real time with Trade Ideas Streaming Alerts. A 38% Fibonacci retracement is when price pulls back 38% of a move. This alert reports when price crosses that level going down (shown as a buy), the common reversal reading.
-
BearishFibonacci 38% Sell SignalFind stocks hitting the 38% Fibonacci retracement level as it happens.
More
Find stocks reaching the 38% Fibonacci retracement of today's range in real time with Trade Ideas Streaming Alerts. A 38% Fibonacci retracement is when price pulls back 38% of a move. This alert reports when price crosses that level going up (shown as a sell), the common reversal reading.
-
BullishFibonacci 50% Buy SignalFind stocks hitting the 50% Fibonacci retracement level as it happens.
More
Find stocks reaching the 50% Fibonacci retracement of today's range in real time with Trade Ideas Streaming Alerts. A 50% Fibonacci retracement is when price pulls back 50% of a move. This alert reports when price crosses that level going down (shown as a buy), the common reversal reading.
-
BearishFibonacci 50% Sell SignalFind stocks hitting the 50% Fibonacci retracement level as it happens.
More
Find stocks reaching the 50% Fibonacci retracement of today's range in real time with Trade Ideas Streaming Alerts. A 50% Fibonacci retracement is when price pulls back 50% of a move. This alert reports when price crosses that level going up (shown as a sell), the common reversal reading.
-
BullishFibonacci 62% Buy SignalFind stocks hitting the 62% Fibonacci retracement level as it happens.
-
BearishFibonacci 62% Sell SignalFind stocks hitting the 62% Fibonacci retracement level as it happens.
More
Find stocks reaching the 62% Fibonacci retracement of today's range in real time with Trade Ideas Streaming Alerts. A 62% Fibonacci retracement is when price pulls back 62% of a move. This alert reports when price crosses that level going up (shown as a sell), the common reversal reading.
-
BullishFibonacci 79% Buy SignalFind stocks hitting the 79% Fibonacci retracement level as it happens.
More
Find stocks reaching the 79% Fibonacci retracement of today's range in real time with Trade Ideas Streaming Alerts. A 79% Fibonacci retracement is when price pulls back 79% of a move. This alert reports when price crosses that level going down (shown as a buy), the common reversal reading.
-
BearishFibonacci 79% Sell SignalFind stocks hitting the 79% Fibonacci retracement level as it happens.
More
Find stocks reaching the 79% Fibonacci retracement of today's range in real time with Trade Ideas Streaming Alerts. A 79% Fibonacci retracement is when price pulls back 79% of a move. This alert reports when price crosses that level going up (shown as a sell), the common reversal reading.
Market & Sector Context
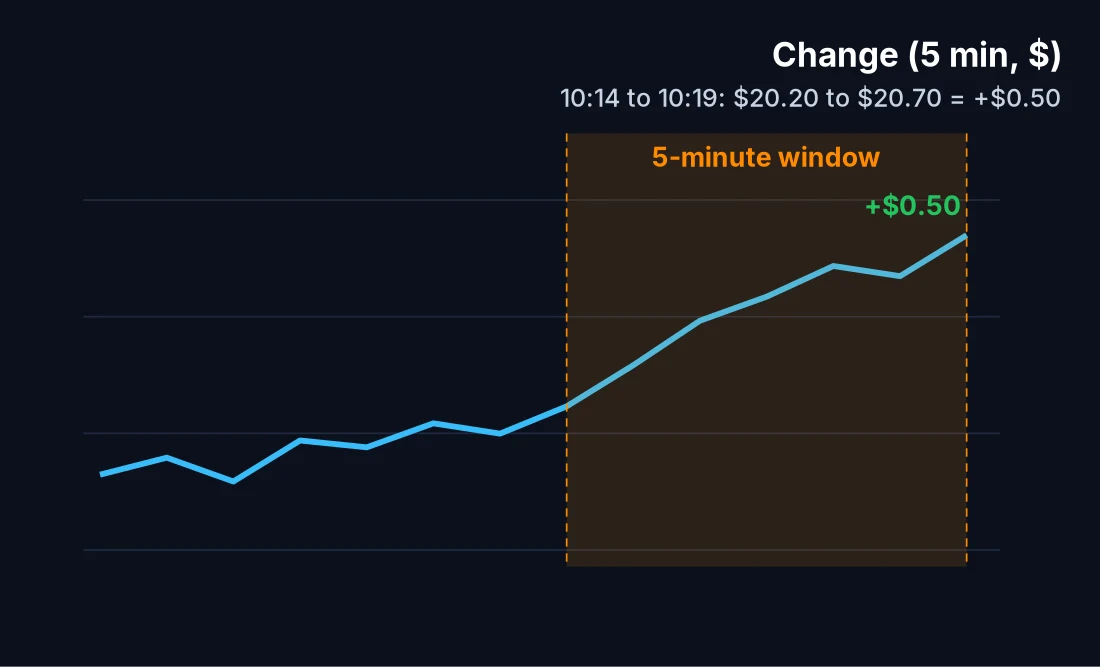

Markets and sectors.
Find stocks breaking out with their sector, or moving against the overall market.
Matching filters: Market Context filters
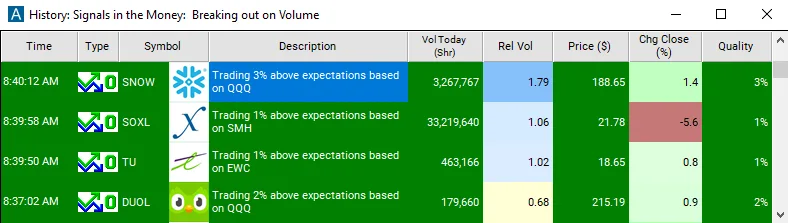
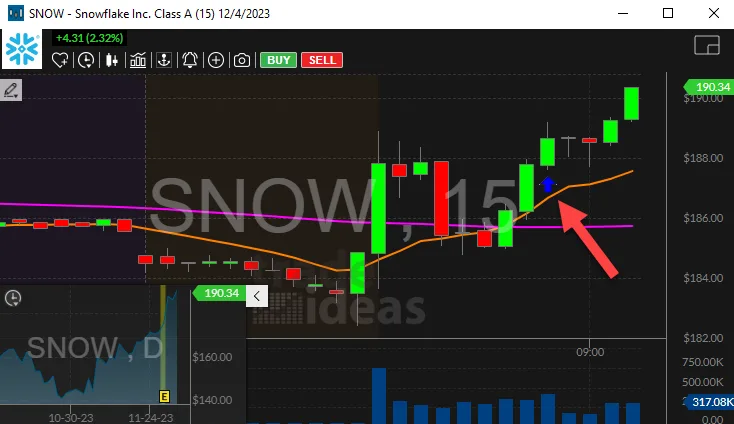
-
BullishSector Breakout (from Open)Find stocks outperforming their sector since the open, as it happens.
More
Find stocks beating their sector since the open in real time with Trade Ideas Streaming Alerts. A sector breakout means a stock is moving better than the index that best predicts it, by at least 1% versus expectations, measured from the open.
-
Bearish Sector Breakdown (from Open)
Find stocks underperforming their sector since the open, as it happens.
More
Find stocks lagging their sector since the open in real time with Trade Ideas Streaming Alerts. A sector breakdown means a stock is moving worse than the index that best predicts it, by at least 1% versus expectations, measured from the open.
-
BullishSector Breakout (from Close)Find stocks outperforming their sector since the close, as it happens.
More
Find stocks beating their sector since the close in real time with Trade Ideas Streaming Alerts. A sector breakout means a stock is moving better than the index that best predicts it, by at least 1% versus expectations, measured from the close.
-
BearishSector Breakdown (from Close)Find stocks underperforming their sector since the close, as it happens.
More
Find stocks lagging their sector since the close in real time with Trade Ideas Streaming Alerts. A sector breakdown means a stock is moving worse than the index that best predicts it, by at least 1% versus expectations, measured from the close.
-
BullishPositive Market DivergenceFind stocks outperforming the market (QQQ) as it happens, even premarket and after hours.
More
Find stocks moving above what QQQ predicts, including before and after hours, in real time, with Trade Ideas Streaming Alerts. A positive market divergence is when a stock moves above the price expected from its relationship to QQQ. It is tuned for low-volume times like premarket and after hours.
-
BearishNegative Market DivergenceFind stocks underperforming the market (QQQ) as it happens, even premarket and after hours.
More
Find stocks moving below what QQQ predicts, including before and after hours, in real time, with Trade Ideas Streaming Alerts. A negative market divergence is when a stock moves below the price expected from its relationship to QQQ. It is tuned for low-volume times like premarket and after hours.
Status & System

Halts and resumes, as they hit.
-
 Halt
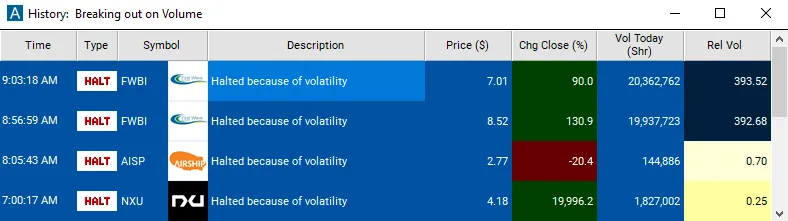
Get stock halt alerts as they happen, with the halt reason.
More
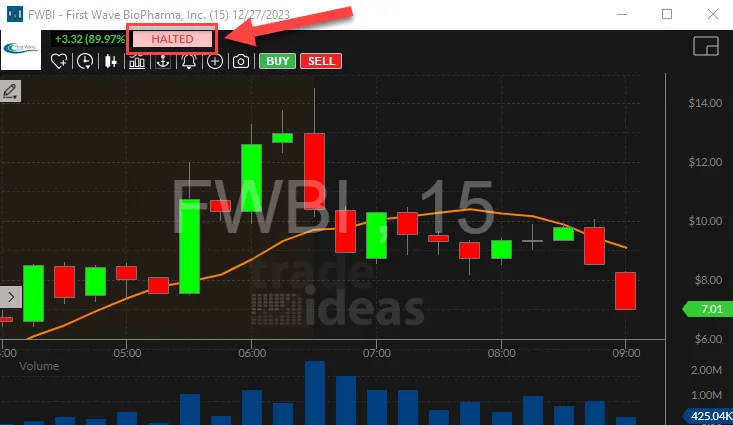
Find stocks halted for trading, with the halt reason, in real time, with Trade Ideas Streaming Alerts. A trading halt is a temporary suspension of trading in a stock. The Halt alert reports the halt and, in the description column, why the stock was halted.
-
Resume
Get alerts the moment halted stocks resume trading.
More
Find halted stocks the moment they resume trading in real time with Trade Ideas Streaming Alerts. A resume is when a previously halted stock starts trading again.
-
Heartbeat
Use Streaming Alerts as a stock screener.
More
Find every stock that matches your filters, refreshed every 5 minutes, like a traditional stock screener, in real time, with Trade Ideas Streaming Alerts. The Heartbeat alert fires for each stock every 5 minutes, with little regard for market data. Pair it with filters to use Streaming Alerts like a traditional stock screener.
More alerts
-
Offer Stepping Down
Bearish -
Tests and Demonstrations
Browse by original group
The 16 original Trade Ideas alert and filter groups each have their own page.
- Bid and Ask alerts and filters
- Candle Pattern alerts and filters
- Changes Daily alerts and filters
- End Of Candle alerts and filters
- Fibonacci alerts and filters
- Fixed Time Frame alerts and filters
- Fundamentals alerts and filters
- Geometric Pattern alerts and filters
- Highs and Lows alerts and filters
- Listed alerts and filters
- Moving Average alerts and filters
- NBBO Confirmed alerts and filters
- Price vs Time alerts and filters
- Single Print alerts and filters
- Support and Resistance alerts and filters
- Volume Confirmed alerts and filters
Every stock screener filter · How the Trade Ideas stock scanner works