


Running Down Now
Table of Contents
- Understanding the Running Down Now Alert
- Default Settings
- Custom Settings
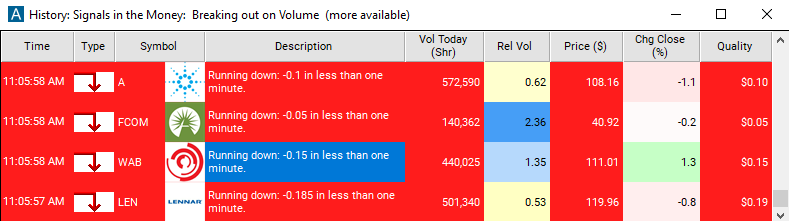
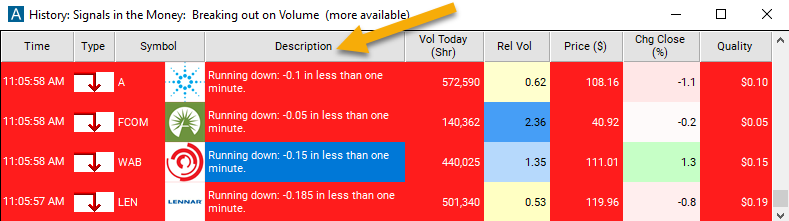
- Description Column
- Quality Column
Understanding the Running Down Now Alert
The running down now alerts notify the user when a stock price is trading down much faster than expected. We offer several versions of the running up and down alerts. These two work on the shortest time frame. These look for trends which would be most obvious on a 1 minute chart. These two alerts offer no confirmation, and can be set off by a single print. As a result, they often detect a trend more quickly than the other running alerts. They are also the simplest to understand because you can see everything they are doing if you watch a 1 minute candlestick chart. These alerts can be used to answer questions like, “show me stocks which have moved at least 25 cents in the last minute.” We always report the size of the move in the description of the alert. You can also filter based on that information. We only display the size of the move, because the timeframe is always 1 minute. If you want to see similar information for longer time frames, look at Min Up 5 and related filters. Like all of our running alerts, you do not need to add your own filter. The server will never display a move which is not unusual for that stock. For example if you ask to see every time Google moves a penny, the server will ignore your request. However, these two alerts have the simplest filters of all the running alerts. If you want to see stocks moving a specific amount, use these two alerts. These two alerts are based on the same mathematical models that we use to examine candlestick charts. If you are looking at stocks with ugly candlestick charts, you should consider one of the other running or down alerts listed below. Examples include candlestick charts where candles are frequently missing or empty, where candles are flat more often than not, where many candles are almost as big as the entire chart, or where gaps between the candles are often almost as big as the entire chart. Any time the short term candlestick chart doesn’t look like the pictures of charts in books on trading, you should consider one of the other alerts. The other alerts use more statistics to find the trend and additional data to confirm the trend. All of the running alerts are available before and after hours. However, the confirmation required for most of these alerts makes it hard for them to fire at these times. The running up and down now alerts may be more appropriate than the other alerts before and after hours.
Default Settings
By default, the running down now alert will appear a stock price is trading down much faster than expected.
Custom Settings
For 'Running Down Now' alerts, you have the option to use an alert specific filter. This filter is located immediately to the right of the corresponding alert and is always optional. You can decide to leave it blank if you want to receive more alerts, or you can fill it in to restrict the number of alerts you receive.
This filter allows you to specify the quality of the alert. When you set a higher number for this filter, you are telling the alerts server to display only alerts that meet a higher quality standard, resulting in fewer alerts being shown.
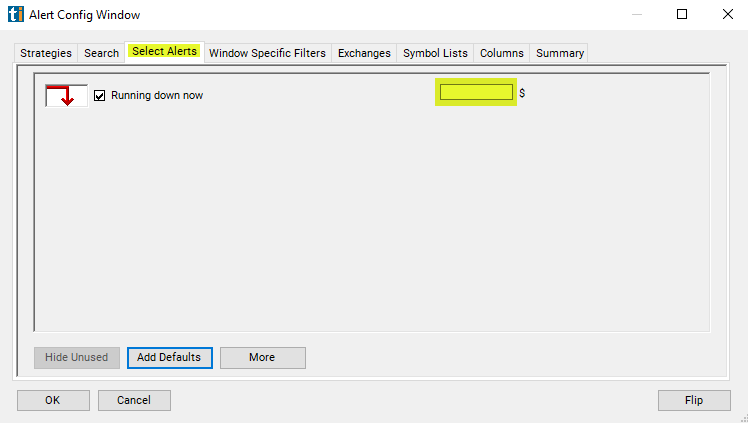
When setting an alert for 'Running Down Now', the user can filter these alerts based on the size of the move in dollars. For example, if you only want to see stocks which have moved at least 60 cents in the last minute, set the filter to "0.60".
Description Column
The description column of your scan will report the size of the move in a certain time frame.
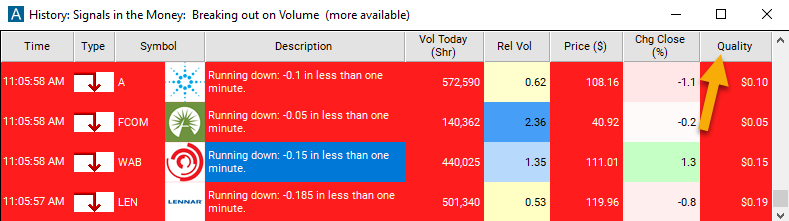
Quality Column
The quality column of your scan will show the size of the move.
Alert Info for Running Down Now [RDN]
- description = Running down now
- direction = -
- keywords = Price vs Time Single Print
- flip_code =
 Running up now [RUN]
 - parent_code = RUN