


60 Minute Opening Range Breakdown
Table of Contents
Understanding the 60 Minute Opening Range Breakdown Alert
These alerts define support as the lowest point in the first candle of the day. Resistance is the highest point in the first candle. The first time we break above resistance, that's an opening range breakout. The first time we break below support, that's an opening range breakdown. You can choose between 1, 2, 5, 10, 15, 30 and 60 minute candles. 15 is the most popular choice, but they are all valid.
Many trading strategies tell the trader to watch a stock closely from the open, but not to make any trades until the market has settled down. Wait for the stock to choose a direction. Use the size of the first candle to tell you how much the stock has to move before it has selected a direction.
These alerts automate the strategy described above. Instead of watching one stock closely, let our software search through the entire market to tell you what's hot. Scans like these monitor all stocks on various time frames. Let's say, for example, that you don't like to start trading until 10 o'clock. Bulls and bears will become obvious at that time if you watch the 30 minute opening range breakouts and breakdowns. In addition to picking individual stocks, you can use the alerts to get a feel for the overall market. Gauge the strength or weakness of the market based on the number of breakouts vs. breakdowns that you see.
These are powerful alerts because the stock price must pass through two forms of support or resistance. A breakout alert only occurs when the stock price breaks above the high of the first candle, for the first time all day. That means that the stock is also making new daily highs at the same time as it is crossing the resistance line described above. For the same reason, a breakdown alert means that the stock is making new lows for the day at the same time as it is passing through the support described above.
Note: Each stock has its own clock. We start the clock when a stock has its first print of the day. For NYSE stocks we ignore any prints before the specialist opens the market.
Default Settings
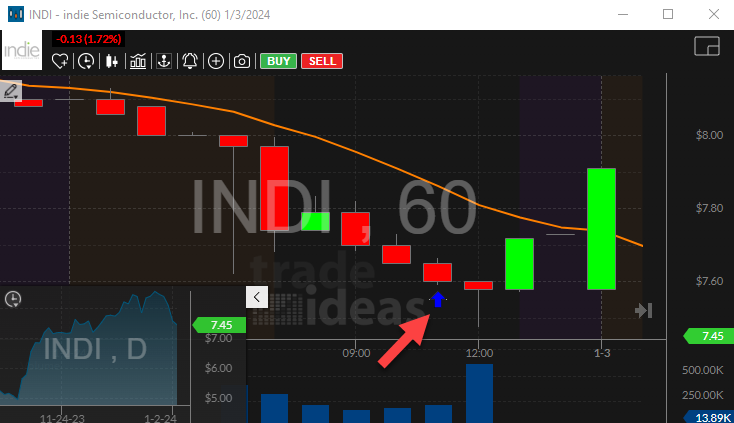
By default, the 60-minute opening range breakdown alert is automatically triggered when a stock's price breaks below support for the first time during the trading day. To align with each alert, it's essential to utilize the corresponding time frame on the chart. For instance, the 60-minute opening range breakdown is visualized on the 60-minute candlestick chart.
Description Column
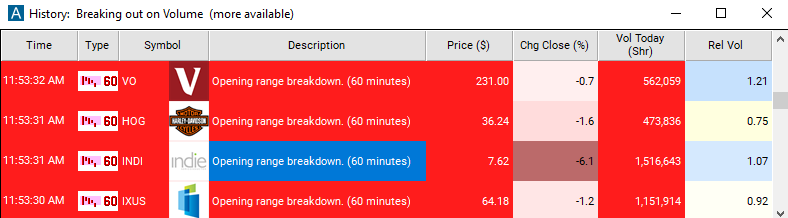
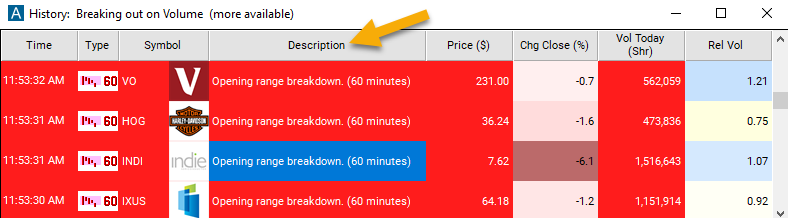
The description column of this scan will display "Opening Range Breakdown (60 minutes)", providing you with a clear indication of the specific alert that has been triggered.
Alert Info for 60 Minute Opening Range Breakdown [ORD60]
- description = 60 minute opening range breakdown
- direction = -
- keywords = Fixed Time Frame Single Print
- flip_code =
 60 minute opening range breakout [ORU60]
 - parent_code = ORU1