







 GTBOT
▲ Bullish
Streaming Alert (Scanner)
Triangle Bottom Alert (GTBOT)
By Daniel Mirkin, CEO, Trade Ideas. Updated October 2026.
Find stocks forming a triangle bottom pattern in real time with Trade Ideas Streaming Alerts (Scanner). A triangle bottom pattern is when a stock has formed a triangle (lower highs and higher lows) whose first move was up. Trade Ideas reports it after at least 5 turning points.
Know when the pattern finishes.
Free account, just an email. No card. Live access for a limited time.


Streaming Alerts show a triangle bottom the moment it completes, not on the next refresh.
How Trade Ideas finds it: by default, the 'Triangle Bottom' alert will appear when there is a series of at least 5 consecutive higher lows and lower highs. See Trade Ideas plans and pricing to run it live.
What is a triangle bottom?
A triangle bottom is the same narrowing pattern as a triangle top, but it starts at a low and the first leg goes up. Highs get lower, lows get higher, and the range gets squeezed.
The word bottom does not mean the stock will go up. Trade Ideas colors it green because of the first swing. The break out of the triangle is what matters.
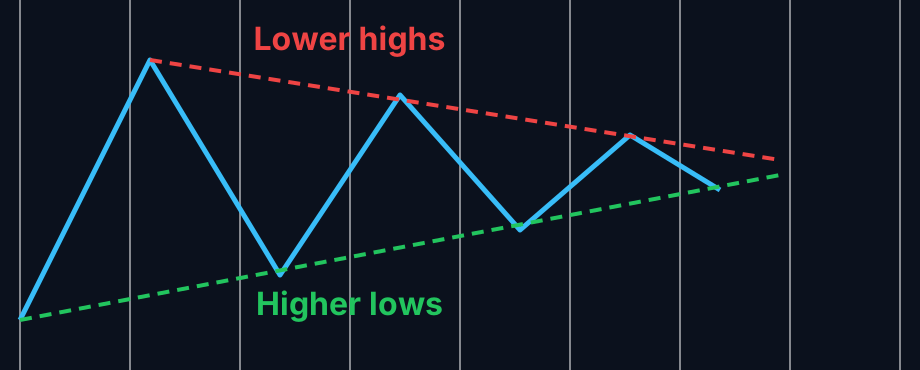
Parts of a triangle bottom
First swing up
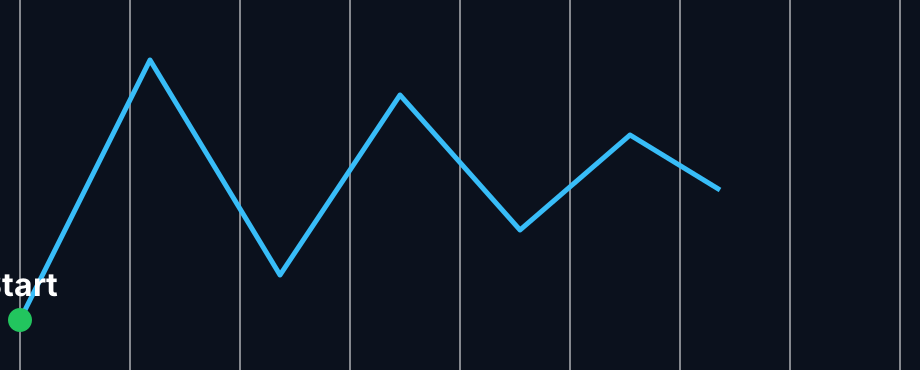
The pattern begins at a low and rallies. That first move up is why it gets the bottom label.
Converging lines
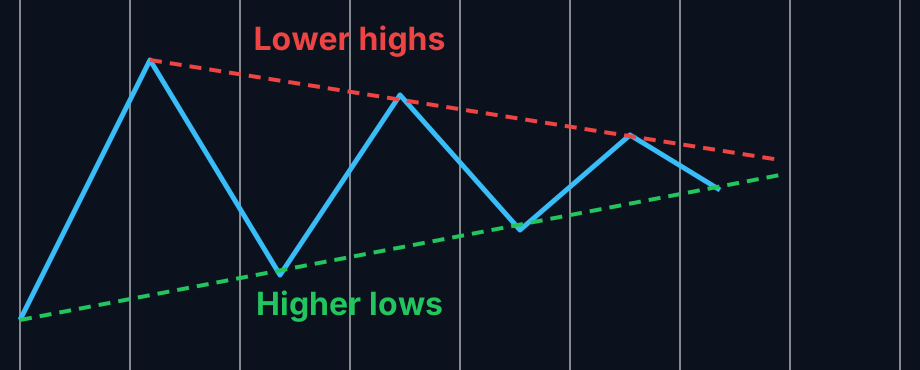
Lows step up and highs step down. Price has less and less room.
Five turns
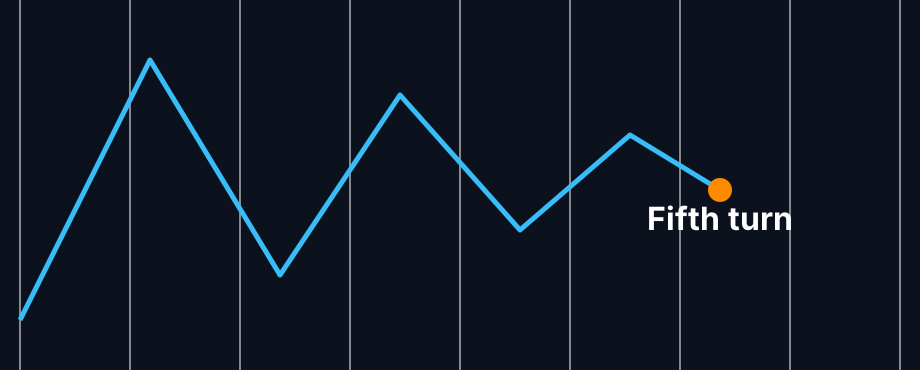
Once there are five consecutive highs and lows in the pattern, the alert fires.
How traders use it
Step 1: Let the Trade Ideas alert find it
Turn on the Triangle Bottom alert (GTBOT). Many traders run it together with Triangle Top, since the two only differ in how the pattern started. See it live in the Web Dashboard.
Step 2: Wait for the trigger
Key point
Wait for a close outside the triangle. Inside it, price can bounce between the lines for a while.
Step 3: Entry
Go with the direction of the break. Some traders wait for a quick retest of the broken line.
Step 4: Exit
Stops usually go back inside the triangle. A rough target is the triangle height at its widest. Traders treat that as a guide, and this is not advice.
Tips
- Narrow triangles on low volume can stay quiet for a long time.
- Combine with a relative volume filter so you see stocks that are waking up.
- On fast intraday charts, expect more false breaks.
- Related: the Triangle Top alert (GTTOP).
Past results, including backtests, are not indicative of future results.
How the Triangle Bottom alert works
Key point
This alert reports standard triangle patterns, which are common in technical analysis. A triangle pattern describes a stock price which keeps moving but covers smaller and smaller price ranges over time. A triangle is defined as a series of lower highs and higher lows. It takes at least 5 consecutive highs and lows in this pattern before we report it.
Trader tip
We use the term "triangle bottom" because it is so common in the literature. While triangles are important patterns, it is hard to say for certain if the price will go up or down after a triangle. We call a triangle a "bottom" and color it green if the first point is at the bottom, and the first line is going up. For the most common case, when the pattern contains exactly 5 turning points, a triangle bottom will end by going up.
After seeing a triangle pattern with 5 turning points, we might see more lower highs and higher lows. These points make the triangle pattern stronger and more distinct. Each one of these points means that the stock price changed direction. In these cases, we continue to use the first point, not the last point, to choose a name and icon for the pattern. We use the initial because point because the initial trend is the largest and the strongest trend in the triangle. The last point shows the smallest and the weakest trend.
Default settings
Settings
By default, the 'Triangle Bottom' alert will appear when there is a series of at least 5 consecutive higher lows and lower highs. It is determined a triangle bottom when the initial move is upward with the final move going up. The pattern is complete when the price breaks through its resistance level.
Custom settings
Settings
For 'Triangle Bottom' alerts, you have the option to use an alert specific filter. This filter is located immediately to the right of the corresponding alert and is always optional. You can decide to leave it blank if you want to receive more alerts, or you can fill it in to restrict the number of alerts you receive. This filter allows you to specify the quality of the alert. When you set a higher number for this filter, you are telling the alerts server to display only alerts that meet a higher quality standard, resulting in fewer alerts being shown.
When setting an alert for 'Triangle Bottom', the user can filter the alert by hours traded.

Normally there are 6.5 hours between the open and the close. But, what about premarket and post market?
Key point
If I see a pattern that lasted from noon yesterday to noon today, is that any better than a pattern that lasted from the open this morning to the close this afternoon? How much better? We weight the pre and post market according to volume. On an average day an average NASDAQ 100 stock will trade roughly 1 hour's worth of volume between the close and the following open. If you want to see stock patterns that lasted for a whole day, a good estimate is 7.5 hours, 6.5 for normal hours plus 1 for the pre and post market.
The same rules apply during the day. If a chart pattern lasts for one hour starting from the open, it will almost always be considered a stronger pattern than if it lasted one hour starting from the beginning of lunch. Hours are just an estimate. Volume is the major factor in this filter. Stocks trading on higher than average volume will satisfy this filter faster than stocks trading on lower than average volume.
What the alert shows you
Key point
The description of each alert lists the prices that formed the pattern. It also includes the times of when the pattern started and ended.

The quality value on a scan using the 'Triangle Bottom' alert defines the number of hours since the measured pattern has been established.

Related alerts
Filters to pair with the Triangle Bottom alert
Categories
FAQ
Which stocks are forming a triangle bottom pattern right now?
Turn on the Triangle Bottom alert (GTBOT) in Trade Ideas Streaming Alerts. By default, the 'Triangle Bottom' alert will appear when there is a series of at least 5 consecutive higher lows and lower highs.
What is the Triangle Bottom alert?
A triangle bottom pattern is when a stock has formed a triangle (lower highs and higher lows) whose first move was up. Trade Ideas reports it after at least 5 turning points.
How do I see fewer, higher-quality Triangle Bottom alerts?
Use the optional alert-specific filter immediately to the right of the alert. A higher number tells the alerts server to show only higher-quality alerts, so fewer appear. Leave it blank to see more.
What is the opposite of the Triangle Bottom alert?
Is a triangle bottom bullish?
Not necessarily. The name describes where the first point was. A triangle can break up or down.
Why does Trade Ideas call it a bottom?
The pattern starts at a low and the first line goes up, so it is labeled a bottom and shown in green.
Should I run Triangle Top and Triangle Bottom together?
Many traders do, since both describe the same narrowing range and only the starting swing differs.
What time frame does the triangle alert use?
It is built from local highs and lows with volume confirmation, so it tends to find longer, slower patterns than most alerts.