


Triangle Top
Table of Contents
- Understanding the Triangle Top Alert
- Default Settings
- Custom Settings
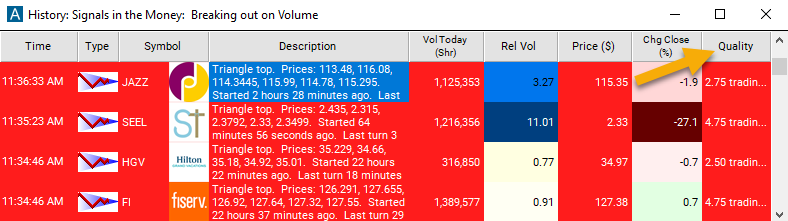
- Description Column
- Quality Column
Understanding the Triangle Top Alert
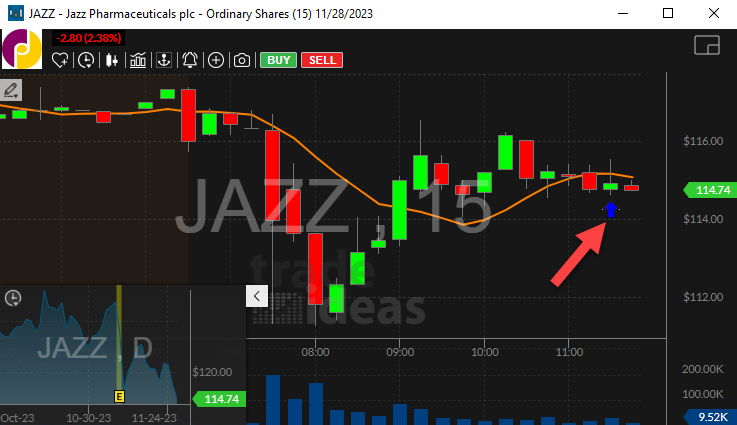
This alert reports standard triangle patterns, which are common in technical analysis. A triangle pattern describes a stock price which keeps moving but covers smaller and smaller price ranges over time. A triangle is defined as a series of lower highs and higher lows. It takes at least 5 consecutive highs and lows in this pattern before we report it.
We use the term "triangle top" because it is so common in the literature. While triangles are important patterns, it is hard to say for certain if the price will go up or down after a triangle. We call a triangle a "top" and color it red if the first point is at the top, and the first line is going down. For the most common case, when the pattern contains exactly 5 turning points, a triangle top will end by going down.
After seeing a triangle pattern with 5 turning points, we might see more lower highs and higher lows. These points make the triangle pattern stronger and more distinct. Each one of these points means that the stock price changed direction. In these cases, we continue to use the first point, not the last point, to choose a name and icon for the pattern. We use the initial because point because the initial trend is the largest and the strongest trend in the triangle. The last point shows the smallest and the weakest trend.
Default Settings
By default, the 'Triangle Top' alert will appear when there is a series of at least 5 consecutive higher lows and lower highs. It is determined a triangle top when the initial move is downward with the final move going down. The pattern is complete when the price breaks through its support level.
Custom Settings
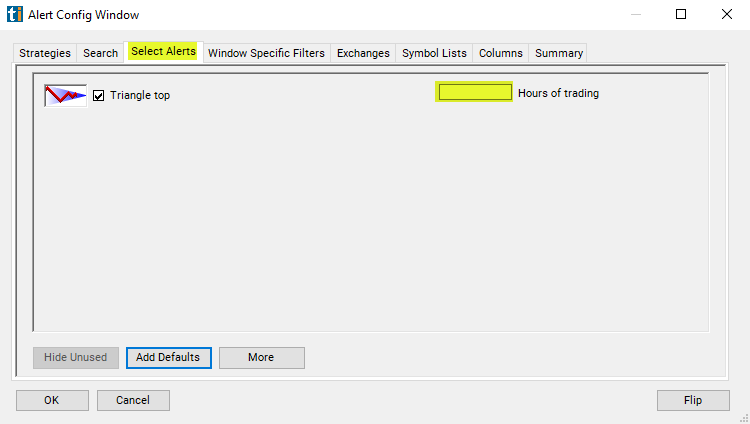
For 'Triangle Top' alerts, you have the option to use an alert specific filter. This filter is located immediately to the right of the corresponding alert and is always optional. You can decide to leave it blank if you want to receive more alerts, or you can fill it in to restrict the number of alerts you receive. This filter allows you to specify the quality of the alert. When you set a higher number for this filter, you are telling the alerts server to display only alerts that meet a higher quality standard, resulting in fewer alerts being shown.
When setting an alert for 'Triangle Top', the user can filter the alert by hours traded.
Normally there are 6.5 hours between the open and the close. But, what about premarket and post market?
If I see a pattern that lasted from noon yesterday to noon today, is that any better than a pattern that lasted from the open this morning to the close this afternoon? How much better? We weight the pre and post market according to volume. On an average day an average NASDAQ 100 stock will trade roughly 1 hour's worth of volume between the close and the following open. If you want to see stock patterns that lasted for a whole day, a good estimate is 7.5 hours, 6.5 for normal hours plus 1 for the pre and post market.
The same rules apply during the day. If a chart pattern lasts for one hour starting from the open, it will almost always be considered a stronger pattern than if it lasted one hour starting from the beginning of lunch. Hours are just an estimate. Volume is the major factor in this filter. Stocks trading on higher than average volume will satisfy this filter faster than stocks trading on lower than average volume.
Description Column
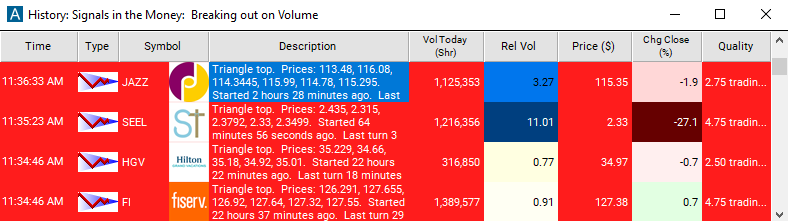
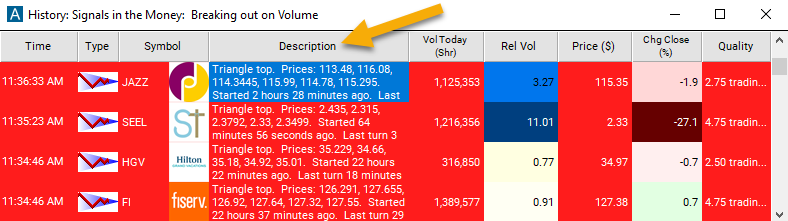
The description of each alert lists the prices that formed the pattern. It also includes the times of when the pattern started and ended.
Quality Column
The quality value on a scan using the 'Triangle Top' alert defines the number of hours since the measured pattern has been established.
Alert Info for Triangle Top [GTTOP]
- description = Triangle top
- direction = -
- keywords = Geometric Pattern Volume Confirmed
- flip_code =
 Triangle bottom [GTBOT]
 - parent_code = GTBOT