


Consolidation
Table of Contents
- Understanding the Consolidation Alert
- Default Settings
- Custom Settings
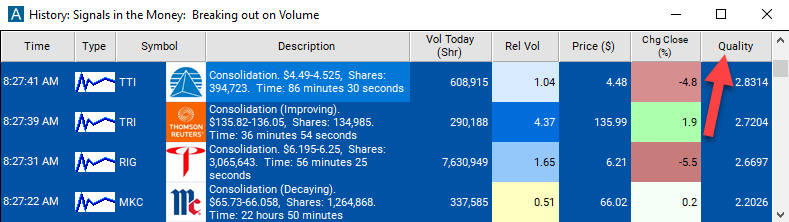
- Description Column
- Quality Column
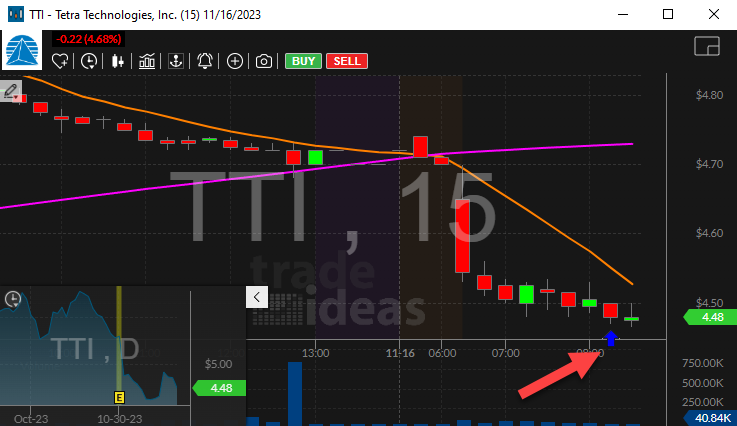
Understanding the Consolidation Alert
This alert appears when a stock price is changing significantly less than normal. The volatility of the stock sets the expected price range for a stock price. Statistical analysis determines if a consolidation is strong enough to report. If the software detects consolidations on multiple time frames, it reports the most statically significant time frame. On average the software reevaluates each consolidation every 15 minutes, but the exact time depends on how quickly the stock is trading. The analysis is based on the majority of trades, weighted by volume; outlying prints may be ignored.
This alert works best for stocks with medium to high volume. For low volume stocks, a few large prints can contribute more volume than all the rest of the prints combined.
Default Settings
By default, the consolidation alert will appear when a stock price is changing significantly less than normal.
Custom Settings
For 'Consolidation' alerts, you have the option to use an alert specific filter. This filter is located immediately to the right of the corresponding alert and is always optional. You can decide to leave it blank if you want to receive more alerts, or you can fill it in to restrict the number of alerts you receive. This filter allows you to specify the quality of the alert. When you set a higher number for this filter, you are telling the alerts server to display only alerts that meet a higher quality standard, resulting in fewer alerts being shown.
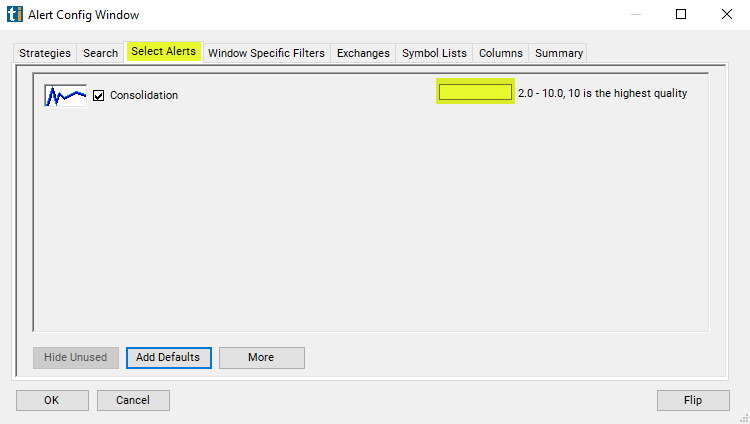
When setting an alert for 'Consolidation', the user can filter consolidation alerts based on the quality of the consolidation.
The quality of a consolidation is based on the chance that the consolidation pattern could be random, rather than interesting. The more time and volume in a consolidation, the higher the quality. For a given stock, the smaller the range, the higher the quality. For different stocks, historical volatility is used to make the quality scales match.
Internally, when the alerts server examines a stock it produces a Z-score describing the error in the consolidation pattern. This is a statistical measure comparing the ideal pattern, a range of $0, to the actual range, taking the volatility into account. Larger errors translate to lower quality. This Z-score is translated into a quality value so it will be easier to understand.
2 is the lowest quality that the alerts server ever reports. That is the default. 5 is the cutoff for a "tight" consolidation. That is reported in the description of the consolidation alert. 10 is the best quality reported by the alerts server. 10 means that the top and bottom of the trading range, as reported in the consolidation alert, are the same. This does not mean that all the prints were at exactly the same price. It means that, statistically speaking, this pattern is as good as we can measure or expect.
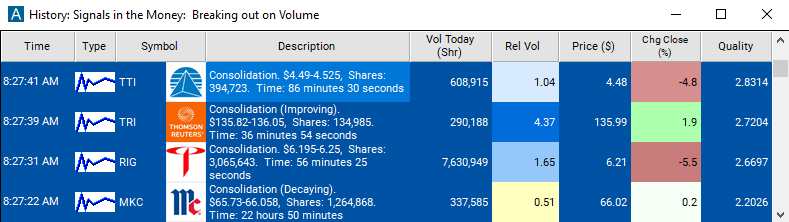
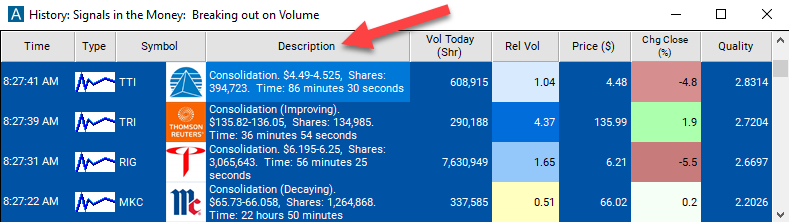
Description Column
The description of the alert will report price of the consolidation and how long the consolidation lasted. It will also report the number of shares at the time of the alert.
Quality Column
Add the quality column to a scan using the 'Consolidation' alert to see the Z-score of the stocks consolidation pattern.
Alert Info for Consolidation [C]
- description = Consolidation
- direction =
- keywords = Price vs Time Volume Confirmed
- flip_code =
- parent_code =