


Rectangle Bottom
Table of Contents
- Understanding the Rectangle Bottom Alert
- Default Settings
- Custom Settings
- Description Column
- Quality Column
Understanding the Rectangle Bottom Alert
A rectangle is another standard technical analysis pattern. A rectangle is defined by a series of highs and lows where each high is at approximately the same price as the other highs, and each low is at approximately the same price as the other lows. We report a rectangle pattern after seeing at least 5 consecutive highs and lows.
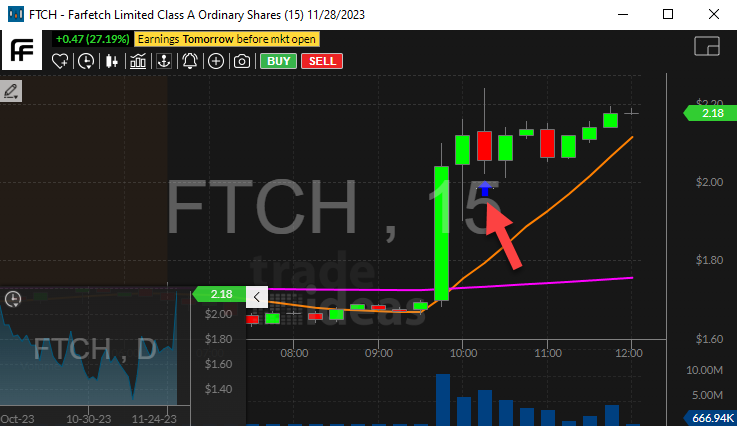
If the last turning point was a low, we call the pattern a rectangle bottom, and we draw a green icon to show that the price is going up. Each time we add another point to the rectangle, the direction changes.
Rectangles are similar to consolidation patterns, because they both show a stock trading in a channel. However, we use completely different algorithms to build the two types of channels. The consolidation algorithm depends heavily on the volatility of the stock, comparing the amount that the stock price moved recently to the amount that we would expect it to move. A consolidation pattern can become stronger if the price just stays inside the channel. A rectangle pattern depends more on the specific prices near the edges of the pattern. The only way to confirm a rectangle pattern is for the price to move up and down through the entire range of the rectangle. A rectangle might not be a consolidation pattern if the rectangle is too tall. A consolidation might not be a rectangle if the top and bottom edges are not precise enough.
We use the channels from our consolidation algorithm to create channel breakout alerts. This algorithm is good at finding a specific interesting price level. Our rectangle algorithm is best at exactly the opposite. The rectangle alert tells you that the channel has been confirmed, and the price is moving back inside the channel.
Default Settings
By default, the 'Rectangle Bottom' alert will appear when there is a series of at least 5 consecutive highs and lows that are ending at approximately the same price as the other highs and lows. It is reported as a 'Rectangle Bottom' if the last turning point is a low.
Custom Settings
For 'Rectangle Bottom' alerts, you have the option to use an alert specific filter. This filter is located immediately to the right of the corresponding alert and is always optional. You can decide to leave it blank if you want to receive more alerts, or you can fill it in to restrict the number of alerts you receive. This filter allows you to specify the quality of the alert. When you set a higher number for this filter, you are telling the alerts server to display only alerts that meet a higher quality standard, resulting in fewer alerts being shown.
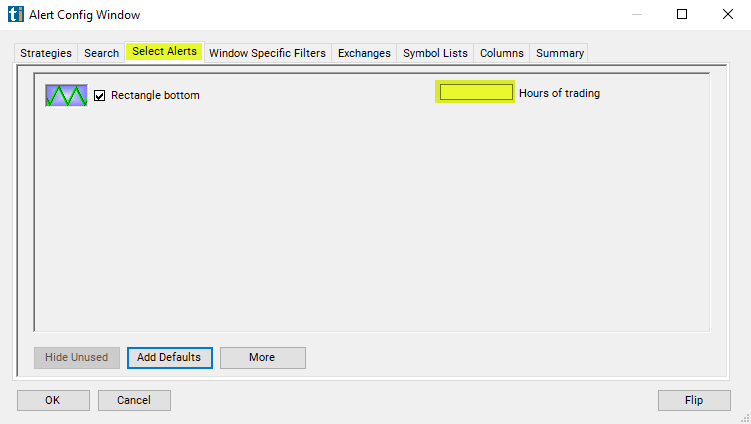
When setting an alert for 'Rectangle Bottom', the user can filter the alert by hours traded.
If I see a pattern that lasted from noon yesterday to noon today, is that any better than a pattern that lasted from the open this morning to the close this afternoon? How much better? We weight the pre and post market according to volume. On an average day an average NASDAQ 100 stock will trade roughly 1 hour's worth of volume between the close and the following open. If you want to see stock patterns that lasted for a whole day, a good estimate is 7.5 hours, 6.5 for normal hours plus 1 for the pre and post market.
The same rules apply during the day. If a chart pattern lasts for one hour starting from the open, it will almost always be considered a stronger pattern than if it lasted one hour starting from the beginning of lunch. Hours are just an estimate. Volume is the major factor in this filter. Stocks trading on higher than average volume will satisfy this filter faster than stocks trading on lower than average volume.
Description Column
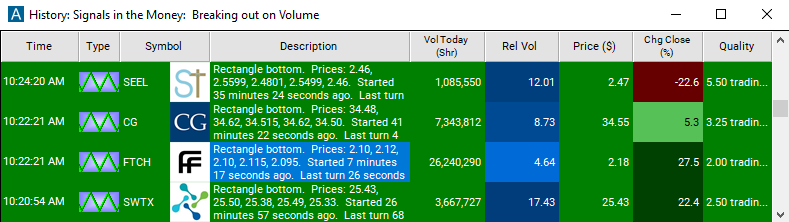
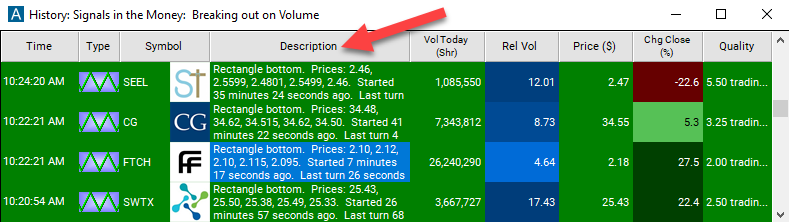
The description of each alert lists the prices that formed the pattern. It also includes the times of when the pattern started and ended.
Quality Column
The quality value on a scan using the 'Rectangle Bottom' alert defines the number of hours since the measured pattern has been established.

Alert Info for Rectangle Bottom [GRBOT]
- description = Rectangle bottom
- direction = +
- keywords = Geometric Pattern Volume Confirmed
- flip_code =
 Rectangle top [GRTOP]
 - parent_code =