


Consolidation
Table of Contents
- Understanding the Consolidation Filter
- Consolidation Filter Settings
- Using the Consolidation Filter
- FAQs
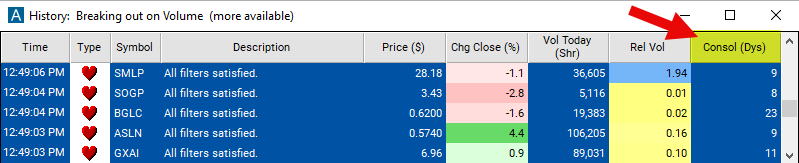
Understanding the Consolidation Filter
This filter looks for a consolidation pattern on a daily stock chart.
The consolidation filter in stock trading is a technical tool used to pinpoint periods when a stock's price trades within a narrow range, signaling a lack of clear trend direction. This filter identifies phases of price consolidation following significant price movements. Traders utilize the consolidation filter to identify potential range trading opportunities, anticipate breakout or breakdown movements, and adjust their trading strategies based on the duration and characteristics of the consolidation phase.
This looks at the daily candles for the previous 40 trading days. This does not look at today’s data.
Consolidation Filter Settings
Configuring the "Consolidation" filter is simple and can be done within the Window Specific Filters Tab of the Configuration Window in your Alert/Top List Window.
Here's how to set up the filter in your configuration window:
-
Adjust the minimum value to 7 to see only stocks with a strong consolidation pattern.
-
Set the maximum value to 3 to see only stocks which have not had any significant consolidation.
The longest consolidation we can report is 40 days. However, these very high numbers mostly report strange and unusual cases. If you are looking at consolidations, you may want to set your maximum to 25 days or lower to see more ordinary patterns.

Using the Consolidation Filter
The "Consolidation" filter can be used in various trading strategies, including:
Range Trading: Traders may choose to buy at support levels and sell at resistance levels within the consolidation range, taking advantage of short-term price fluctuations.
Breakout Trading: Traders may wait for a breakout from the consolidation range and enter positions in the direction of the breakout, anticipating a continuation of the trend.
Volatility Expansion: Consolidation periods are often followed by periods of increased volatility and directional movement. Traders may use consolidation filters to identify stocks poised for significant price moves and adjust their trading strategies accordingly.
FAQs
What is consolidation in stock trading?
- Consolidation refers to a period when the price of a stock trades within a relatively narrow range after experiencing a significant move in either direction. It typically signifies a temporary pause or indecision in the market, as traders reassess the stock's value.
How do I identify consolidation patterns?
- Consolidation patterns can be identified by observing a series of consecutive candlesticks or bars on a price chart with similar high and low values. Additionally, decreasing trading volume during this period often accompanies consolidation.
What causes consolidation in the stock market?
- Consolidation can occur due to various factors, including indecision among market participants, profit-taking after a significant price move, anticipation of future news or events, or a lack of new information impacting the stock.
How long does consolidation typically last?
- The duration of consolidation can vary widely depending on market conditions, the stock's volatility, and other factors. Consolidation periods can last from a few hours to several days or even weeks.
How can I trade during consolidation phases?
- Traders often use consolidation periods to implement range-bound trading strategies, buying near support levels and selling near resistance levels within the consolidation range. Alternatively, traders may wait for a breakout or breakdown from the consolidation range to initiate directional trades.
Filter Info for Consolidation [ConDays]
- description = Consolidation
- keywords = Changes Daily
- units = Days
- format = 0
- toplistable = 1
- parent_code =