


60 Minute Bottoming Tail
Table of Contents
- Understanding the 60 Minute Bottoming Tail Alert
- Default Settings
- Custom Settings
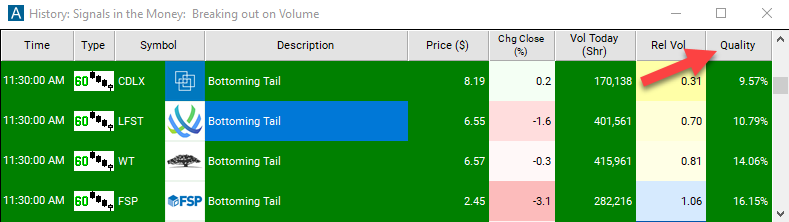
- Description Column
- Quality Column
Understanding the 60 Minute Bottoming Tail Alert
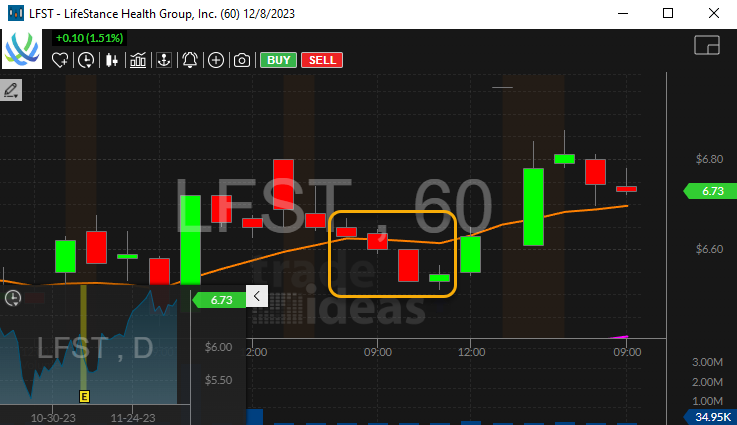
This alert signals the appearance of a bottoming tail pattern on a traditional 60-minute candlestick chart. Components of a bottoming tail pattern include:
-
A small body bullish candle with 3 preceding red or bearish candles
-
The last candle has a small real body (the space between the opening and closing prices), which is often green or white, indicating a bullish candle
-
The lower shadow (or tail) is significantly longer than the upper shadow. The tail typically extends well below the real body
This suggests that after a downtrend, buyers have stepped in to support the price, indicating a shift from bearish to bullish sentiment. In order for this alert to trigger, there must be 3 prededing red candles before the bullish candle.
Default Settings
By default, the 60 minute bottoming tail alert appears when there is a bottoming tail pattern on a 60 minute candlestick chart.
Custom Settings
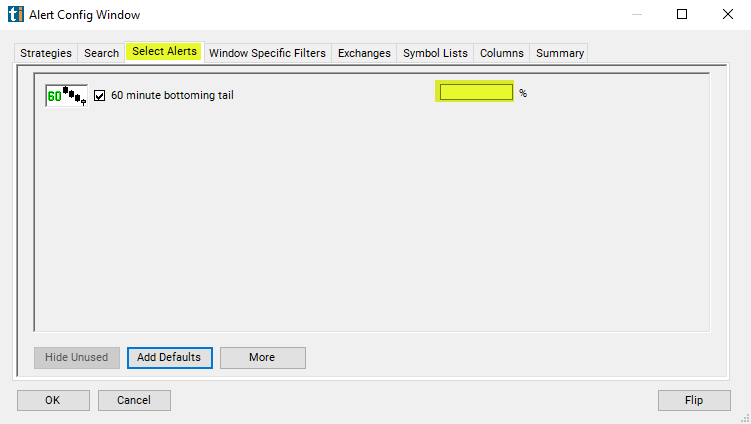
For '60 Minute Bottoming Tail' alerts, you have the option to use an alert specific filter. This filter is located immediately to the right of the corresponding alert and is always optional. You can decide to leave it blank if you want to receive more alerts, or you can fill it in to restrict the number of alerts you receive. This filter allows you to specify the quality of the alert. When you set a higher number for this filter, you are telling the alerts server to display only alerts that meet a higher quality standard, resulting in fewer alerts being shown.
When setting an alert for '60 Minute Bottoming Tail', the user can filter these alerts by a grade of how on how closely the stock chart matches the ideal shape of the stock pattern. 0 would mean there was no match. 100 would mean it's an ideal match.
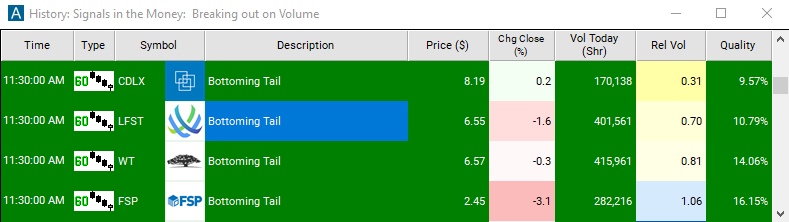
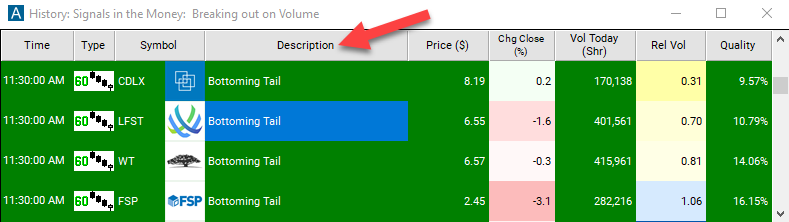
Description Column
The description of the alert will give a more comprehensive breakdown of the alert.
Quality Column
The quality value on a scan using the "60 Minute Bottoming Tail" represents the grade based on how closely the stock chart matches the ideal shape of the stock pattern. 0% would mean that there was no match at all. Of course, if a stock pattern is this poor a match, then we are unlikely to report an alert. 100% would be an ideal match. Again, this would be an ideal and extreme case. Few if any alerts come close to 100%.
Alert Info for 60 Minute Bottoming Tail [BT60]
- description = 60 minute bottoming tail
- direction = +
- keywords = Candle Pattern End Of Candle Fixed Time Frame
- flip_code =
 60 minute topping tail [TT60]
 - parent_code = BT2