


Fibonacci 79% Sell Signal
Table of Contents
- Understanding the Fibonacci 79 Percent Sell Signal Alert
- Default Settings
- Custom Settings
- Description Column
- Quality Column
Understanding the Fibonacci 79 Percent Sell Signal Alert
This alert appears whenever a price rallies 79% of the way back from the low of its daily range. When a price moves in one direction for a certain price interval, then turns around and moves in the other direction, many traders use Fibonacci numbers to determine interesting price levels. When the price gets as far as one of these levels, we generate an alert.
The most common interpretation of this alert is a reversal. The icons and textual descriptions of these alerts are based on this interpretation. When the price goes down through a level, the icon is green, and the text says buy. When the price goes up, the icon is red, and the text says sell. Warning: Trading systems involving Fibonacci levels typically have additional criteria for entering a trade. These alerts tell the trader to take a closer look because the price is at an interesting level. Do not buy or sell only from these alerts. This is a very popular technical indicator, so there are numerous books, websites, classes, etc., describing different ways to trade with Fibonacci.
These are some of our more intricate alerts. There are three interesting points in the pattern. Although the analysis of these points is similar to our other alerts, each point is examined using different levels of confirmation.
-
The point on the far left requires the strongest volume confirmation. This algorithm is similar to the algorithms used to generate our geometric pattern alerts, like the rectangles and the triangles. This ensures that we have enough data to see a meaningful pattern. Note that some of the volume required for confirmation has to happen before the pattern starts. This ensures that the alert always starts with a pivot, and we're not just looking a small part of a larger pattern. The description of each alert starts at the extreme point of the pivot and does not count this extra confirmation.
-
The point in the middle requires volume confirmation similar to the lines we draw for the support and resistance alerts. Once we have established a valid start for the pattern, we do not need as much to recognize the second point. In fact, this gives us more freedom, especially when tracking multiple pairs of support and resistance lines at the same time.
-
The final point requires the least confirmation. No confirmation is required in advance; a single print crossing the Fibonacci level can set off these alerts. However, we examine the trend after reporting the alert. If the trend follows this initial print, we are done. If most of the prints do not cross this threshold, we reset the alert, and look for the price to cross the level again. This is similar to the algorithm we use for the faster versions of our crossed support and resistance alerts.
Each of these alerts can be filtered based on the volume inside the pattern. Like the description, this filter only includes volume starting at the first pivot. We do not include the volume before the pivot, even though it was used in the analysis.
Default Settings
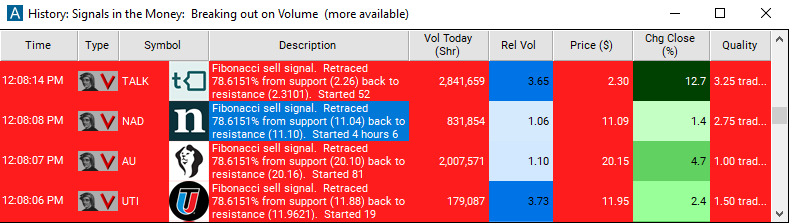
By default, the 'Fibonacci 79% Sell Signal' alert will appear when the price retraces or rallies 79% back up to the resistance level during a downtrend. When the price goes up through this level, the icon is red, and the text says sell.

Custom Settings
For 'Fibonacci 79% Sell Signal' alerts, you have the option to use an alert specific filter. This filter is located immediately to the right of the corresponding alert and is always optional. You can decide to leave it blank if you want to receive more alerts, or you can fill it in to restrict the number of alerts you receive. This filter allows you to specify the quality of the alert. When you set a higher number for this filter, you are telling the alerts server to display only alerts that meet a higher quality standard, resulting in fewer alerts being shown.
When setting an alert for 'Fibonacci 79% Sell Signal', the user can filter the alert by hours traded.
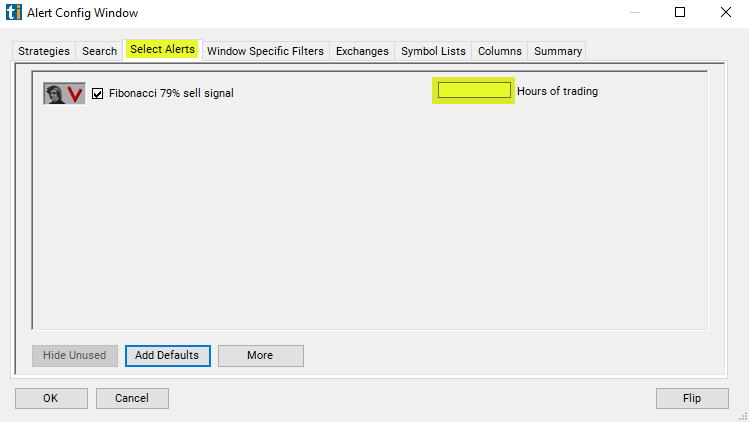
If I see a pattern that lasted from noon yesterday to noon today, is that any better than a pattern that lasted from the open this morning to the close this afternoon? How much better? We weight the pre and post market according to volume. On an average day an average NASDAQ 100 stock will trade roughly 1 hour's worth of volume between the close and the following open. If you want to see stock patterns that lasted for a whole day, a good estimate is 7.5 hours, 6.5 for normal hours plus 1 for the pre and post market.
The same rules apply during the day. If a chart pattern lasts for one hour starting from the open, it will almost always be considered a stronger pattern than if it lasted one hour starting from the beginning of lunch. Hours are just an estimate. Volume is the major factor in this filter. Stocks trading on higher than average volume will satisfy this filter faster than stocks trading on lower than average volume.
Description Column
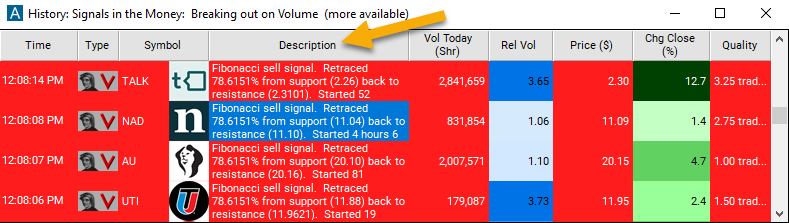
The description of each alert lists the prices that formed the pattern. It also includes the time of when the pattern started.
Quality Column
The quality value on a scan using the 'Fibonacci 79% Sell Signal' alert defines the number of hours since the measured pattern has been established.

Alert Info for Fibonacci 79% Sell Signal [FD79]
- description = Fibonacci 79% sell signal
- direction = -
- keywords = Fibonacci Single Print Support and Resistance
- flip_code =
 Fibonacci 79% buy signal [FU79]
 - parent_code = FU38