


60 Minute 1-2-3 Continuation Buy Signal
Table of Contents
Understanding the 60 Minute 1-2-3 Continuation Buy Signal Alert
The "1-2-3 Continuation Buy Signal" is a frequently observed chart pattern in stock trading that signifies a potential continuation of an existing uptrend. Here is a more detailed breakdown of this pattern:
Pattern Description:
Setup:
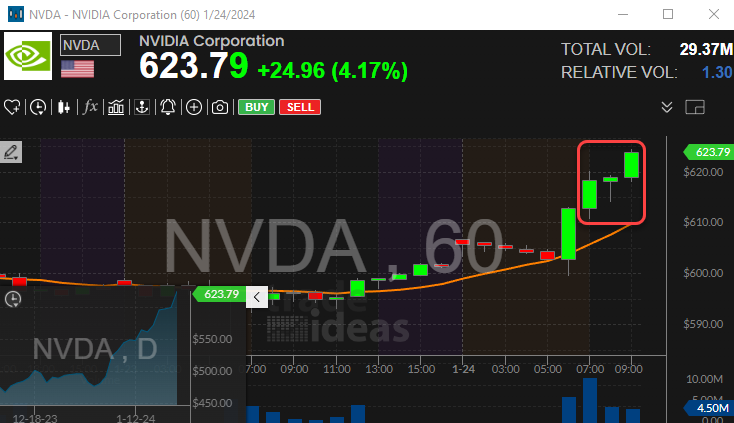
- Bar 1: This initial bar is characterized by a significant upward move, forming a tall green bar. It represents a strong bullish momentum.
- Bar 2: Following Bar 1, Bar 2 is comparatively smaller and often forms a mini-double-top with Bar 1. The smaller size indicates a temporary pause or consolidation within the uptrend.
Pattern Formation:
- Bars 1 and 2 collectively create a visual pattern resembling a mini-double-top, reinforcing the notion of a brief consolidation before a potential continuation of the uptrend.
Trigger Action:
- Buy Signal: Execute a buy order as soon as the price surpasses the highest point reached by Bars 1 and 2. This breakout serves as a confirmation of the potential continuation of the upward movement.
Risk Management:
- Stop-Loss Placement: To manage risk, place a stop-loss order at the lowest point of Bar 2. This strategic placement helps protect against adverse price movements and potential trend reversals.
Interpretation:
- The 1-2-3 Continuation Buy pattern suggests that the market is exhibiting resilience after a brief consolidation, signaling a potential resumption of the uptrend.
- The buy signal is triggered by the breakout above the highest points of Bars 1 and 2, indicating a renewed bullish momentum.
Default Settings
In this pattern formation, a tall green bar is followed by a smaller green bar forming a mini-double-top on a 60 minute candlestick chart. By default, this alert will be triggered as soon as the price surpasses the highest point reached by Bars 1 and 2. To align with each alert, it's essential to utilize the corresponding time frame on the chart. For instance, this alert is visualized on the 60-minute candlestick chart.
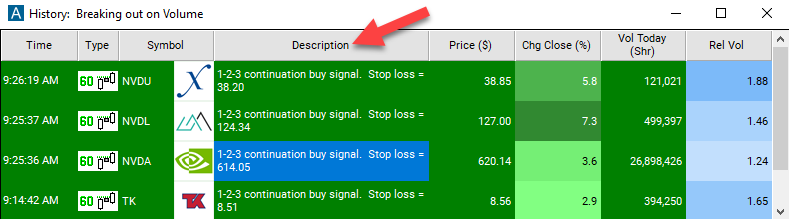
Description Column
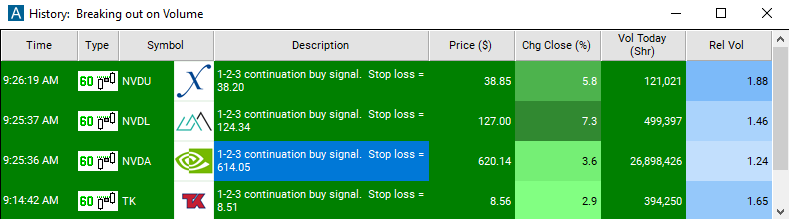
The description column of this scan will display "1-2-3 continuation buy signal", providing you with a clear indication of the specific alert that has been triggered. The description will also guide you on the optimal price to set for your stop-loss order.
Alert Info for 60 Minute 1-2-3 Continuation Buy Signal [C1U_60]
- description = 60 minute 1-2-3 continuation buy signal
- direction = +
- keywords = Candle Pattern Single Print Fixed Time Frame
- flip_code =
 60 minute 1-2-3 continuation sell signal [C1D_60]
 - parent_code = C1U_2