


60 Minute MACD Crossed Above Zero
Table of Contents
Understanding the 60 Minute MACD Crossed Above Zero Alert
The "MACD Crossed Above Zero" alert in trading occurs when the MACD Line (Moving Average Convergence Divergence) crosses above the zero line on the MACD histogram. This event is considered a bullish signal and is interpreted as a potential shift from a bearish to a bullish trend.
Here's how traders interpret and use the "MACD Crossed Above Zero" alert:
Definition of MACD Crossed Above Zero:
- The MACD Line is the difference between the 12-period and 26-period Exponential Moving Averages (EMAs).
- The zero line on the MACD histogram represents the point at which the MACD Line is equal to the Signal Line (9-period EMA of MACD).
Bullish Signal:
- When the MACD Line crosses above the zero line, it signals that the short-term average (12-period EMA) has moved above the longer-term average (26-period EMA). This is considered a bullish signal, suggesting a potential shift in momentum from bearish to bullish.
Confirmation of Uptrend Strength:
- The crossing of the MACD Line above zero is seen as confirmation that the bullish momentum is strengthening. It implies that the recent price movements are strong enough to propel the shorter-term trend above the longer-term trend.
Potential Buy Signal: -Traders often interpret the "MACD Crossed Above Zero" as a potential buy signal. It suggests that conditions may be favorable for entering long positions or buying the asset.
Consideration of Other Indicators: -While the "MACD Crossed Above Zero" alert is bullish, traders may consider confirming signals from other technical indicators or chart patterns before making trading decisions. Additional confirmation can increase the reliability of the signal.
Adaptability to Different Timeframes: -The "MACD Crossed Above Zero" alert is applicable across various timeframes, making it adaptable for different trading styles and investment horizons.
Risk Management: -Traders should implement proper risk management strategies, including setting stop-loss orders and considering overall portfolio risk, to mitigate potential losses if the market does not follow the expected bullish trajectory.
These alerts implement the traditional MACD (Moving Average Convergence Divergence) formula. You can get a notification as soon as the MACD line crosses above or below the zero line. You can select the timeframe. These alerts are based on the standard 26, 12, and 9 period EMAs. These alerts report as soon as the value crosses, without waiting for the end of the candle.
Note: because the MACD is based on the EMA (exponential moving average) formula, it is not deterministic. Different charting packages will give slightly different values for the formula. If you add more history to your chart, it might also change the result. These values are generally similar, but they won't be exactly the same.
Default Settings
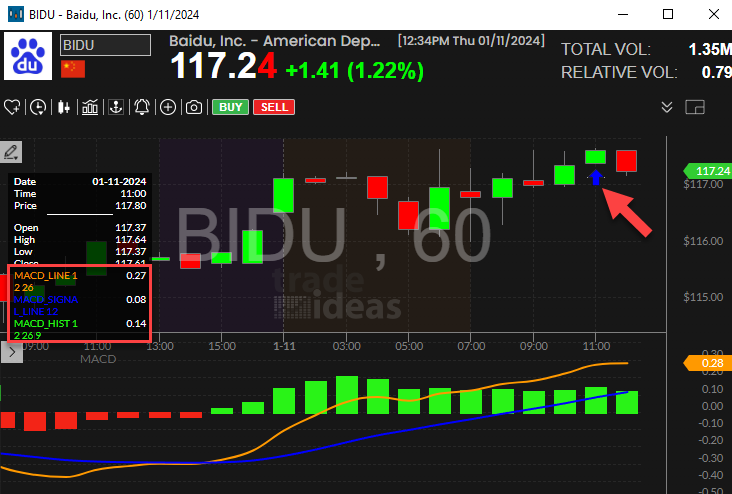
By default, this alert is triggered when the MACD crosses above zero on a 60 minute timeframe. To align with each alert, it's essential to utilize the corresponding time frame on the chart. For instance, this alert is visualized on the 60-minute candlestick chart.
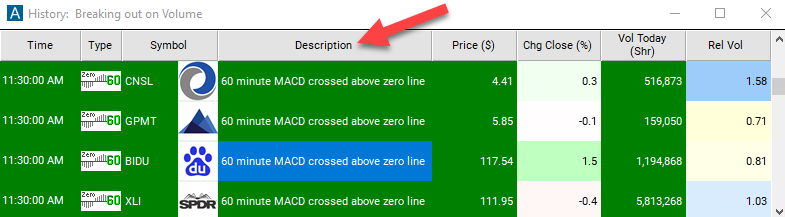
Description Column
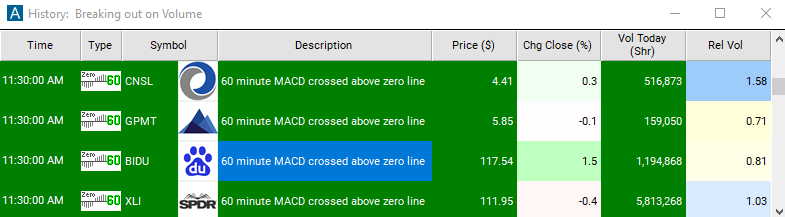
The description column of this scan will display "60 Minute MACD Crossed Above Zero", providing you with a clear indication of the specific alert that has been triggered.
Alert Info for 60 Minute MACD Crossed Above Zero [MDAZ60]
- description = 60 minute MACD crossed above zero
- direction = +
- keywords = Single Print Fixed Time Frame
- flip_code =
 60 minute MACD crossed below zero [MDBZ60]
 - parent_code = MDAS5