


5 Minute MACD Crossed Above Signal
Table of Contents
Understanding the 5 Minute MACD Crossed Above Signal Alert
The Moving Average Convergence Divergence (MACD) is a popular and versatile technical indicator used in stock trading and financial markets to analyze trends, momentum, and potential buy or sell signals. The MACD consists of three main components:
MACD Line (Fast Line): This is the difference between the 12-period Exponential Moving Average (EMA) and the 26-period EMA. The MACD Line represents the short-term momentum of a security.
Signal Line (Slow Line): The Signal Line is a 9-period EMA of the MACD Line. It acts as a smoothing mechanism for the MACD Line and is often used as a trigger for buy or sell signals.
MACD Histogram: The MACD Histogram is the visual representation of the difference between the MACD Line and the Signal Line. It helps traders identify the strength and direction of the momentum.
Here's how traders interpret and use the MACD:
MACD Crossovers:
- When the MACD Line crosses above the Signal Line, it generates a bullish signal, suggesting potential upward momentum.
Histogram Analysis:
- The histogram's height represents the difference between the MACD Line and the Signal Line. Positive histogram values indicate bullish momentum, while negative values indicate bearish momentum.
Divergence:
- Divergence occurs when the price of the security moves in the opposite direction of the MACD. Bullish divergence happens when the price makes lower lows, but the MACD makes higher lows, suggesting a potential reversal to the upside.
Overbought and Oversold Conditions:
- Some traders use the MACD to identify overbought or oversold conditions. Extremely high or low MACD values may suggest that a security is overextended and due for a potential reversal.
These alerts implement the traditional MACD (Moving Average Convergence Divergence) formula. You can get a notification as soon as the MACD line crosses above or below the zero line or the signal line. You can select the timeframe. These alerts are based on the standard 26, 12, and 9 period EMAs. These alerts report as soon as the value crosses, without waiting for the end of the candle.
Note: because the MACD is based on the EMA (exponential moving average) formula, it is not deterministic. Different charting packages will give slightly different values for the formula. If you add more history to your chart, it might also change the result. These values are generally similar, but they won't be exactly the same.
Default Settings
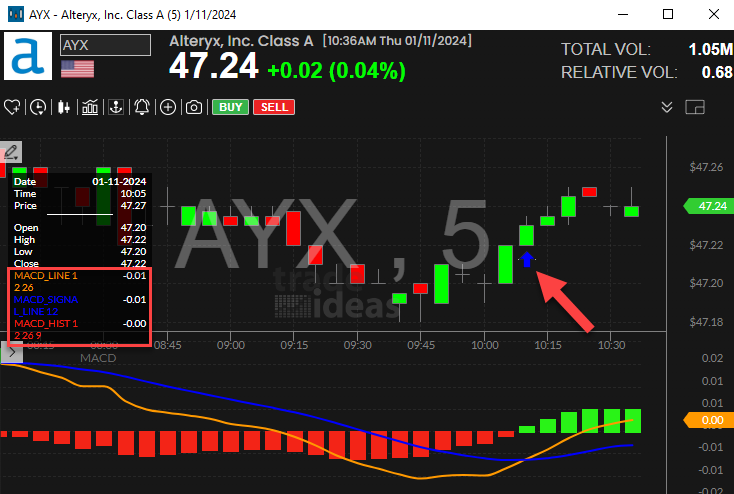
By default, this alert is triggered when the MACD crosses above the signal line on a 5 minute timeframe. To align with each alert, it's essential to utilize the corresponding time frame on the chart. For instance, this alert is visualized on the 5-minute candlestick chart.
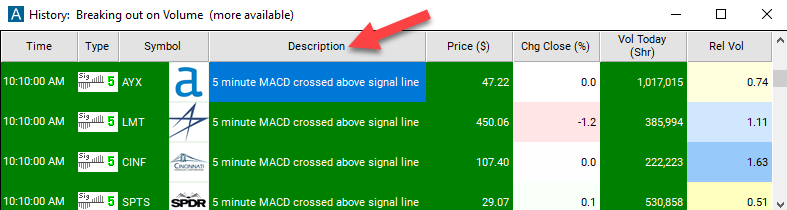
Description Column
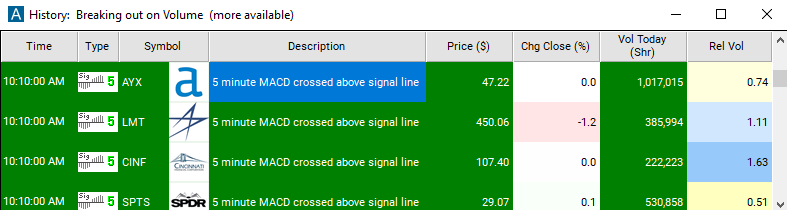
The description column of this scan will display "5 Minute MACD Crossed Above Signal Line", providing you with a clear indication of the specific alert that has been triggered.
Alert Info for 5 Minute MACD Crossed Above Signal [MDAS5]
- description = 5 minute MACD crossed above signal
- direction = +
- keywords = Single Print Fixed Time Frame
- flip_code =
 5 minute MACD crossed below signal [MDBS5]
 - parent_code =
Related Codes
- 5 minute MACD crossed below signal [MDBS5]
 5 minute MACD crossed above zero [MDAZ5]
 5 minute MACD crossed below zero [MDBZ5]
 10 minute MACD crossed above signal [MDAS10]
 10 minute MACD crossed below signal [MDBS10]
 10 minute MACD crossed above zero [MDAZ10]
 10 minute MACD crossed below zero [MDBZ10]
 15 minute MACD crossed above signal [MDAS15]
 15 minute MACD crossed below signal [MDBS15]
 15 minute MACD crossed above zero [MDAZ15]
 15 minute MACD crossed below zero [MDBZ15]
 30 minute MACD crossed above signal [MDAS30]
 30 minute MACD crossed below signal [MDBS30]
 30 minute MACD crossed above zero [MDAZ30]
 30 minute MACD crossed below zero [MDBZ30]
 60 minute MACD crossed above signal [MDAS60]
 60 minute MACD crossed below signal [MDBS60]
 60 minute MACD crossed above zero [MDAZ60]
 60 minute MACD crossed below zero [MDBZ60]