


Crossed Above 50 Day Moving Average
Table of Contents
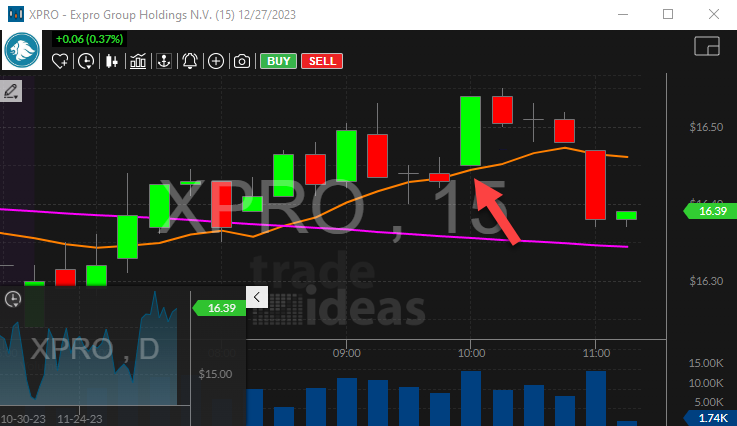
Understanding the Crossed Above 50 Day Moving Average Alert
Simple Moving Average (SMA) is a commonly used technical indicator that helps smooth out price data to identify trends over a specified period of time. The SMA is calculated by taking the average price of a security over a set number of periods, dividing the sum by the number of periods. The 50-period moving average is a widely used technical indicator in trading and investing. Its primary benefits include:
Trend Identification: The 50MA helps traders and investors identify the overall trend in a stock or market. If the current price is consistently above the 50MA, it may indicate an uptrend, while a price consistently below the 50MA may suggest a downtrend.
Smoothing Price Data: Moving averages, including the 50MA, smooth out price data, reducing noise and making it easier to visualize the underlying trend. This smoothing effect helps traders filter out short-term fluctuations and focus on the broader market direction.
Support and Resistance Levels: The 50MA can act as a dynamic support or resistance level. In an uptrend, the price often finds support around the 50MA, and in a downtrend, it may face resistance. Traders use these levels to make decisions about entering or exiting positions.
Confirmation of Trends: Crosses of the price over or under the 50MA can be used as signals to confirm trends. For example, a price crossing above the 50MA might be considered a bullish signal, suggesting potential upward momentum.
Reversal Indication: Changes in the relationship between the price and the 50MA can indicate potential reversals. For instance, if a stock that was in a downtrend crosses above its 50MA, it may signal a potential reversal to an uptrend.
Reference Point for Traders: Many traders use the 50MA as a reference point when developing trading strategies. It serves as a common and widely watched indicator, providing a shared reference for market participants.
The alert listed here requires statistical confirmation before it appears. This filters out noise, but requires a slight delay. This analysis involves price, time, and volume. If the price continues to move around the 50 day moving average, this alert may never appear. Once the price chooses a direction the exact amount of time required for the alert to appear depends on volume. The statistical analysis does not require that every print cross the 50 day moving average before the alert is displayed. The analysis filters out insignificant prints that go against the general trend. It is even possible, although unlikely, that the last print disagrees with the analysis as a whole.
Default Settings
By default, the Crossed Above 50 Day Moving Average alert appears when the price of a stock crosses above its 50 day moving average with sufficient volume.
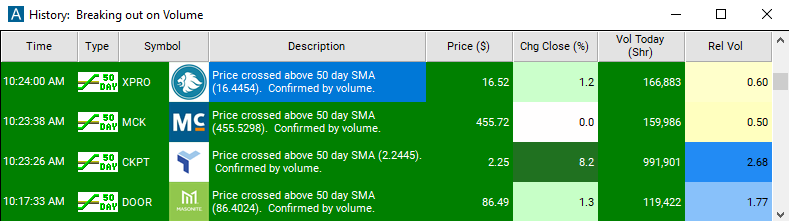
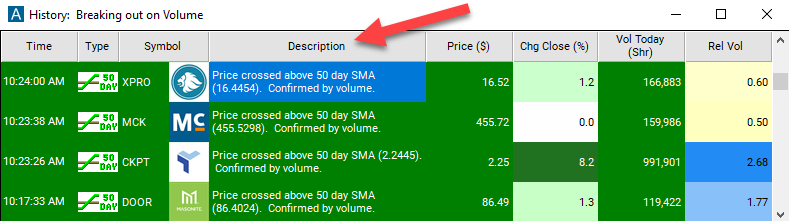
Description Column
The description column will report at which price the stock crossed its moving average.
Alert Info for Crossed Above 50 Day Moving Average [CA50]
- description = Crossed above 50 day moving average
- direction = +
- keywords = Moving Average Volume Confirmed
- flip_code =
 Crossed below 50 day moving average [CB50]
 - parent_code = CA200