







Alert & Filter Category
Moving Average Crossover Alerts and Filters
20, 50 and 200 Day and Intraday SMA
Find stocks crossing above or below the 20, 50 or 200 day moving average, intraday 5/8, 8/20 and 20/200 period SMA crossovers, and stocks trading a set distance above or below a moving average, with Trade Ideas Streaming Alerts (Scanner) and Top Lists (Screeners).
Every setup in this group, in real time.
Free account, just an email. No card. Live access for a limited time. See plans & pricing.
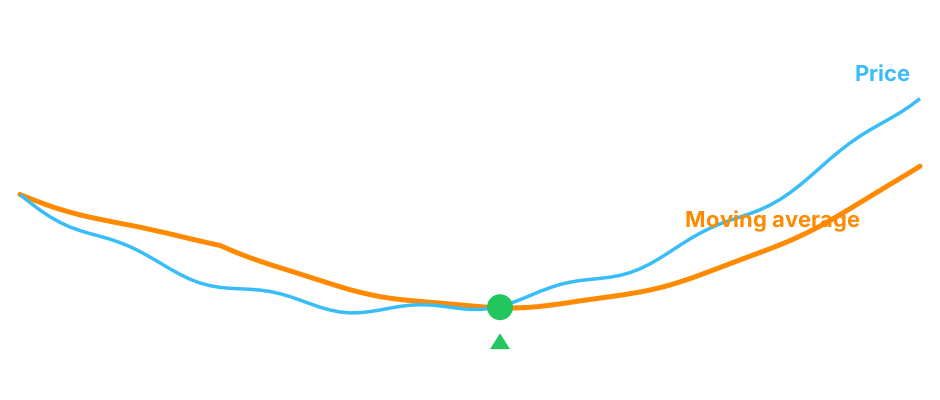
Stocks crossing their moving averages.
Key point
Searching for a moving average crossover scanner or a 200 day moving average screener? In Trade Ideas, this is Streaming Alerts: the cross alerts fire on the cross, and the distance filters keep only stocks on the side of the average you want.
Streaming Alerts push each alert the moment it fires, the Moving Average filters are checked at that same moment, and Top Lists can sort by them.
Settings
A moving average smooths price over a set number of days or candles; traders watch for price, or a faster average, crossing it. The Moving Average category holds the daily SMA cross alerts (20, 50 and 200 day), intraday period SMA crossovers and thrusts, and filters that measure how far price sits from a daily or intraday SMA.
How Trade Ideas finds it: Crossed Above 200 Day Moving Average Alert (CA200): by default, the Crossed Above 200 Day Moving Average alert appears when the price of a stock crosses above its 200 day moving average with sufficient volume. Change From 200 Day SMA (%) Filter (MA200P): set the min value to 1 to see only stocks that are performing better than their long-term SMA.
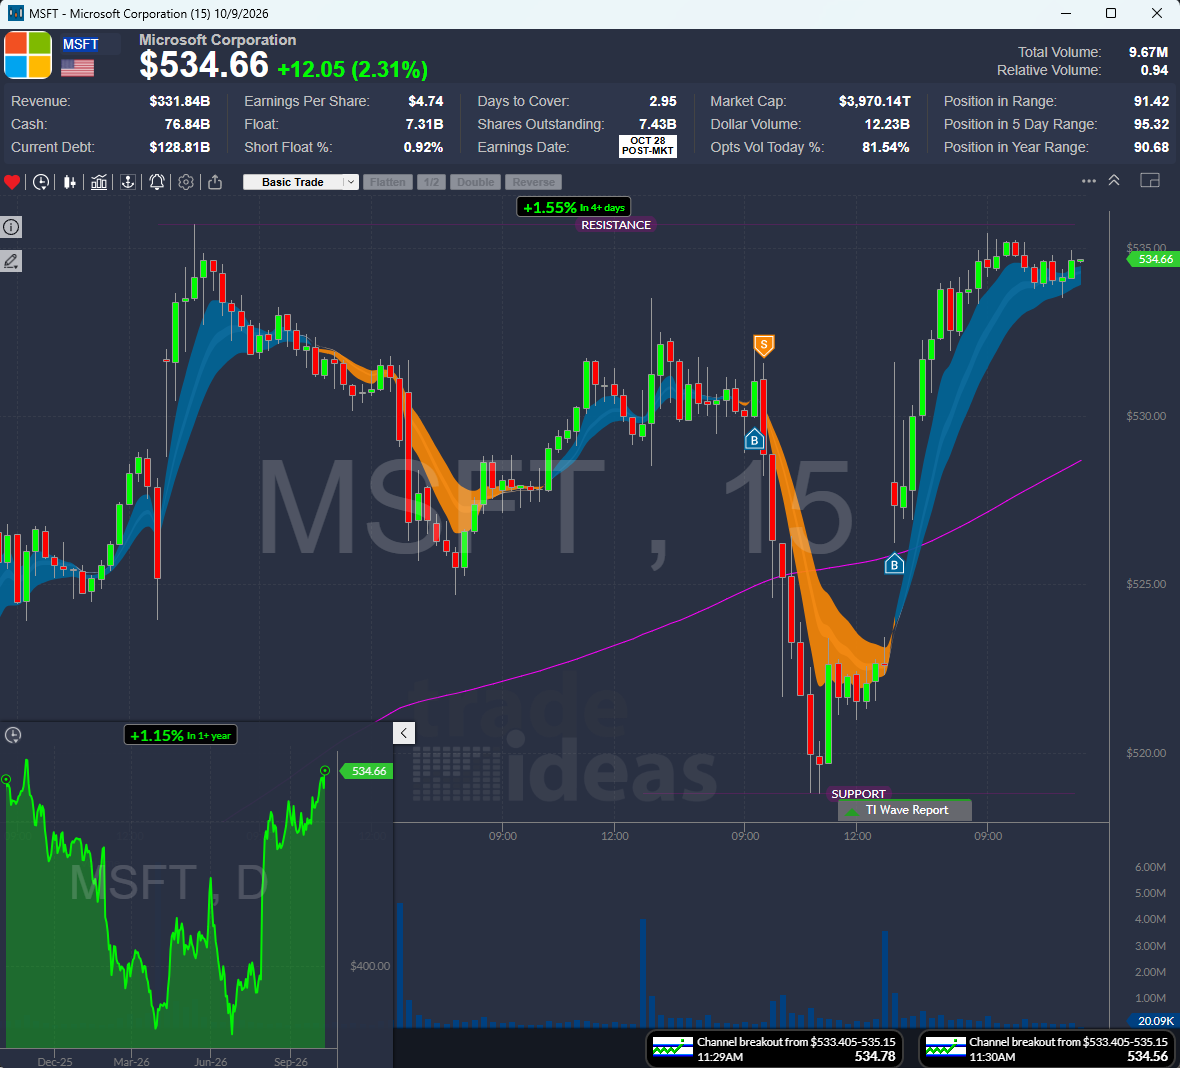
Find moving average crosses in real time
Stocks crossing above or below the 200, 50 or 20 day moving average
Daily moving average crosses, with volume. Find stocks crossing above their 200-day moving average intraday, with volume confirmation. CA200 fires during the session, not at tomorrow's close.
Alerts: Crossed Above 200 Day Moving Average Alert (CA200) Crossed Below 200 Day Moving Average Alert (CB200) Crossed Above 50 Day Moving Average Alert (CA50) Crossed Below 50 Day Moving Average Alert (CB50) Crossed Above 20 Day Moving Average Alert (CA20) Crossed Below 20 Day Moving Average Alert (CB20)
Stocks above or below the 200 day moving average (filters)
Distance from daily SMAs, in percent or bars. Find stocks trading above or below their 200-day moving average, in percent. Positive = above the 200-day SMA; negative = below. See them as they move.
Filters: Change From 200 Day SMA (%) Filter (MA200P) Change From 200 Day SMA (Bars) Filter (MA200R) 200 Day SMA Filter (SMA200) Change From 50 Day SMA (%) Filter (MA50P) Change From 50 Day SMA (Bars) Filter (MA50R) Change From 20 Day SMA (%) Filter (MA20P) Change From 20 Day SMA (Bars) Filter (MA20R) Change From 10 Day SMA (%) Filter (MA10P) Change From 10 Day SMA (Bars) Filter (MA10R) Change From 8 Day SMA (%) Filter (MA8P) Change From 8 Day SMA (Bars) Filter (MA8R)
Intraday SMA crossovers: 5/8, 8/20 and 20/200 period
Crosses on 1 to 30 minute charts. How Trade Ideas finds it: on the 8 Period SMA Crossed Above 20 Period SMA (5 Minute) Alert (ECAY5) page, by default, this alert is triggered when the 8 period SMA crosses above the 20 period SMA in a 5 minute timeframe.
Alerts: 5 Period SMA Crossed Above 8 Period SMA (1 Minute) Alert (X5A8_1) 5 Period SMA Crossed Below 8 Period SMA (1 Minute) Alert (X5B8_1) 5 Period SMA Crossed Above 8 Period SMA (2 Minute) Alert (X5A8_2) 5 Period SMA Crossed Below 8 Period SMA (2 Minute) Alert (X5B8_2) 5 Period SMA Crossed Above 8 Period SMA (4 Minute) Alert (X5A8_4) 5 Period SMA Crossed Below 8 Period SMA (4 Minute) Alert (X5B8_4) 5 Period SMA Crossed Above 8 Period SMA (5 Minute) Alert (X5A8_5) 5 Period SMA Crossed Below 8 Period SMA (5 Minute) Alert (X5B8_5) 5 Period SMA Crossed Above 8 Period SMA (10 Minute) Alert (X5A8_10) 5 Period SMA Crossed Below 8 Period SMA (10 Minute) Alert (X5B8_10) 5 Period SMA Crossed Above 8 Period SMA (20 Minute) Alert (X5A8_20) 5 Period SMA Crossed Below 8 Period SMA (20 Minute) Alert (X5B8_20) 5 Period SMA Crossed Above 8 Period SMA (30 Minute) Alert (X5A8_30) 5 Period SMA Crossed Below 8 Period SMA (30 Minute) Alert (X5B8_30) 8 Period SMA Crossed Above 20 Period SMA (2 Minute) Alert (ECAY2) 8 Period SMA Crossed Below 20 Period SMA (2 Minute) Alert (ECBY2) 8 Period SMA Crossed Above 20 Period SMA (5 Minute) Alert (ECAY5) 8 Period SMA Crossed Below 20 Period SMA (5 Minute) Alert (ECBY5) 8 Period SMA Crossed Above 20 Period SMA (15 Minute) Alert (ECAY15) 8 Period SMA Crossed Below 20 Period SMA (15 Minute) Alert (ECBY15) 20 Period SMA Crossed Above 200 Period SMA (2 Minute) Alert (YCAD2) 20 Period SMA Crossed Below 200 Period SMA (2 Minute) Alert (YCBD2) 20 Period SMA Crossed Above 200 Period SMA (5 Minute) Alert (YCAD5) 20 Period SMA Crossed Below 200 Period SMA (5 Minute) Alert (YCBD5) 20 Period SMA Crossed Above 200 Period SMA (15 Minute) Alert (YCAD15) 20 Period SMA Crossed Below 200 Period SMA (15 Minute) Alert (YCBD15)
Upward and downward thrusts
Both SMAs moving the same way. How Trade Ideas finds it: on the Upward Thrust (2 Minute) Alert (SMAU2) page, by default, Upward Thrust (2 Minute) alert appears when a stock's 8 period SMA and its 20 period SMA have both been going up for each of the last 5 periods.
Alerts: Upward Thrust (2 Minute) Alert (SMAU2) Downward Thrust (2 Minute) Alert (SMAD2) Upward Thrust (5 Minute) Alert (SMAU5) Downward Thrust (5 Minute) Alert (SMAD5) Upward Thrust (15 Minute) Alert (SMAU15) Downward Thrust (15 Minute) Alert (SMAD15)
Stocks above or below an intraday SMA (filters)
Settings
Distance from 5 to 200 period SMAs on 2 to 60 minute charts. How Trade Ideas finds it: on the Change From 20 Period SMA (5 min) Filter (5SmaLa20) page, adjust the minimum value to 1 to filter for stocks currently positioned above their 20-period SMA on a 5-minute chart. Set the maximum value to -1 to focus on stocks currently below their 20-period SMA on a 5-minute chart.
Filters: Change From 5 Period SMA (2 min) Filter (2SmaLa5) Change From 5 Period SMA (5 min) Filter (5SmaLa5) Change From 5 Period SMA (15 min) Filter (15SmaLa5) Change From 8 Period SMA (2 min) Filter (2SmaLa8) Change From 8 Period SMA (5 min) Filter (5SmaLa8) Change From 8 Period SMA (15 min) Filter (15SmaLa8) Change From 8 Period SMA (60 min) Filter (60SmaLa8) Change From 10 Period SMA (2 min) Filter (2SmaLa10) Change From 10 Period SMA (5 min) Filter (5SmaLa10) Change From 10 Period SMA (15 min) Filter (15SmaLa10) Change From 10 Period SMA (60 min) Filter (60SmaLa10) Change From 20 Period SMA (2 min) Filter (2SmaLa20) Change From 20 Period SMA (5 min) Filter (5SmaLa20) Change From 20 Period SMA (15 min) Filter (15SmaLa20) Change From 20 Period SMA (60 min) Filter (60SmaLa20) Change From 200 Period SMA (2 min) Filter (2SmaLa200) Change From 200 Period SMA (5 min) Filter (5SmaLa200) Change From 130 Period SMA (15 min) Filter (15SmaLa130) Change From 200 Period SMA (15 min) Filter (15SmaLa200) Change From 200 Period SMA (60 min) Filter (60SmaLa200) 8 vs. 20 Period SMA (2 min) Filter (2Sma8a20) 8 vs. 20 Period SMA (5 min) Filter (5Sma8a20) 8 vs. 20 Period SMA (15 min) Filter (15Sma8a20) 8 vs. 20 Period SMA (60 min) Filter (60Sma8a20) 20 vs. 200 Period SMA (2 min) Filter (2Sma20a200) 20 vs. 200 Period SMA (5 min) Filter (5Sma20a200) 20 vs. 200 Period SMA (15 min) Filter (15Sma20a200) 20 vs. 200 Period SMA (60 min) Filter (60Sma20a200)
All 77 Moving Average alerts and filters
Moving Average alerts
Crossed above 200 day moving average
- Crossed Above 200 Day Moving Average Alert (CA200): Find stocks crossing above their 200-day moving average intraday, with volume confirmation. CA200 fires during the session, not at tomorrow's close.
Crossed below 200 day moving average
- Crossed Below 200 Day Moving Average Alert (CB200): Find stocks crossing below their 200-day moving average intraday, with volume confirmation. CB200 fires during the session, not at tomorrow's close.
Crossed above 50 day moving average
- Crossed Above 50 Day Moving Average Alert (CA50): Find stocks crossing above their 50-day moving average intraday, with volume confirmation. CA50 fires during the session, not at tomorrow's close.
Crossed below 50 day moving average
- Crossed Below 50 Day Moving Average Alert (CB50): Find stocks crossing below their 50-day moving average intraday, with volume confirmation. CB50 fires during the session, not at tomorrow's close.
Crossed above 20 day moving average
- Crossed Above 20 Day Moving Average Alert (CA20): Find stocks crossing above their 20-day moving average intraday, with volume confirmation. CA20 fires during the session, not at tomorrow's close.
Crossed below 20 day moving average
- Crossed Below 20 Day Moving Average Alert (CB20): Find stocks crossing below their 20-day moving average intraday, with volume confirmation. CB20 fires during the session, not at tomorrow's close.
Upward thrust (3)
- Upward Thrust (2 Minute) Alert (SMAU2): Find stocks in a 2-minute upward thrust: 8 and 20 period SMAs both rising for 5 straight bars. SMAU2, as it happens. Live in Trade Ideas Streaming Alerts.
- Upward Thrust (5 Minute) Alert (SMAU5): Find stocks in a 5-minute upward thrust: 8 and 20 period SMAs both rising for 5 straight bars. SMAU5, as it happens. Live in Trade Ideas Streaming Alerts.
- Upward Thrust (15 Minute) Alert (SMAU15): Find stocks in a 15-minute upward thrust: 8 and 20 period SMAs both rising for 5 straight bars. SMAU15, as it happens. Live in Trade Ideas Streaming Alerts.
Downward thrust (3)
- Downward Thrust (2 Minute) Alert (SMAD2): Find stocks in a 2-minute downward thrust: 8 and 20 period SMAs both falling for 5 straight bars. SMAD2, as it happens. Live in Trade Ideas Streaming Alerts.
- Downward Thrust (5 Minute) Alert (SMAD5): Find stocks in a 5-minute downward thrust: 8 and 20 period SMAs both falling for 5 straight bars. SMAD5, as it happens. Live in Trade Ideas Streaming Alerts.
- Downward Thrust (15 Minute) Alert (SMAD15): Find stocks in a 15-minute downward thrust: 8 and 20 period SMAs both falling for 5 straight bars. SMAD15, as it happens.
5 period SMA crossed above 8 period SMA (7)
- 5 Period SMA Crossed Above 8 Period SMA (1 Minute) Alert (X5A8_1): Find bullish 5/8 SMA crossovers on the 1-minute chart as they happen. X5A8_1 fires when the 5 period SMA crosses above the 8.
- 5 Period SMA Crossed Above 8 Period SMA (2 Minute) Alert (X5A8_2): Find bullish 5/8 SMA crossovers on the 2-minute chart as they happen. X5A8_2 fires when the 5 period SMA crosses above the 8.
- 5 Period SMA Crossed Above 8 Period SMA (4 Minute) Alert (X5A8_4): Find bullish 5/8 SMA crossovers on the 4-minute chart as they happen. X5A8_4 fires when the 5 period SMA crosses above the 8.
- 5 Period SMA Crossed Above 8 Period SMA (5 Minute) Alert (X5A8_5): Find bullish 5/8 SMA crossovers on the 5-minute chart as they happen. X5A8_5 fires when the 5 period SMA crosses above the 8.
- 5 Period SMA Crossed Above 8 Period SMA (10 Minute) Alert (X5A8_10): Find bullish 5/8 SMA crossovers on the 10-minute chart as they happen. X5A8_10 fires when the 5 period SMA crosses above the 8.
- 5 Period SMA Crossed Above 8 Period SMA (20 Minute) Alert (X5A8_20): Find bullish 5/8 SMA crossovers on the 20-minute chart as they happen. X5A8_20 fires when the 5 period SMA crosses above the 8.
- 5 Period SMA Crossed Above 8 Period SMA (30 Minute) Alert (X5A8_30): Find bullish 5/8 SMA crossovers on the 30-minute chart as they happen. X5A8_30 fires when the 5 period SMA crosses above the 8.
5 period SMA crossed below 8 period SMA (7)
- 5 Period SMA Crossed Below 8 Period SMA (1 Minute) Alert (X5B8_1): Find bearish 5/8 SMA crossovers on the 1-minute chart as they happen. X5B8_1 fires when the 5 period SMA crosses below the 8.
- 5 Period SMA Crossed Below 8 Period SMA (2 Minute) Alert (X5B8_2): Find bearish 5/8 SMA crossovers on the 2-minute chart as they happen. X5B8_2 fires when the 5 period SMA crosses below the 8.
- 5 Period SMA Crossed Below 8 Period SMA (4 Minute) Alert (X5B8_4): Find bearish 5/8 SMA crossovers on the 4-minute chart as they happen. X5B8_4 fires when the 5 period SMA crosses below the 8.
- 5 Period SMA Crossed Below 8 Period SMA (5 Minute) Alert (X5B8_5): Find bearish 5/8 SMA crossovers on the 5-minute chart as they happen. X5B8_5 fires when the 5 period SMA crosses below the 8.
- 5 Period SMA Crossed Below 8 Period SMA (10 Minute) Alert (X5B8_10): Find bearish 5/8 SMA crossovers on the 10-minute chart as they happen. X5B8_10 fires when the 5 period SMA crosses below the 8.
- 5 Period SMA Crossed Below 8 Period SMA (20 Minute) Alert (X5B8_20): Find bearish 5/8 SMA crossovers on the 20-minute chart as they happen. X5B8_20 fires when the 5 period SMA crosses below the 8.
- 5 Period SMA Crossed Below 8 Period SMA (30 Minute) Alert (X5B8_30): Find bearish 5/8 SMA crossovers on the 30-minute chart as they happen. X5B8_30 fires when the 5 period SMA crosses below the 8.
8 period SMA crossed above 20 period SMA (3)
- 8 Period SMA Crossed Above 20 Period SMA (2 Minute) Alert (ECAY2): Find bullish 8/20 SMA crossovers on the 2-minute chart as they happen. ECAY2 fires when the 8 period SMA crosses above the 20.
- 8 Period SMA Crossed Above 20 Period SMA (5 Minute) Alert (ECAY5): Find bullish 8/20 SMA crossovers on the 5-minute chart as they happen. ECAY5 fires when the 8 period SMA crosses above the 20.
- 8 Period SMA Crossed Above 20 Period SMA (15 Minute) Alert (ECAY15): Find bullish 8/20 SMA crossovers on the 15-minute chart as they happen. ECAY15 fires when the 8 period SMA crosses above the 20.
8 period SMA crossed below 20 period SMA (3)
- 8 Period SMA Crossed Below 20 Period SMA (2 Minute) Alert (ECBY2): Find bearish 8/20 SMA crossovers on the 2-minute chart as they happen. ECBY2 fires when the 8 period SMA crosses below the 20.
- 8 Period SMA Crossed Below 20 Period SMA (5 Minute) Alert (ECBY5): Find bearish 8/20 SMA crossovers on the 5-minute chart as they happen. ECBY5 fires when the 8 period SMA crosses below the 20.
- 8 Period SMA Crossed Below 20 Period SMA (15 Minute) Alert (ECBY15): Find bearish 8/20 SMA crossovers on the 15-minute chart as they happen. ECBY15 fires when the 8 period SMA crosses below the 20.
20 period SMA crossed above 200 period SMA (3)
- 20 Period SMA Crossed Above 200 Period SMA (2 Minute) Alert (YCAD2): Find bullish 20/200 SMA crossovers on the 2-minute chart as they happen. YCAD2 fires when the 20 period SMA crosses above the 200.
- 20 Period SMA Crossed Above 200 Period SMA (5 Minute) Alert (YCAD5): Find bullish 20/200 SMA crossovers on the 5-minute chart as they happen. YCAD5 fires when the 20 period SMA crosses above the 200.
- 20 Period SMA Crossed Above 200 Period SMA (15 Minute) Alert (YCAD15): Find bullish 20/200 SMA crossovers on the 15-minute chart as they happen. YCAD15 fires when the 20 period SMA crosses above the 200.
20 period SMA crossed below 200 period SMA (3)
- 20 Period SMA Crossed Below 200 Period SMA (2 Minute) Alert (YCBD2): Find bearish 20/200 SMA crossovers on the 2-minute chart as they happen. YCBD2 fires when the 20 period SMA crosses below the 200.
- 20 Period SMA Crossed Below 200 Period SMA (5 Minute) Alert (YCBD5): Find bearish 20/200 SMA crossovers on the 5-minute chart as they happen. YCBD5 fires when the 20 period SMA crosses below the 200.
- 20 Period SMA Crossed Below 200 Period SMA (15 Minute) Alert (YCBD15): Find bearish 20/200 SMA crossovers on the 15-minute chart as they happen. YCBD15 fires when the 20 period SMA crosses below the 200.
Moving Average filters
Change from 200 Day SMA (2)
- Change From 200 Day SMA (%) Filter (MA200P): Find stocks trading above or below their 200-day moving average, in percent. Positive = above the 200-day SMA; negative = below. See them as they move.
- Change From 200 Day SMA (Bars) Filter (MA200R): Find stocks trading above or below their 200-day moving average, in volatility-adjusted bars. Positive = above the 200-day SMA; negative = below.
200 Day SMA
- 200 Day SMA Filter (SMA200): Get each stock's 200-day simple moving average in dollars, as of the previous day, and filter by it, such as a 200-day SMA between $100 and $150.
Change from 50 Day SMA (2)
- Change From 50 Day SMA (%) Filter (MA50P): Find stocks trading above or below their 50-day moving average, in percent. Positive = above the 50-day SMA; negative = below. See them as they move.
- Change From 50 Day SMA (Bars) Filter (MA50R): Find stocks trading above or below their 50-day moving average, in volatility-adjusted bars. Positive = above the 50-day SMA; negative = below.
Change from 20 Day SMA (2)
- Change From 20 Day SMA (%) Filter (MA20P): Find stocks trading above or below their 20-day moving average, in percent. Positive = above the 20-day SMA; negative = below. See them as they move.
- Change From 20 Day SMA (Bars) Filter (MA20R): Find stocks trading above or below their 20-day moving average, in volatility-adjusted bars. Positive = above the 20-day SMA; negative = below.
Change from 10 Day SMA (2)
- Change From 10 Day SMA (%) Filter (MA10P): Find stocks trading above or below their 10-day moving average, in percent. Positive = above the 10-day SMA; negative = below. See them as they move.
- Change From 10 Day SMA (Bars) Filter (MA10R): Find stocks trading above or below their 10-day moving average, in volatility-adjusted bars. Positive = above the 10-day SMA; negative = below.
Change from 8 Day SMA (2)
- Change From 8 Day SMA (%) Filter (MA8P): Find stocks trading above or below their 8-day moving average, in percent. Positive = above the 8-day SMA; negative = below. See them as they move.
- Change From 8 Day SMA (Bars) Filter (MA8R): Find stocks trading above or below their 8-day moving average, in volatility-adjusted bars. Positive = above the 8-day SMA; negative = below.
Change from 5 Period SMA (3)
- Change From 5 Period SMA (2 min) Filter (2SmaLa5): Find stocks trading above or below the 5-period SMA on the 2-minute chart, in percent. Min 1 = above the average; max -1 = below it.
- Change From 5 Period SMA (5 min) Filter (5SmaLa5): Find stocks trading above or below the 5-period SMA on the 5-minute chart, in percent. Min 1 = above the average; max -1 = below it.
- Change From 5 Period SMA (15 min) Filter (15SmaLa5): Find stocks trading above or below the 5-period SMA on the 15-minute chart, in percent. Min 1 = above the average; max -1 = below it.
Change from 8 Period SMA (4)
- Change From 8 Period SMA (2 min) Filter (2SmaLa8): Find stocks trading above or below the 8-period SMA on the 2-minute chart, in percent. Min 1 = above the average; max -1 = below it.
- Change From 8 Period SMA (5 min) Filter (5SmaLa8): Find stocks trading above or below the 8-period SMA on the 5-minute chart, in percent. Min 1 = above the average; max -1 = below it.
- Change From 8 Period SMA (15 min) Filter (15SmaLa8): Find stocks trading above or below the 8-period SMA on the 15-minute chart, in percent. Min 1 = above the average; max -1 = below it.
- Change From 8 Period SMA (60 min) Filter (60SmaLa8): Find stocks trading above or below the 8-period SMA on the 60-minute chart, in percent. Min 1 = above the average; max -1 = below it.
Change from 10 Period SMA (4)
- Change From 10 Period SMA (2 min) Filter (2SmaLa10): Find stocks trading above or below the 10-period SMA on the 2-minute chart, in percent. Min 1 = above the average; max -1 = below it.
- Change From 10 Period SMA (5 min) Filter (5SmaLa10): Find stocks trading above or below the 10-period SMA on the 5-minute chart, in percent. Min 1 = above the average; max -1 = below it.
- Change From 10 Period SMA (15 min) Filter (15SmaLa10): Find stocks trading above or below the 10-period SMA on the 15-minute chart, in percent. Min 1 = above the average; max -1 = below it.
- Change From 10 Period SMA (60 min) Filter (60SmaLa10): Find stocks trading above or below the 10-period SMA on the 60-minute chart, in percent. Min 1 = above the average; max -1 = below it.
Change from 20 Period SMA (4)
- Change From 20 Period SMA (2 min) Filter (2SmaLa20): Find stocks trading above or below the 20-period SMA on the 2-minute chart, in percent. Min 1 = above the average; max -1 = below it.
- Change From 20 Period SMA (5 min) Filter (5SmaLa20): Find stocks trading above or below the 20-period SMA on the 5-minute chart, in percent. Min 1 = above the average; max -1 = below it.
- Change From 20 Period SMA (15 min) Filter (15SmaLa20): Find stocks trading above or below the 20-period SMA on the 15-minute chart, in percent. Min 1 = above the average; max -1 = below it.
- Change From 20 Period SMA (60 min) Filter (60SmaLa20): Find stocks trading above or below the 20-period SMA on the 60-minute chart, in percent. Min 1 = above the average; max -1 = below it.
Change from 200 Period SMA (4)
- Change From 200 Period SMA (2 min) Filter (2SmaLa200): Find stocks trading above or below the 200-period SMA on the 2-minute chart, in percent. Min 1 = above the average; max -1 = below it.
- Change From 200 Period SMA (5 min) Filter (5SmaLa200): Find stocks trading above or below the 200-period SMA on the 5-minute chart, in percent. Min 1 = above the average; max -1 = below it.
- Change From 200 Period SMA (15 min) Filter (15SmaLa200): Find stocks trading above or below the 200-period SMA on the 15-minute chart, in percent. Min 1 = above the average; max -1 = below it.
- Change From 200 Period SMA (60 min) Filter (60SmaLa200): Find stocks trading above or below the 200-period SMA on the 60-minute chart, in percent. Min 1 = above the average; max -1 = below it.
Change from 130 Period SMA
- Change From 130 Period SMA (15 min) Filter (15SmaLa130): Find stocks trading above or below the 130-period SMA on the 15-minute chart, in percent. Min 1 = above the average; max -1 = below it.
8 vs. 20 Period SMA (4)
- 8 vs. 20 Period SMA (2 min) Filter (2Sma8a20): Find stocks where the 8-period SMA is above (or below) the 20-period SMA on the 2-minute chart. Min 1 = 8 above 20; max -1 = below.
- 8 vs. 20 Period SMA (5 min) Filter (5Sma8a20): Find stocks where the 8-period SMA is above (or below) the 20-period SMA on the 5-minute chart. Min 1 = 8 above 20; max -1 = below.
- 8 vs. 20 Period SMA (15 min) Filter (15Sma8a20): Find stocks where the 8-period SMA is above (or below) the 20-period SMA on the 15-minute chart. Min 1 = 8 above 20; max -1 = below.
- 8 vs. 20 Period SMA (60 min) Filter (60Sma8a20): Find stocks where the 8-period SMA is above (or below) the 20-period SMA on the 60-minute chart. Min 1 = 8 above 20; max -1 = below.
20 vs. 200 Period SMA (4)
- 20 vs. 200 Period SMA (2 min) Filter (2Sma20a200): Find stocks where the 20-period SMA is above (or below) the 200-period SMA on the 2-minute chart. Min 1 = 20 above 200; max -1 = below.
- 20 vs. 200 Period SMA (5 min) Filter (5Sma20a200): Find stocks where the 20-period SMA is above (or below) the 200-period SMA on the 5-minute chart. Min 1 = 20 above 200; max -1 = below.
- 20 vs. 200 Period SMA (15 min) Filter (15Sma20a200): Find stocks where the 20-period SMA is above (or below) the 200-period SMA on the 15-minute chart. Min 1 = 20 above 200; max -1 = below.
- 20 vs. 200 Period SMA (60 min) Filter (60Sma20a200): Find stocks where the 20-period SMA is above (or below) the 200-period SMA on the 60-minute chart. Min 1 = 20 above 200; max -1 = below.
Filters to narrow Moving Average alerts
- Change (5 min, %) Filter (PUp5): Find stocks moving up or down fast in the last 5 minutes, in percent. Set a minimum to see gainers or a maximum to see drops, in real time.
Test it before you trade it

Don’t roll the dice. Test the odds. OddsMaker · TI Premium
Run any Moving Average setup through OddsMakerTI Premium, the Trade Ideas backtesting tool: event-based backtesting across thousands of stocks, with no coding. Prefer finished trade ideas to building your own? Holly, the Trade Ideas AI, publishes its own signals: Holly AI signalsTI Premium.
Related categories
- Intraday Stock Alerts by Time Frame (60 shared)
- End of Candle Alerts (32 shared)
- Volume Confirmed Alerts (6 shared)
- All alert and filter categories
FAQ
Which stocks are crossing above their 200-day moving average right now?
Turn on the Crossed Above 200 Day Moving Average Alert (CA200) in Trade Ideas Streaming Alerts. By default, the Crossed Above 200 Day Moving Average alert appears when the price of a stock crosses above its 200 day moving average with sufficient volume. Related: Crossed Below 200 Day Moving Average Alert (CB200), Crossed Above 50 Day Moving Average Alert (CA50), Crossed Below 50 Day Moving Average Alert (CB50), Crossed Above 20 Day Moving Average Alert (CA20).
What are Moving Average alerts and filters?
A moving average smooths price over a set number of days or candles; traders watch for price, or a faster average, crossing it. The Moving Average category holds the daily SMA cross alerts (20, 50 and 200 day), intraday period SMA crossovers and thrusts, and filters that measure how far price sits from a daily or intraday SMA.
How do I get alerts for moving average crossovers?
Use the Change From 200 Day SMA (%) Filter (MA200P). Set the min value to 1 to see only stocks that are performing better than their long-term SMA.
How many alerts and filters are in the Moving Average category?
The Moving Average category has 38 alerts and 39 filters (77 in all). Each one links to its own help page with default settings and examples.
Is there a moving average crossover scanner that works in real time?
Yes. In Trade Ideas, it is Streaming Alerts: the cross alerts fire on the cross, and the distance filters keep only stocks on the side of the average you want. Each alert reaches you the moment it fires, not on the next refresh.
Can I backtest Moving Average alerts before I trade them?
Yes. OddsMakerTI Premium, the Trade Ideas backtesting tool, runs event-based backtests on alert-based strategies across thousands of stocks, with no coding. Pick a Moving Average alert as the entry, add filters, and see how the strategy would have done.