


200 Day SMA
Table of Contents
Understanding the 200 Day SMA Filter
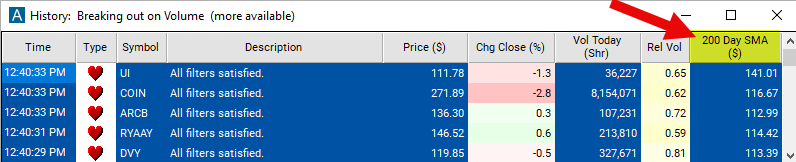
This filter is used to display the historical value for the 200 day SMA as calculated from the previous day, measured in dollars.
The 200-day Simple Moving Average (SMA) filter is a widely used tool that helps traders gauge the long-term trend of a stock's price. The 200-day SMA is calculated by taking the average closing price of a stock over the last 200 trading days and is updated daily as new closing prices become available. Here's how it works and why it's significant in trading:
Long-Term Trend Indicator: The 200-day SMA is considered a benchmark for identifying the overall long-term trend of a stock. A price above the 200-day SMA is typically seen as bullish, indicating that the stock is in an uptrend over the longer term. Conversely, a price below this average suggests a bearish trend or downtrend.
Support and Resistance Levels: The 200-day SMA often acts as a support level during uptrends, where price might bounce off this moving average when it touches or approaches it. In downtrends, it can act as a resistance level, where price struggles to break above the moving average.
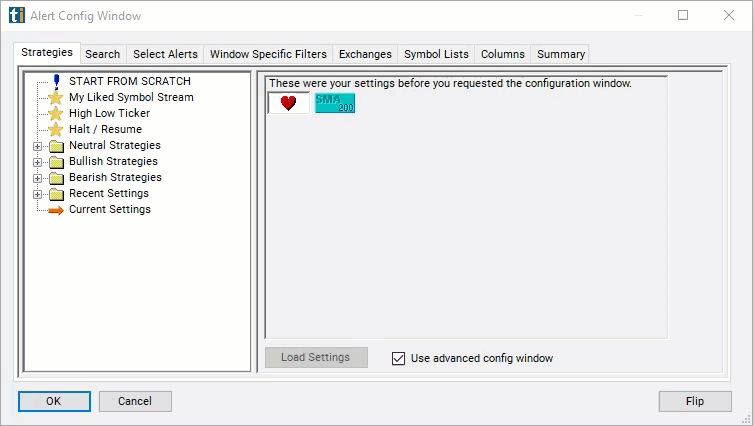
200 Day SMA Filter Settings
The settings of each Trade Ideas filter are defined in the Window Specific Filters Tab located in the Configuration Window of your Alert/Top List Window.
Here is how to setup the filter in your configuration window:
- Set the min value to 100 and the max value to 150 to see only stocks which have a 200 day SMA between $100 and $150.
200 Day SMA Filter
Several trading strategies can be employed with the 200 Day SMA filter. Here are a few examples:
Momentum Trading: Traders might enter trades in the direction of the trend confirmed by the 200-day SMA, looking for stocks that are consistently trading above this level for long positions, or below it for short positions.
Moving Average Crossovers: Some strategies involve looking for crossovers between the 200-day SMA and shorter-term moving averages, such as the 50-day SMA. A "golden cross" occurs when the shorter-term average crosses above the 200-day SMA, often seen as a bullish signal. Conversely, a "death cross" occurs when the shorter-term average falls below the 200-day SMA, viewed as bearish.
Sector and Market Analysis: Beyond individual stocks, the 200-day SMA can be applied to sector indices or the broader market to gauge overall market health. This can influence broader investment strategies and asset allocation decisions.
FAQs
What does the 200-day SMA indicate about a stock?
- The 200-day SMA helps identify the long-term trend of a stock's price. Generally, if a stock's price is above its 200-day SMA, it's considered in an uptrend, suggesting bullish sentiment. Conversely, if the price is below the SMA, it's seen as in a downtrend, indicating bearish sentiment.
How can the 200-day SMA be used to make trading decisions?
- Traders often use the 200-day SMA to decide on entry and exit points. Entering a trade when a stock's price crosses above the 200-day SMA might indicate a good buying opportunity, while a cross below could signal a selling or shorting opportunity. It's also used as a benchmark for setting stop-loss orders.
Can the 200-day SMA predict future stock movements?
- While the 200-day SMA can provide insights into a stock's current trend, it's a lagging indicator based on past price data and does not predict future movements. It should be used in conjunction with other analysis tools for a more comprehensive view.
Is the 200-day SMA effective in all market conditions?
- The 200-day SMA is most effective in identifying and confirming long-term trends. In highly volatile or sideways markets, its effectiveness may diminish as the price might frequently cross above and below the SMA, generating potential false signals.
Filter Info for 200 Day SMA [SMA200]
- description = 200 Day SMA
- keywords = Moving Average
- units = $
- format = p
- toplistable = 1
- parent_code =