


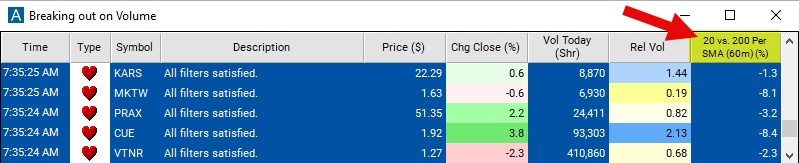
20 Vs. 200 Period SMA (60m)
Table of Contents
- Understanding the 20 Vs. 200 Period SMA 60 Minute Filter
- 20 Vs. 200 Period SMA 60 Minute Filter Settings
- Using the 20 Vs. 200 Period SMA 60 Minute Filter
- FAQs
Understanding the 20 Vs. 200 Period SMA 60 Minute Filter
The "20 Vs. 200 Period SMA (60m)" filter in stock trading compares two different Simple Moving Averages (SMA) calculated on a 60-minute chart. SMAs are popular technical indicators used by traders to assess the direction and strength of a stock's price trend.
Here's how this filter works:
Simple Moving Average (SMA): The SMA is calculated by averaging the closing prices of a stock over a specified period. In this filter, two SMAs are employed: a 20-period SMA and a 200-period SMA.
Comparison: The 20-period SMA represents the short-term trend, considering a shorter time frame of price data. Conversely, the 200-period SMA represents the long-term trend, considering a longer time frame of price data. By comparing these two SMAs, traders gain insights into the relationship between short-term and long-term trends in the stock's price movement. The number is always expressed as a percentage.
Signal Generation: When the 20-period SMA crosses above the 200-period SMA, it may indicate a bullish signal, suggesting that short-term momentum is increasing relative to long-term momentum. This is often referred to as a "golden cross" and is considered a bullish indicator. Conversely, when the 20-period SMA crosses below the 200-period SMA, it may indicate a bearish signal, suggesting that short-term momentum is decreasing relative to long-term momentum. This is known as a "death cross" and is considered a bearish indicator.
Interpretation: Traders can use these crossover signals to make trading decisions. For example, a bullish crossover may signal a potential entry point for long positions, while a bearish crossover may signal a potential entry point for short positions. Additionally, the relative positioning of the two SMAs can provide insights into the strength and duration of the prevailing trend.
Chart Representation: On a 60-minute chart, each candlestick represents price action that occurred over a 60-minute period. The SMAs are plotted on the chart, allowing traders to visually identify crossovers and trend dynamics.
20 Vs. 200 Period SMA 60 Minute Filter Settings
Configuring the "20 Vs. 200 Period SMA 60 Minute Filter" is simple and can be done within the Window Specific Filters Tab of the Configuration Window in your Alert/Top List Window.
Here's how to set up the filter in your configuration window:
-
Adjust the minimum value to 1 to to see only stocks in which the 20-period SMA is above the 200 Period SMA on a 60 minute chart.
-
Set the maximum value to -1 to focus only on stocks in which the 20-period SMA is below the the 200 Period SMA on a 60 minute chart.
Using the 20 Vs. 200 Period SMA 60 Minute Filter
The "20 Vs. 200 Period SMA 60 Minute" filter can be used in various trading strategies, including:
Pullback Strategy: After a crossover signal occurs, traders may wait for a pullback in the price to retest the crossover point. If the price holds above the crossover point during the pullback in a bullish scenario or below the crossover point in a bearish scenario, traders may consider it a potential entry point in the direction of the crossover signal. This strategy allows traders to enter positions at better prices within the context of the prevailing trend.
Volatility Breakout Strategy: Traders may use the distance between the 20-period SMA and the 200-period SMA as a measure of volatility. When the distance between the two SMAs widens significantly, it may indicate increased volatility and potential breakout opportunities. Traders can look for price breaks above or below key resistance or support levels following a period of consolidation, entering positions in the direction of the breakout to capitalize on momentum.
Mean Reversion Strategy: Occasionally, the price may deviate significantly from both the 20-period and 200-period SMAs, indicating overbought or oversold conditions. In such cases, traders may anticipate a mean reversion to occur, leading the price back toward the SMAs. Traders can look for signs of exhaustion in the trend, such as divergences in momentum oscillators or candlestick reversal patterns, to enter contrarian positions aiming to profit from the price retracement.
FAQs
What do the numbers "20" and "200" represent in the filter name?
- The numbers "20" and "200" denote the periods used for calculating the Simple Moving Averages (SMAs). The "20" represents the short-term SMA, calculated over a 20-period time frame, while the "200" represents the long-term SMA, calculated over a 200-period time frame.
How do I interpret a crossover between the 20-period SMA and the 200-period SMA?
- A crossover occurs when the short-term 20-period SMA crosses above or below the long-term 200-period SMA. A bullish crossover, known as a "golden cross," happens when the 20-period SMA crosses above the 200-period SMA, indicating potential bullish momentum. Conversely, a bearish crossover, known as a "death cross," occurs when the 20-period SMA crosses below the 200-period SMA, signaling potential bearish momentum.
What time frame does the 60-minute chart represent?
- The 60-minute chart displays price data for each interval or candlestick representing a 60-minute time frame. This means that each candlestick on the chart represents the price action that occurred during a 60-minute period.
How reliable are crossover signals generated by the 20 Vs. 200 Period SMA (60m) filter?
- While crossover signals can provide valuable insights into potential trend reversals or continuations, they are not infallible. Traders should use additional technical analysis tools and risk management techniques to confirm signals and mitigate risks associated with false signals or market noise.
Filter Info for 20 Vs. 200 Period SMA (60m) [60Sma20a200]
- description = 20 vs. 200 Period SMA (60m)
- keywords = Fixed Time Frame Moving Average
- units = %
- format = 1
- toplistable = 1
- parent_code = 2Sma20a200