


Change From 200 Day SMA
Table of Contents
- Understanding the Change From 200 Day SMA Percent Filter
- Change From 200 Day SMA Filter Settings
- Using the Change From 200 Day SMA Filter
- FAQs
Understanding the Change From 200 Day SMA Percent Filter
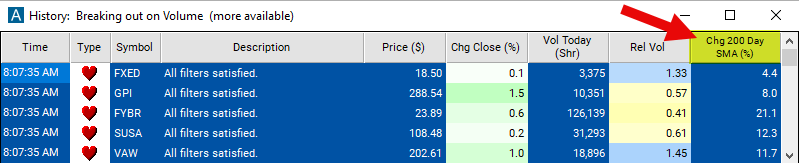
This filter compares the price of the last print for a stock to the average closing price of that stock for the previous 200, 50, 20, 10, or 8 trading days, expressed as a percentage.
The "Change From 200 Day SMA (%)" filter measures the percentage change of a stock's current price from its 200-day Simple Moving Average (SMA). This filter is widely used to gauge the long-term trend of a stock and its current position relative to this trend. Here's a breakdown of its components and how it's used in trading:
Simple Moving Average (SMA)
Definition: The SMA is an average of a stock's closing prices over a specific number of days, continuously updated as new daily prices become available.
200-Day SMA: This particular SMA is looked at to assess the long-term trend of a stock. A 200-day period is commonly used as it provides a broad view of the stock’s performance over approximately 40 weeks, which is nearly the duration of 10 months of trading.
Change From 200 Day SMA (%)
Calculation: This value is calculated by taking the current price of the stock, subtracting the 200-day SMA, then dividing the result by the 200-day SMA, and finally multiplying by 100 to get a percentage.
Interpretation: Above 0%: If the stock's current price is above its 200-day SMA, the percentage change will be positive. This indicates that the stock is performing better than its long-term average, suggesting a bullish trend. Below 0%: Conversely, if the stock's current price is below its 200-day SMA, the percentage change will be negative, indicating the stock is underperforming relative to its long-term average, suggesting a bearish trend.
Change From 200 Day SMA Filter Settings
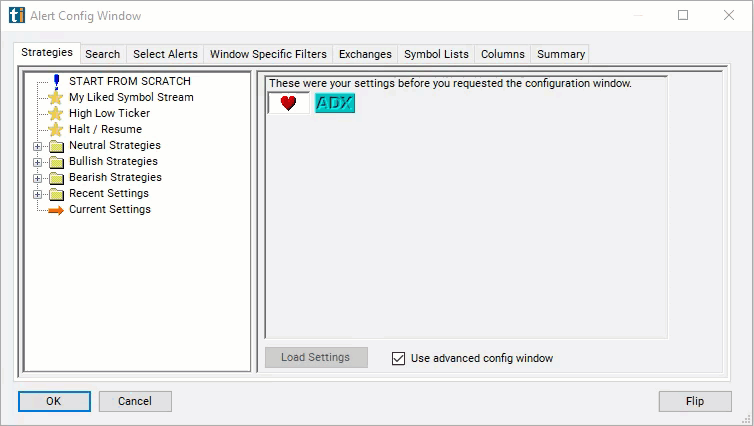
The settings of each Trade Ideas filter are defined in the Window Specific Filters Tab located in the Configuration Window of your Alert/Top List Window.
Here is how to setup the filter in your configuration window:
- Set the min value to 1 see only stocks that are performing better than their long-term SMA.
Using the Change From 200 Day SMA Filter
Several trading strategies can be employed with the Change From 200 Day SMA filter. Here are a few examples:
Trend-Following Strategy: This approach involves buying stocks that exhibit a significant positive change from their 200-day SMA, signaling an uptrend, and selling or avoiding stocks with a significant negative change, indicating a downtrend. The strategy capitalizes on the momentum of the market, aiming to ride the wave of an existing trend for potential profits.
Reversion to the Mean Strategy: This strategy is based on the premise that stocks significantly above or below their 200-day SMA will eventually revert to their mean. Traders look for stocks that are excessively deviated from the 200-day SMA to either buy (if below the SMA) or sell/short (if above the SMA), anticipating a correction towards the average.
Breakout Strategy: Investors watch for stocks that are breaking away from their 200-day SMA with increasing momentum, as evidenced by a rapidly increasing positive change. This signals a potential new trend or a strong continuation of an existing trend, prompting a buy decision. Conversely, a significant drop below the 200-day SMA may indicate a selling or shorting opportunity.
FAQs
What does a positive change from the 200-day SMA indicate?
- A positive change signifies that the stock’s current price is above its 200-day SMA, suggesting a potential uptrend and indicating that the stock is performing better than its long-term average.
How should I interpret a sudden spike in the "Change From 200 Day SMA (%)"?
- A sudden spike could indicate a significant price movement due to recent events or market news. It's essential to research the cause of the spike and assess its implications for the stock's long-term trend before making any trading decisions.
Can the "Change From 200 Day SMA (%)" be used in conjunction with volume analysis?
- Yes, combining the "Change From 200 Day SMA (%)" with volume analysis can provide deeper insights. For example, a significant change in the percentage accompanied by high volume might reinforce the signal's strength, suggesting strong buyer or seller conviction.
Filter Info for Change From 200 Day SMA [MA200P]
- description = Change from 200 Day SMA
- keywords = Moving Average
- units = %
- format = 1
- toplistable = 1
- parent_code =
 Change from 200 Day SMA [MA200R]
 Change from 50 Day SMA [MA50P]
 Change from 50 Day SMA [MA50R]
 Change from 20 Day SMA [MA20P]
 Change from 20 Day SMA [MA20R]
 Change from 10 Day SMA [MA10P]
 Change from 10 Day SMA [MA10R]
 Change from 8 Day SMA [MA8P]
 Change from 8 Day SMA [MA8R]