


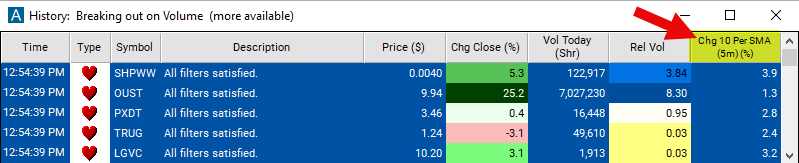
Change From 10 Period SMA (5m)
Table of Contents
- Understanding the Change From 10 Period SMA 5m Filter
- Change From 10 Period SMA 5m Filter Settings
- Using the Change From 10 Period SMA 5m Filter
- FAQs
Understanding the Change From 10 Period SMA 5m Filter
The "Change From 10 Period SMA 5m Filter" is an invaluable resource for traders targeting short to medium-term market trends. By comparing the current stock price to its 10-period Simple Moving Average (SMA) on a 5-minute chart, this filter illuminates the stock's momentum over the last 50 minutes. It's particularly suited for day traders and those engaging in more extended intraday strategies by offering insights into the prevailing trend direction.
Here's an overview of its operation:
Simple Moving Average (SMA)
10-Period SMA on a 5-Minute Chart: Computes the average closing price over the last 10 five-minute periods. This smoothing technique aids traders in discerning the immediate trend by dampening the effect of short-term price volatility.
Calculation: The filter's values are depicted as a percentage (%). The utilized formula is: Percent Change = ((Last Price - SMA) / SMA) * 100
A positive outcome indicates the current price is higher than the moving average, showcasing upward momentum. Conversely, a negative result signals the current price is lower than the average, denoting downward momentum.
Change From 10 Period SMA 5m Filter Settings
Configuring the "Change From 10 Period SMA 5m Filter" is a straightforward process within the Window Specific Filters Tab in the Configuration Window of your Alert/Top List Window.
Here's how to set up the filter in your configuration window:
-
To screen for stocks currently trading above their 10-period SMA on a 5-minute chart, set the minimum value parameter to 1.
-
To focus on stocks currently below their 10-period SMA on a 5-minute chart, set the maximum value to -1.
Using the Change From 10 Period SMA 5m Filter
Leveraging the "Change From 10 Period SMA 5m Filter" facilitates various trading strategies, especially for those looking to exploit short to medium-term timeframes. Here are some strategies:
Momentum Trading: A notable positive change can act as an entry trigger for long positions, capitalizing on upward price momentum. On the flip side, a pronounced negative change may offer a cue for short-selling opportunities.
Reversion to Mean Strategies: When the stock price markedly strays from the 10-period SMA, it might hint at an impending price correction towards the SMA, presenting chances for counter-trend trading.
Scalping: The filter's adeptness at capturing short-term movements makes it ideal for scalping strategies, where traders aim to profit from minor price changes through quick trades.
Dynamic Stop Loss and Take Profit: Utilize the 10-period SMA to dynamically adjust stop loss and take profit orders, adapting to the stock's current trend and volatility.
FAQs
How does the "Change From 10 Period SMA (5m)" compare to the 2-minute version?
- The 5-minute version provides a less granular but more filtered view of price trends, reducing noise and offering a clearer signal for short to medium-term trading decisions compared to the more rapid 2-minute version.
Is the "Change From 10 Period SMA (5m)" suitable for all trading approaches?
- This filter is especially useful for day traders and those who prefer not to trade on the very short-term fluctuations captured by the 2-minute chart. Its applicability might be limited for long-term investors without complementary longer-term analysis.
What signifies a continuous positive or negative change from the 10-period SMA on a 5-minute chart?
- Persistent positive changes suggest a strong bullish trend, potentially indicating lucrative buy opportunities. Continuous negative changes reveal a bearish trend, possibly alerting traders to selling or shorting opportunities. Validation from additional indicators is advisable for confirming these trends.
How to tailor the filter for varying stock volatility levels?
- Modifying the sensitivity of the percentage change threshold can help fine-tune the filter's responsiveness to different stocks' volatility. A higher threshold may be preferable for highly volatile stocks to avoid false alarms.
Filter Info for Change From 10 Period SMA (5m) [5SmaLa10]
- description = Change from 10 Period SMA (5m)
- keywords = Fixed Time Frame Moving Average
- units = %
- format = 1
- toplistable = 1
- parent_code = 2SmaLa10