


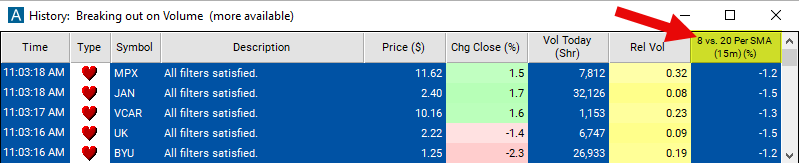
8 Vs. 20 Period SMA (15m)
Table of Contents
- Understanding the 8 Vs. 20 Period SMA 15 Minute Filter
- 8 Vs. 20 Period SMA 15 Minute Filter Settings
- Using the 8 Vs. 20 Period SMA 15 Minute Filter
- FAQs
Understanding the 8 Vs. 20 Period SMA 15 Minute Filter
The "8 Vs. 20 Period SMA (15m)" filter in stock trading compares two different Simple Moving Averages (SMA) calculated on a 15-minute chart. SMAs are commonly used technical indicators that help traders analyze the direction and strength of a trend in a stock's price.
Here's how the filter works:
Simple Moving Average (SMA): The SMA is calculated by averaging the closing prices of a stock over a specified period. In this filter, two SMAs are utilized: an 8-period SMA and a 20-period SMA.
Comparison: The 8-period SMA represents the short-term trend, considering a shorter time frame of price data, while the 20-period SMA represents the longer-term trend, considering a longer time frame of price data. By comparing these two SMAs, traders can gain insights into the relationship between short-term and long-term trends in the stock's price movement. The number is always expressed as a percentage.
Signal Generation: When the 8-period SMA crosses above the 20-period SMA, it may indicate a bullish signal, suggesting that short-term momentum is increasing relative to long-term momentum. This is commonly referred to as a "golden cross" and is considered a bullish indicator. Conversely, when the 8-period SMA crosses below the 20-period SMA, it may indicate a bearish signal, suggesting that short-term momentum is decreasing relative to long-term momentum. This is known as a "death cross" and is considered a bearish indicator.
Interpretation: Traders may use these crossover signals to make trading decisions. For example, a bullish crossover may signal a potential entry point for long positions, while a bearish crossover may signal a potential entry point for short positions. Additionally, the relative positioning of the two SMAs can provide insights into the strength and duration of the prevailing trend. If the short-term SMA consistently remains above the long-term SMA, it indicates a strong bullish trend, and vice versa for a bearish trend.
Chart Representation: On a 15-minute chart, each candlestick represents price action that occurred over a 15-minute period. The SMAs are plotted on the chart, allowing traders to visually identify crossovers and trend dynamics.
8 Vs. 20 Period SMA 15 Minute Filter Settings
Configuring the "8 Vs. 20 Period SMA 15 Minute Filter" is simple and can be done within the Window Specific Filters Tab of the Configuration Window in your Alert/Top List Window.
Here's how to set up the filter in your configuration window:
-
Adjust the minimum value to 1 to see only stocks in which the 8-period SMA is above the 20 Period SMA on a 15 minute chart.
-
Set the maximum value to -1 to focus only on stocks in which the 8-period SMA is below the the 20 Period SMA on a 15 minute chart.
Using the 8 Vs. 20 Period SMA 15 Minute Filter
The "8 Vs. 20 Period SMA 15 Minute" filter can be used in various trading strategies, including:
Crossover Strategy:
Bullish Signal (Golden Cross): When the 8-period SMA crosses above the 20-period SMA, it generates a bullish signal. Traders may consider entering long positions or buying the stock, anticipating further price appreciation.
Bearish Signal (Death Cross): Conversely, when the 8-period SMA crosses below the 20-period SMA, it generates a bearish signal. Traders may consider entering short positions or selling the stock, expecting further price decline.
Support and Resistance Strategy: Traders may use the crossover signals between the 8-period SMA and the 20-period SMA on a 15-minute chart to identify potential support and resistance levels. When the price crosses above the SMAs, it may indicate a breakout above resistance, while a crossover below the SMAs may suggest a breakdown below support.
Volume Confirmation Strategy: Traders may combine the crossover signals with volume analysis to confirm the strength of the trend. For example, a bullish crossover accompanied by increasing volume on a 15-minute chart may indicate strong buying pressure, reinforcing the bullish signal. Conversely, a bearish crossover with high volume may validate the bearish signal.
FAQs
What do the numbers "8" and "20" represent in the filter name?
- The numbers "8" and "20" denote the periods used for calculating the Simple Moving Averages (SMAs). The "8" represents the short-term SMA, calculated over an 8-period time frame, while the "20" represents the long-term SMA, calculated over a 20-period time frame.
How do I interpret a crossover between the 8-period SMA and the 20-period SMA on a 15-minute chart?
- A crossover occurs when the 8-period SMA crosses above or below the 20-period SMA on a 15-minute chart. A bullish crossover, known as a "golden cross," happens when the 8-period SMA crosses above the 20-period SMA, indicating potential bullish momentum. Conversely, a bearish crossover, known as a "death cross," occurs when the 8-period SMA crosses below the 20-period SMA, signaling potential bearish momentum.
What time frame does the 15-minute chart represent?
- The 15-minute chart displays price data for each interval or candlestick representing a 15-minute time frame. This means that each candlestick on the chart represents the price action that occurred during a 15-minute period.
Filter Info for 8 Vs. 20 Period SMA (15m) [15Sma8a20]
- description = 8 vs. 20 Period SMA (15m)
- keywords = Fixed Time Frame Moving Average
- units = %
- format = 1
- toplistable = 1
- parent_code = 2Sma8a20