


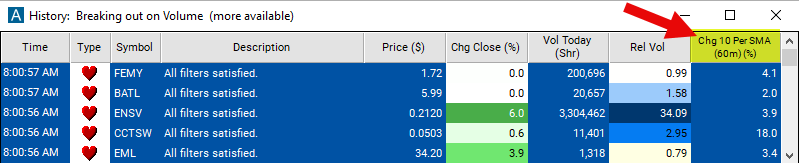
Change From 10 Period SMA (60m)
Table of Contents
- Understanding the Change From 10 Period SMA 60m Filter
- Change From 10 Period SMA 60m Filter Settings
- Using the Change From 10 Period SMA 60m Filter
- FAQs
Understanding the Change From 10 Period SMA 60m Filter
The "Change From 10 Period SMA 60m Filter" serves as an indispensable analysis tool for traders focusing on the broader intraday trends or short-term swing trading scenarios. By comparing the current price of a stock to its 10-period Simple Moving Average (SMA) on a 60-minute chart, this filter illuminates the stock's momentum over the last 10 hours. It is especially beneficial for those looking to grasp the momentum and direction of a stock's trend within a single trading day or over a couple of days.
Here’s an in-depth look at its mechanics:
Simple Moving Average (SMA)
10-Period SMA on a 60-Minute Chart: Calculates the average of the closing prices for the last 10 sixty-minute periods, effectively smoothing out price data over roughly the last 10 hours of trading to help identify the overarching trend.
Calculation: This filter expresses its values in percentage (%), following the formula: Percent Change = ((Last Price - SMA) / SMA) * 100
A positive result signifies that the stock's current price is higher than its average, suggesting an uptrend. Conversely, a negative value indicates that the current price is lower than the average, pointing to a downtrend.
Change From 10 Period SMA 60m Filter Settings
Configuring the "Change From 10 Period SMA 60m Filter" is straightforward, located within the Window Specific Filters Tab of the Configuration Window in your Alert/Top List Window.
Here's how to set up the filter in your configuration window:
-
Adjust the minimum value to 1 to filter for stocks that are currently positioned above their 10-period SMA on a 60-minute chart.
-
To focus on stocks currently below their 10-period SMA on a 60-minute chart, set the maximum value to -1.
Using the Change From 10 Period SMA 60m Filter
The "Change From 10 Period SMA 60m Filter" can underpin various trading strategies tailored to longer intraday periods or short-term swing trading. Among these strategies are:
Momentum Trading: Significant positive changes can indicate a strong entry point for long positions due to upward momentum. Conversely, distinct negative changes may serve as a signal for short opportunities.
Reversion to Mean Strategies: Substantial deviations from the 10-period SMA often hint at an overextended move, likely to revert to the mean (the SMA), presenting counter-trend trade opportunities.
Scalping: While primarily aimed at longer timeframes, the filter can also aid scalpers in identifying larger, more strategic opportunities that align with the broader market trend.
Dynamic Stop Loss and Take Profit: The 10-period SMA acts as a moving reference point for adjusting stop loss and take profit levels, responding to the stock's latest trend dynamics and volatility.
FAQs
How does the "Change From 10 Period SMA (60m)" contrast with shorter timeframe versions?
- By covering a longer timeframe, the 60-minute version reduces the impact of minor volatility and noise, offering a clearer perspective on the stock's trend over an entire trading day or more, compared to shorter timeframe versions.
Is the "Change From 10 Period SMA (60m)" appropriate for all traders?
- This filter is ideally suited for traders employing longer intraday and short-term swing trading strategies. Its broader timeframe may not align with the needs of very short-term scalpers or those with a long-term investment focus.
What does a persistent positive or negative change from the 10-period SMA on a 60-minute chart suggest?
- Ongoing positive changes indicate a strong bullish trend, potentially highlighting opportunities for buying. In contrast, consistent negative changes reflect a bearish trend, which might suggest selling or shorting opportunities. Always consider additional indicators for confirmation.
How should the filter be adjusted for stocks with differing levels of volatility?
- Modifying the percentage change threshold based on the stock's volatility can help tailor the filter's sensitivity, enabling traders to concentrate on significant trend changes while minimizing false signals in highly volatile stocks.
Filter Info for Change From 10 Period SMA (60m) [60SmaLa10]
- description = Change from 10 Period SMA (60m)
- keywords = Fixed Time Frame Moving Average
- units = %
- format = 1
- toplistable = 1
- parent_code = 2SmaLa10