


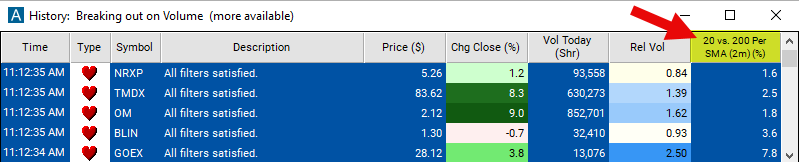
20 Vs. 200 Period SMA (2m)
Table of Contents
- Understanding the 20 Vs. 200 Period SMA 2 Minute Filter
- 20 Vs. 200 Period SMA 2 Minute Filter Settings
- Using the 20 Vs. 200 Period SMA 2 Minute Filter
- FAQs
Understanding the 20 Vs. 200 Period SMA 2 Minute Filter
The "20 Vs. 200 Period SMA (2m)" filter in stock trading compares two different Simple Moving Averages (SMA) calculated on a 2-minute chart. SMAs are popular technical indicators used by traders to assess the direction and strength of a stock's price trend.
Here's how this filter works:
Simple Moving Average (SMA): The SMA is calculated by averaging the closing prices of a stock over a specified period. In this filter, two SMAs are employed: a 20-period SMA and a 200-period SMA.
Comparison: The 20-period SMA represents the short-term trend, considering a shorter time frame of price data. Conversely, the 200-period SMA represents the long-term trend, considering a longer time frame of price data. By comparing these two SMAs, traders gain insights into the relationship between short-term and long-term trends in the stock's price movement. The number is always expressed as a percentage.
Signal Generation: When the 20-period SMA crosses above the 200-period SMA, it may indicate a bullish signal, suggesting that short-term momentum is increasing relative to long-term momentum. This is often referred to as a "golden cross" and is considered a bullish indicator. Conversely, when the 20-period SMA crosses below the 200-period SMA, it may indicate a bearish signal, suggesting that short-term momentum is decreasing relative to long-term momentum. This is known as a "death cross" and is considered a bearish indicator.
Interpretation: Traders can use these crossover signals to make trading decisions. For example, a bullish crossover may signal a potential entry point for long positions, while a bearish crossover may signal a potential entry point for short positions. Additionally, the relative positioning of the two SMAs can provide insights into the strength and duration of the prevailing trend.
Chart Representation: On a 2-minute chart, each candlestick represents price action that occurred over a 2-minute period. The SMAs are plotted on the chart, allowing traders to visually identify crossovers and trend dynamics.
20 Vs. 200 Period SMA 2 Minute Filter Settings
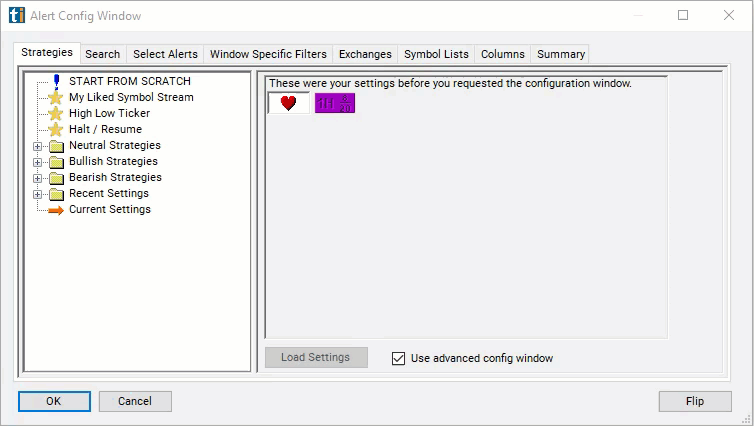
Configuring the "20 Vs. 200 Period SMA 2 Minute Filter" is simple and can be done within the Window Specific Filters Tab of the Configuration Window in your Alert/Top List Window.
Here's how to set up the filter in your configuration window:
-
Adjust the minimum value to 1 to to see only stocks in which the 20-period SMA is above the 200 Period SMA on a 2 minute chart.
-
Set the maximum value to -1 to focus only on stocks in which the 20-period SMA is below the the 200 Period SMA on a 2 minute chart.
Using the 20 Vs. 200 Period SMA 2 Minute Filter
The "20 Vs. 200 Period SMA 2 Minute" filter can be used in various trading strategies, including:
Crossover Strategy: Traders often utilize crossover signals between the 20-period SMA and the 200-period SMA to identify potential entry and exit points. They may buy when the 20-period SMA crosses above the 200-period SMA (golden cross) and sell when the 20-period SMA crosses below the 200-period SMA (death cross).
Trend Confirmation Strategy: Traders may use the relative positioning of the two SMAs to confirm the prevailing trend. If the 20-period SMA consistently remains above the 200-period SMA, it confirms a bullish trend. Conversely, if the 20-period SMA consistently remains below the 200-period SMA, it confirms a bearish trend. Traders may enter positions in alignment with the confirmed trend direction.
Pullback Strategy: After a crossover signal occurs, traders may wait for a pullback in the price to retest the crossover point. If the price holds above the crossover point during the pullback in a bullish scenario or below the crossover point in a bearish scenario, traders may consider it a potential entry point in the direction of the crossover signal.
FAQs
What do the numbers "20" and "200" represent in the filter name?
- The numbers "20" and "200" denote the periods used for calculating the Simple Moving Averages (SMAs). The "20" represents the short-term SMA, calculated over a 20-period time frame, while the "200" represents the long-term SMA, calculated over a 200-period time frame.
How do I interpret a crossover between the 20-period SMA and the 200-period SMA?
- A crossover occurs when the 20-period SMA crosses above or below the 200-period SMA. A bullish crossover, known as a "golden cross," happens when the 20-period SMA crosses above the 200-period SMA, indicating potential bullish momentum. Conversely, a bearish crossover, known as a "death cross," occurs when the 20-period SMA crosses below the 200-period SMA, signaling potential bearish momentum.
What time frame does the 2-minute chart represent?
- The 2-minute chart displays price data for each interval or candlestick representing a 2-minute time frame. This means that each candlestick on the chart represents the price action that occurred during a 2-minute period.
Filter Info for 20 Vs. 200 Period SMA (2m) [2Sma20a200]
- description = 20 vs. 200 Period SMA (2m)
- keywords = Fixed Time Frame Moving Average
- units = %
- format = 1
- toplistable = 1
- parent_code =
 20 vs. 200 Period SMA (5m) [5Sma20a200]
 20 vs. 200 Period SMA (15m) [15Sma20a200]
 20 vs. 200 Period SMA (60m) [60Sma20a200]