


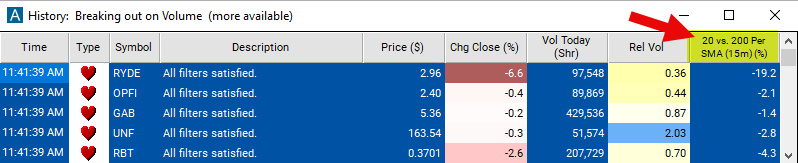
20 Vs. 200 Period SMA (15m)
Table of Contents
- Understanding the 20 Vs. 200 Period SMA 15 Minute Filter
- 20 Vs. 200 Period SMA 15 Minute Filter Settings
- Using the 20 Vs. 200 Period SMA 15 Minute Filter
- FAQs
Understanding the 20 Vs. 200 Period SMA 15 Minute Filter
The "20 Vs. 200 Period SMA (15m)" filter in stock trading compares two different Simple Moving Averages (SMA) calculated on a 15-minute chart. SMAs are popular technical indicators used by traders to assess the direction and strength of a stock's price trend.
Here's how this filter works:
Simple Moving Average (SMA): The SMA is calculated by averaging the closing prices of a stock over a specified period. In this filter, two SMAs are employed: a 20-period SMA and a 200-period SMA.
Comparison: The 20-period SMA represents the short-term trend, considering a shorter time frame of price data. Conversely, the 200-period SMA represents the long-term trend, considering a longer time frame of price data. By comparing these two SMAs, traders gain insights into the relationship between short-term and long-term trends in the stock's price movement. The number is always expressed as a percentage.
Signal Generation: When the 20-period SMA crosses above the 200-period SMA, it may indicate a bullish signal, suggesting that short-term momentum is increasing relative to long-term momentum. This is often referred to as a "golden cross" and is considered a bullish indicator. Conversely, when the 20-period SMA crosses below the 200-period SMA, it may indicate a bearish signal, suggesting that short-term momentum is decreasing relative to long-term momentum. This is known as a "death cross" and is considered a bearish indicator.
Interpretation: Traders can use these crossover signals to make trading decisions. For example, a bullish crossover may signal a potential entry point for long positions, while a bearish crossover may signal a potential entry point for short positions. Additionally, the relative positioning of the two SMAs can provide insights into the strength and duration of the prevailing trend.
Chart Representation: On a 15-minute chart, each candlestick represents price action that occurred over a 15-minute period. The SMAs are plotted on the chart, allowing traders to visually identify crossovers and trend dynamics.
20 Vs. 200 Period SMA 15 Minute Filter Settings
Configuring the "20 Vs. 200 Period SMA 15 Minute Filter" is simple and can be done within the Window Specific Filters Tab of the Configuration Window in your Alert/Top List Window.
Here's how to set up the filter in your configuration window:
-
Adjust the minimum value to 1 to to see only stocks in which the 20-period SMA is above the 200 Period SMA on a 15 minute chart.
-
Set the maximum value to -1 to focus only on stocks in which the 20-period SMA is below the the 200 Period SMA on a 15 minute chart.
Using the 20 Vs. 200 Period SMA 15 Minute Filter
The "20 Vs. 200 Period SMA 15 Minute" filter can be used in various trading strategies, including:
Crossover Strategy: Traders often utilize crossover signals between the 20-period SMA and the 200-period SMA to identify potential entry and exit points. They may buy when the 20-period SMA crosses above the 200-period SMA (golden cross) and sell when the 20-period SMA crosses below the 200-period SMA (death cross).
Trend Confirmation Strategy: Traders may use the relative positioning of the 20-period SMA and the 200-period SMA to confirm the prevailing trend. If the short-term SMA consistently remains above the long-term SMA, it confirms a bullish trend. Conversely, if the short-term SMA consistently remains below the long-term SMA, it confirms a bearish trend. Traders may enter positions in alignment with the confirmed trend direction.
Dynamic Stop Loss and Take Profit: Traders may use the levels of the 20-period SMA and the 200-period SMA as dynamic reference points for adjusting stop-loss and take-profit levels. For example, in a bullish scenario, traders may set stop-loss orders below the 200-period SMA to protect profits in case of a trend reversal, while in a bearish scenario, they may set take-profit orders near the 20-period SMA to capitalize on price declines.
FAQs
What do the numbers "20" and "200" represent in the filter name?
- The numbers "20" and "200" denote the periods used for calculating the Simple Moving Averages (SMAs). The "20" represents the short-term SMA, calculated over a 20-period time frame, while the "200" represents the long-term SMA, calculated over a 200-period time frame.
How do I interpret a crossover between the 20-period SMA and the 200-period SMA?
- A crossover occurs when the 20-period SMA crosses above or below the 200-period SMA. A bullish crossover, known as a "golden cross," happens when the 20-period SMA crosses above the 200-period SMA, indicating potential bullish momentum. Conversely, a bearish crossover, known as a "death cross," occurs when the 20-period SMA crosses below the 200-period SMA, signaling potential bearish momentum.
Can I use the filter for intraday trading or longer-term investing?
- Yes, the filter can be used for both intraday trading and longer-term investing. For intraday trading, traders may focus on shorter time frames to capture shorter-term trends, while for longer-term investing, they may use longer time frames to identify broader trends.
What other technical indicators can I use in conjunction with the 20 Vs. 200 Period SMA filter?
- Traders often use complementary technical indicators such as volume indicators, momentum oscillators (e.g., RSI, MACD), and support/resistance levels to confirm signals generated by the SMA crossover. Additionally, fundamental analysis and market sentiment can provide valuable context for interpreting signals and making trading decisions.
Filter Info for 20 Vs. 200 Period SMA (15m) [15Sma20a200]
- description = 20 vs. 200 Period SMA (15m)
- keywords = Fixed Time Frame Moving Average
- units = %
- format = 1
- toplistable = 1
- parent_code = 2Sma20a200