


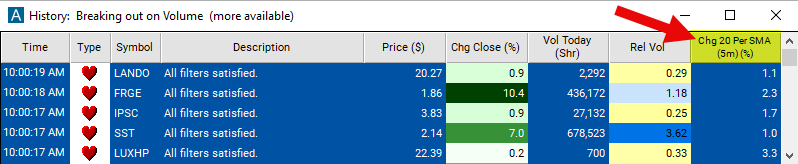
Change From 20 Period SMA (5m)
Table of Contents
- Understanding the Change From 20 Period SMA 5 Minute Filter
- Change From 20 Period SMA 5 Minute Filter Settings
- Using the Change From 20 Period SMA 5 Minute Filter
- FAQs
Understanding the Change From 20 Period SMA 5 Minute Filter
The "Change From 20 Period SMA 5 Minute Filter" is a valuable tool for traders focusing on short to mid-term intraday trading strategies. By comparing the current price of a stock to its 20-period Simple Moving Average (SMA) on a 5-minute chart, this filter provides insights into the stock's momentum over the last 100 minutes. It helps traders identify potential entry and exit points based on changes in momentum within a single trading session.
Here’s an in-depth look at how this filter operates:
Simple Moving Average (SMA)
20-Period SMA on a 5-Minute Chart: Calculates the average of the closing prices for the last 20 five-minute periods, smoothing out price data over approximately the last 100 minutes of trading to identify short to mid-term trends.
Calculation: The filter expresses its values in percentage (%), following the formula: Percent Change = ((Last Price - SMA) / SMA) * 100.
A positive result suggests that the stock's current price is above its 20-period SMA, indicating a potential uptrend. Conversely, a negative result indicates that the current price is below the SMA, suggesting a potential downtrend.
Change From 20 Period SMA 5 Minute Filter Settings
Configuring the "Change From 20 Period SMA 5 Minute Filter" is simple and can be done within the Window Specific Filters Tab of the Configuration Window in your Alert/Top List Window.
Here's how to set up the filter in your configuration window:
-
Adjust the minimum value to 1 to filter for stocks currently positioned above their 20-period SMA on a 5-minute chart.
-
Set the maximum value to -1 to focus on stocks currently below their 20-period SMA on a 5-minute chart.
Using the Change From 20 Period SMA 5 Minute Filter
The "Change From 20 Period SMA 5 Minute Filter" can be used in various trading strategies, including:
Breakout Trading Strategy: Identify potential breakout opportunities when the price breaks decisively above or below the 20-period SMA. Enter trades when the price breaks above the 20-period SMA during an uptrend or below the SMA during a downtrend, anticipating a continuation of the breakout momentum.
Trend Following Strategy: Enter trades in the direction of the prevailing trend indicated by the relationship between the current price and the 20-period SMA. Buy when the current price is above the 20-period SMA, indicating an uptrend, and sell when the price is below the SMA, indicating a downtrend.
Range Trading Strategy: Trade within the range defined by the 20-period SMA, taking advantage of price oscillations around this moving average. Buy near the lower boundary of the range (when the price is below the SMA) and sell near the upper boundary (when the price is above the SMA), anticipating reversals back towards the mean.
Scalping Strategy: Capitalize on short to mid-term price movements and momentum shifts within the context of the 20-period SMA. Enter trades based on short to mid-term momentum shifts indicated by changes in the relationship between the current price and the SMA. Take quick profits by scalping small to mid-size price movements.
FAQs
How does the "Change From 20 Period SMA (5m)" filter differ from shorter or longer timeframe versions?
- The 5-minute version provides insights into short to mid-term intraday momentum, whereas shorter timeframe versions offer perspectives on very short-term trends, and longer timeframe versions provide insights into longer-term trends over extended periods.
Is the "Change From 20 Period SMA (5m)" filter suitable for all traders?
- This filter is most suitable for traders focusing on short to mid-term intraday trading strategies. Traders with longer-term investment horizons may find longer timeframe versions more relevant, while those focused on very short-term trading may prefer shorter timeframe versions.
How should I interpret significant positive or negative changes from the 20-period SMA on a 5-minute chart?
- Significant positive changes suggest upward momentum and potential buying opportunities, while significant negative changes indicate downward momentum and potential selling opportunities. However, always use additional indicators for confirmation.
How can I adjust the filter for stocks with different levels of volatility?
- Adjusting the percentage change threshold based on a stock's volatility can help tailor the filter's sensitivity, allowing traders to focus on significant momentum shifts while filtering out noise in highly volatile stocks.
Filter Info for Change From 20 Period SMA (5m) [5SmaLa20]
- description = Change from 20 Period SMA (5m)
- keywords = Fixed Time Frame Moving Average
- units = %
- format = 1
- toplistable = 1
- parent_code = 2SmaLa20