


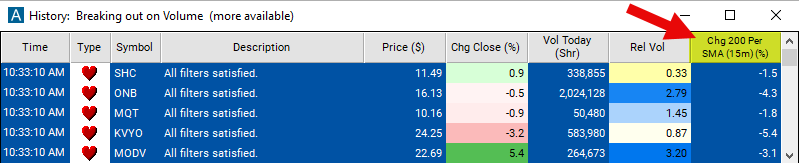
Change From 200 Period SMA (15m)
Table of Contents
- Understanding the Change From 200 Period SMA 15 Minute Filter
- Change From 200 Period SMA 15 Minute Filter Settings
- Using the Change From 200 Period SMA 15 Minute Filter
- FAQs
Understanding the Change From 200 Period SMA 15 Minute Filter
The "Change From 200 Period SMA 15 Minute Filter" is a valuable tool for traders focusing on medium-term intraday trading strategies. By comparing the current price of a stock to its 200-period Simple Moving Average (SMA) on a 15-minute chart, this filter provides insights into the stock's momentum over the last 50 hours. It helps traders identify potential entry and exit points based on changes in momentum within a single trading session.
Here’s an in-depth look at how this filter operates:
Simple Moving Average (SMA)
200-Period SMA on a 15-Minute Chart: Calculates the average of the closing prices for the last 200 fifteen-minute periods, smoothing out price data over approximately the last 50 hours of trading to identify medium-term trends.
Calculation: The filter expresses its values in percentage (%), following the formula: Percent Change = ((Last Price - SMA) / SMA) * 100.
A positive result suggests that the stock's current price is above its 200-period SMA, indicating a potential uptrend. Conversely, a negative result indicates that the current price is below the SMA, suggesting a potential downtrend.
Change From 200 Period SMA 15 Minute Filter Settings
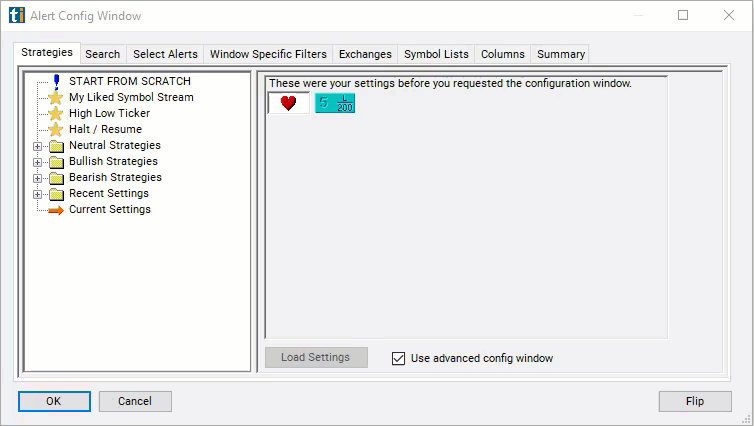
Configuring the "Change From 200 Period SMA 15 Minute Filter" is simple and can be done within the Window Specific Filters Tab of the Configuration Window in your Alert/Top List Window.
Here's how to set up the filter in your configuration window:
-
Adjust the minimum value to 1 to filter for stocks currently positioned above their 200-period SMA on a 15-minute chart.
-
Set the maximum value to -1 to focus on stocks currently below their 200-period SMA on a 15-minute chart.
Using the Change From 200 Period SMA 15 Minute Filter
The "Change From 200 Period SMA 15 Minute Filter" can be used in various trading strategies, including:
Medium-Term Trend Following Strategy: Use the 200-period SMA as a guide to identify potential medium-term trend opportunities. Enter trades when the price remains consistently above the SMA for an extended period, indicating a strong uptrend, and sell when the price remains consistently below the SMA, indicating a strong downtrend.
Pullback Trading Strategy: Look for opportunities to enter trades on pullbacks within the context of the overall trend. Wait for the price to temporarily move below the 200-period SMA during an uptrend or above the SMA during a downtrend before entering a trade, anticipating a continuation of the trend.
Breakout Trading Strategy: Identify potential breakout opportunities when the price breaks decisively above or below the 200-period SMA after a period of consolidation. Enter trades when the price breaks above the SMA during an uptrend or below the SMA during a downtrend, anticipating a continuation of the breakout momentum.
FAQs
How does the "Change From 200 Period SMA (15m)" filter differ from shorter or longer timeframe versions?
- The 15-minute version provides insights into medium-term intraday momentum, whereas shorter timeframe versions offer perspectives on shorter-term trends, and longer timeframe versions provide insights into trends over extended periods.
Is the "Change From 200 Period SMA (15m)" filter suitable for all traders?
- This filter is most suitable for traders focusing on medium-term intraday trading strategies. Traders with longer-term trading horizons may find longer timeframe versions more relevant.
How should I interpret significant positive or negative changes from the 200-period SMA on a 15-minute chart?
- Significant positive changes suggest upward momentum and potential buying opportunities, while significant negative changes indicate downward momentum and potential selling opportunities. However, always use additional indicators for confirmation.
Can I use the "Change From 200 Period SMA (15m)" filter for swing trading?
- While the filter is primarily designed for medium-term intraday trading, it can also be adapted for swing trading by using it in conjunction with longer timeframe indicators to identify potential swing trading opportunities.
Filter Info for Change From 200 Period SMA (15m) [15SmaLa200]
- description = Change from 200 Period SMA (15m)
- keywords = Fixed Time Frame Moving Average
- units = %
- format = 1
- toplistable = 1
- parent_code = 2SmaLa200