


Change From 8 Period SMA (60m)
Table of Contents
- Understanding the Change From 8 Period SMA 60m Filter
- Change From 8 Period SMA 60m Filter Settings
- Using the Change From 8 Period SMA 60m Filter
- FAQs
Understanding the Change From 8 Period SMA 60m Filter
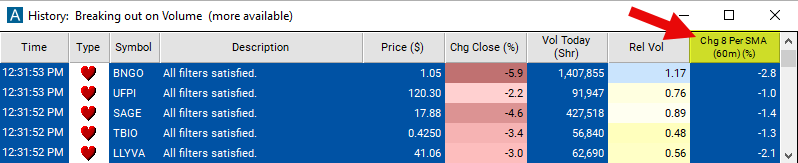
The "Change From 8 Period SMA 60m Filter" is a crucial analytical tool for traders aiming to capture trends over a medium-term horizon. It assesses the current stock price in relation to its 8-period Simple Moving Average (SMA) on a 60-minute chart. This filter is designed for those who engage in longer intraday trading and short-term swing trading, providing insights into the stock's momentum over the last 8 hours. Here’s a breakdown of its components:
Simple Moving Average (SMA)
8-Period SMA on a 60-Minute Chart: This calculates the average closing price over the last 8 sixty-minute periods, offering a smooth overview of price movement across the last 8 hours of trading activity.
Calculation: The filter's values are displayed as a percentage (%). The formula is: Percent Change = ((Last Price - SMA) / SMA) * 100
A positive value signifies that the current price is above the moving average, indicating upward momentum. In contrast, a negative value suggests the current price is below the average, pointing to downward momentum.
Change From 8 Period SMA 60m Filter Settings
The configuration of the "Change From 8 Period SMA 60m Filter" can be found in the Window Specific Filters Tab within the Configuration Window of your Alert/Top List Window.
Here's how to set up the filter in your configuration window:
-
To exclusively see stocks where the current price is above their 8-period SMA on a 60-minute chart, set the minimum value to 1.
-
To focus on stocks currently below their 8-period SMA on a 60-minute chart, set the maximum value to -1.
Using the Change From 8 Period SMA 60m Filter
Employing the "Change From 8 Period SMA 60m Filter" allows for the application of various trading strategies suited to longer time frames. Here are some examples:
Momentum Trading: A considerable positive change acts as a signal to enter long positions, leveraging upward momentum. Conversely, a significant negative change could indicate a viable short-selling opportunity.
Reversion to Mean Strategies: When the stock price significantly deviates from the 8-period SMA, it may signal an impending reversion to the SMA, providing opportunities for counter-trend trades.
Scalping: While typically used for longer time frames, the filter can assist in identifying more substantial, scalable opportunities within the trading day.
Dynamic Stop Loss and Take Profit: The 8-period SMA offers a reference point for adjusting stop loss and take profit orders according to the evolving market conditions.
FAQs
How does the "Change From 8 Period SMA (60m)" differ from the 15-minute version?
- The "Change From 8 Period SMA (60m)" encompasses a broader time frame, smoothing out more volatility and offering insights into the stock's performance over half the trading day. This can provide stronger signals for medium-term trading decisions compared to the 15-minute version.
Is the "Change From 8 Period SMA (60m)" suitable for all trading styles?
- It is particularly beneficial for traders looking at longer intraday trends and short-term swing traders. Its applicability may vary among different trading strategies and should be complemented by other analyses.
What does consistent positive or negative change from the 8-period SMA on a 60-minute chart indicate?
- Persistent positive changes suggest robust upward momentum, potentially signaling strong buying opportunities. Ongoing negative changes indicate sustained downward momentum, possibly highlighting selling or shorting opportunities. As always, additional indicators should be consulted for confirmation.
How to adjust the filter for varying stock volatilities?
- For stocks exhibiting higher volatility, adjusting the percentage change threshold higher may help in filtering out noise and focusing on more significant trend shifts.
Filter Info for Change From 8 Period SMA (60m) [60SmaLa8]
- description = Change from 8 Period SMA (60m)
- keywords = Fixed Time Frame Moving Average
- units = %
- format = 1
- toplistable = 1
- parent_code = 2SmaLa8