


Change From 5 Period SMA (15m)
Table of Contents
- Understanding the Change From 5 Period SMA 15m Filter
- Change From 5 Period SMA 15m Filter Settings
- Using the Change From 5 Period SMA 15m Filter
- FAQs
Understanding the Change From 5 Period SMA 15m Filter
The "Change From 5 Period SMA (15 minute)" filter in stock trading is used to compare the price of the last print for a stock to that of the 5 period simple moving average on a 15-minute chart. This filter is designed for short-term, intraday trading analysis due to its focus on small time increments. Here's how it's constructed and used:
Simple Moving Average (SMA)
5-Period SMA: This is an average of the stock's closing prices over the last 5 periods, where each period is 15 minutes long. In other words, it's the average closing price of the stock over the last 75 minutes of trading.
Dynamic Indicator: Dynamic and Responsive: The 5-period SMA on a 15-minute chart is more responsive than longer SMAs but less volatile than shorter period SMAs or those calculated on smaller timeframe charts.
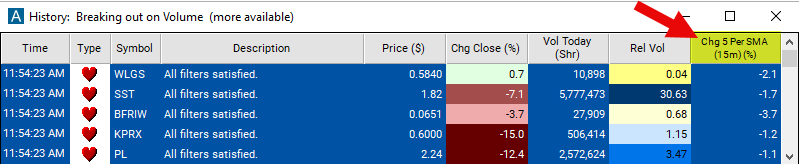
Calculation: The values entered for this filter are percentage (%). The formula is (Percent Change) = ((Last Price) - (SMA)) / (SMA) * 100.
A positive number means that the current price is above the moving average. A negative number means the current price is below the moving average.
Change From 5 Period SMA 15m Filter Settings
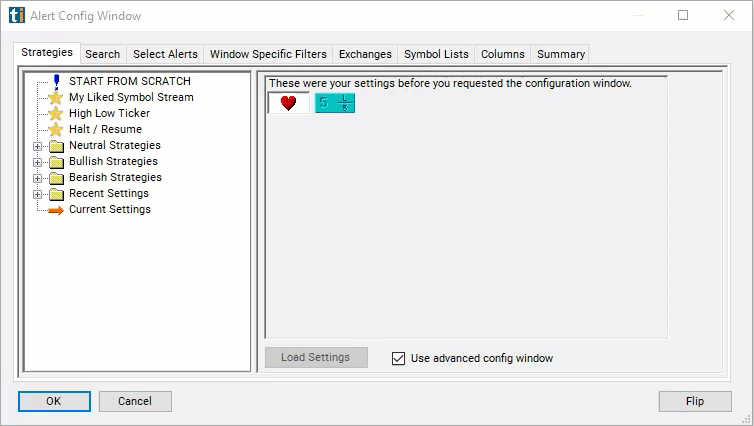
The settings of each Trade Ideas filter are defined in the Window Specific Filters Tab located in the Configuration Window of your Alert/Top List Window.
Here is how to setup the filter in your configuration window:
-
Set the min value to 1 to see only stocks in which the current price is above their 5 period SMA on a 15 minute chart.
-
Set the max value to -1 to see only stocks in which the current price is below their 5 period SMA on a 15 minute chart.
Using the Change From 5 Period SMA 15m Filter
Several trading strategies can be employed with the Change From 5 Period SMA 15m filter. Here are a few examples:
Trend Identification: Traders use this filter to quickly determine if a stock is currently experiencing short-term upward or downward momentum, which can guide intraday trading decisions.
Momentum-Based Entries and Exits: A positive change may prompt momentum traders to take long positions, while a negative change might lead them to sell or take short positions.
Mean Reversion Strategies: If a stock deviates significantly from its 5-period SMA, some traders might anticipate a reversion to the mean and trade in the opposite direction of the deviation.
Combination with Other Indicators: To enhance its effectiveness and reduce the likelihood of false signals, this filter is often used with other technical indicators such as volume, MACD, or RSI.
FAQs
What does it mean if the "Change From 5 Period SMA (15 minute)" value is consistently positive?
- A consistently positive value indicates that the stock price is maintaining its level above the 5-period SMA, suggesting sustained short-term upward momentum or bullish sentiment.
How should I react to a negative "Change From 5 Period SMA (15 minute)" reading?
- A negative change suggests that the stock is trading below its short-term average, indicating bearish momentum. Traders may consider this a prompt to explore selling opportunities or to wait for a trend reversal signal before buying.
How do large price spikes affect the "Change From 5 Period SMA (15 minute)"?
- Significant price spikes can cause the SMA to be less representative of the true trend. Traders should be cautious following a spike and consider looking at additional context or waiting for the SMA to stabilize.
What is a good threshold for the "Change From 5 Period SMA (15 minute)" to indicate a strong trading signal?
- There’s no one-size-fits-all threshold, as it can vary based on the stock’s volatility and overall market conditions. Traders often set their own thresholds based on backtesting and experience.
Filter Info for Change From 5 Period SMA (15m) [15SmaLa5]
- description = Change from 5 Period SMA (15m)
- keywords = Fixed Time Frame Moving Average
- units = %
- format = 1
- toplistable = 1
- parent_code = 2SmaLa5