


Crossed Below 200 Day Moving Average
Table of Contents
Understanding the Crossed Below 200 Day Moving Average Alert
Simple Moving Average (SMA) is a commonly used technical indicator that helps smooth out price data to identify trends over a specified period of time. The SMA is calculated by taking the average price of a security over a set number of periods, dividing the sum by the number of periods. The 200 day moving average is the traditional way to determine if the stock is up or down in the long term.
Traders and investors use the 200-period moving average for various purposes, and it offers several potential benefits:
Trend Identification: One of the primary uses of the 200-period moving average is to identify the overall trend in the price of a security. If the current price is below the 200-day moving average, it may be interpreted as a bearish signal, suggesting a downtrend.
Support and Resistance: The 200-day moving average can act as a significant support or resistance level. When the price approaches the 200-day moving average from below, it may find support, potentially signaling a buying opportunity. On the other hand, if the price approaches from above, the 200-day moving average may act as resistance, signaling a potential reversal or a challenging level for the security to surpass.
Long-Term Trend Assessment: The 200-day moving average is considered a long-term indicator, providing a broader perspective on the security's price movements. Traders and investors often use it to assess the long-term health and direction of a market or individual stock.
Filtering Noise: The 200-period moving average helps filter out short-term price fluctuations and noise, allowing traders and investors to focus on the broader trend. This can be particularly useful for those who prefer a more strategic, long-term approach to investing.
Investment Decision-Making: Some market participants use crossovers between the 200-day moving average and shorter-term moving averages (such as the 50-day moving average) to make investment decisions. For example, a bullish crossover (shorter-term moving average crossing above the 200-day moving average) might be seen as a potential buying signal, while a bearish crossover could be considered a selling signal.
The alert listed here requires statistical confirmation before it appears. This filters out noise, but requires a slight delay. This analysis involves price, time, and volume. If the price continues to move around the 200 day moving average, this alert may never appear. Once the price chooses a direction the exact amount of time required for the alert to appear depends on volume. The statistical analysis does not require that every print cross the 200 day moving average before the alert is displayed. The analysis filters out insignificant prints that go against the general trend. It is even possible, although unlikely, that the last print disagrees with the analysis as a whole.
Default Settings
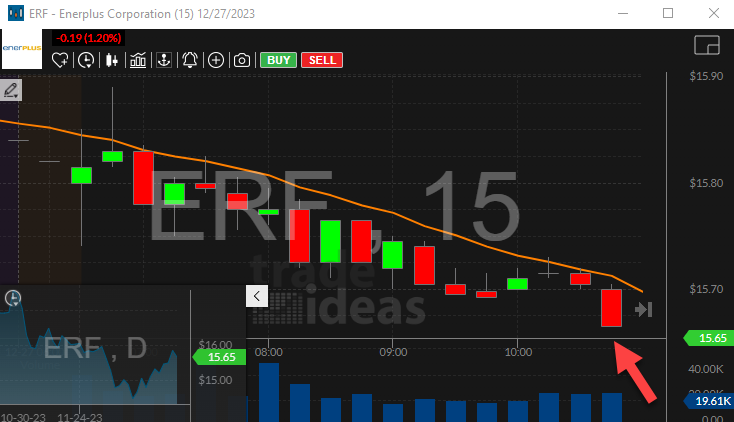
By default, the Crossed Below 200 Day Moving Average alert appears when the price of a stock crosses below its 200 day moving average with sufficient volume.
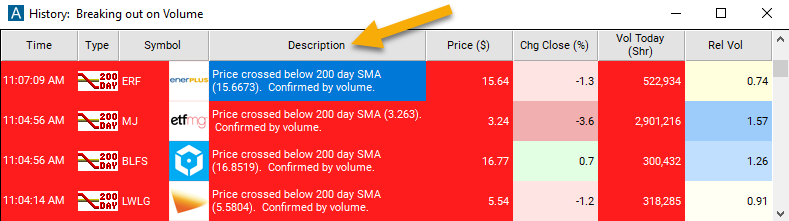
Description Column
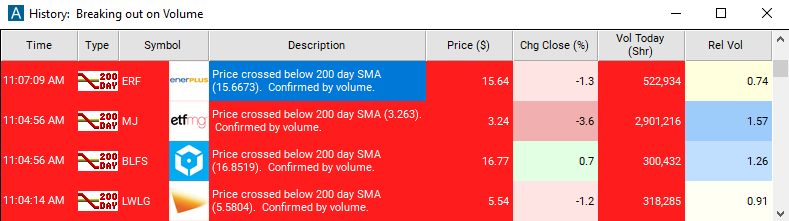
The description column will report at which price the stock crossed below its moving average.
Alert Info for Crossed Below 200 Day Moving Average [CB200]
- description = Crossed below 200 day moving average
- direction = -
- keywords = Moving Average Volume Confirmed
- flip_code =
 Crossed above 200 day moving average [CA200]
 - parent_code = CA200