


Inverted Head and Shoulders
Table of Contents
- Understanding the Inverted Head and Shoulders Alert
- Default Settings
- Custom Settings
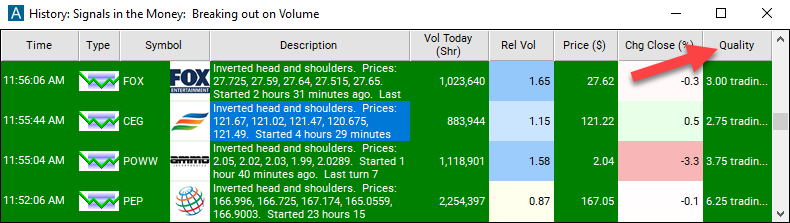
- Description Column
- Quality Column
Understanding the Inverted Head and Shoulders Alert
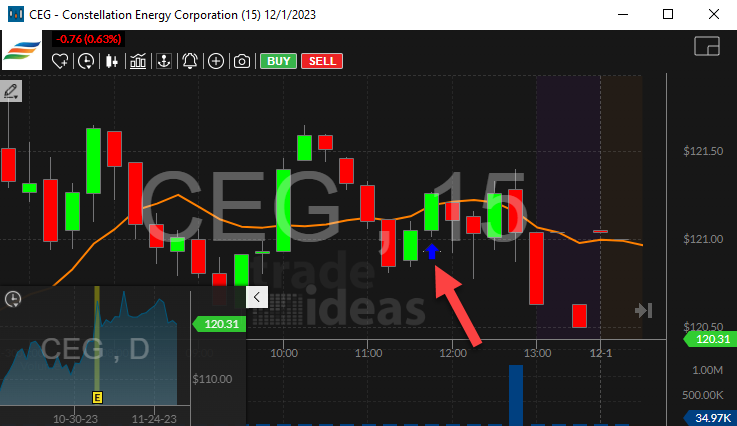
This alert reports the inverted head and shoulders pattern which is common in technical analysis.
An inverted head and shoulders pattern is defined by exactly 5 consecutive turning points. The first point is a low. The last point is a low at approximately the same price as the first point. The second point is a high. The fourth point is a high at approximately the same price as the second point. The middle point is a low, and it must be lower than any of the other 5 points. Our definition of "approximately the same price" depends on the size of the pattern and the volatility of the stock.
There are many common interpretations of an inverted head and shoulders pattern. Some people use the first and last points, the shoulders, to draw a support line. We use a green icon to represent this pattern, since many people use this as a reversal pattern.
Default Settings
By default, the 'Inverted Head and Shoulders' alert will appear when these qualifications are met:
- The first point is a low
- The last point is a low at approximately the same price as the first point
- The second point is a high
- The fourth point is a high at approximately the same price as the second point
- The middle point is a low, and it must be lower than any of the other 5 points
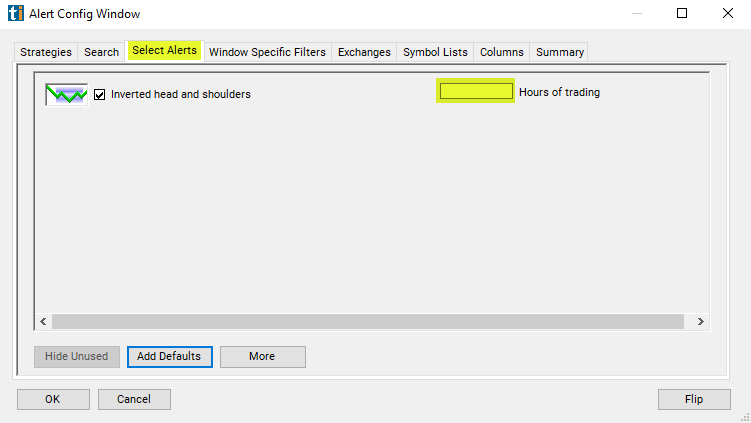
Custom Settings
For 'Inverted Head and Shoulders' alerts, you have the option to use an alert specific filter. This filter is located immediately to the right of the corresponding alert and is always optional. You can decide to leave it blank if you want to receive more alerts, or you can fill it in to restrict the number of alerts you receive. This filter allows you to specify the quality of the alert. When you set a higher number for this filter, you are telling the alerts server to display only alerts that meet a higher quality standard, resulting in fewer alerts being shown.
When setting an alert for 'Inverted Head and Shoulders', the user can filter the alert by hours traded.
If I see a pattern that lasted from noon yesterday to noon today, is that any better than a pattern that lasted from the open this morning to the close this afternoon? How much better? We weight the pre and post market according to volume. On an average day an average NASDAQ 100 stock will trade roughly 1 hour's worth of volume between the close and the following open. If you want to see stock patterns that lasted for a whole day, a good estimate is 7.5 hours, 6.5 for normal hours plus 1 for the pre and post market.
The same rules apply during the day. If a chart pattern lasts for one hour starting from the open, it will almost always be considered a stronger pattern than if it lasted one hour starting from the beginning of lunch. Hours are just an estimate. Volume is the major factor in this filter. Stocks trading on higher than average volume will satisfy this filter faster than stocks trading on lower than average volume.
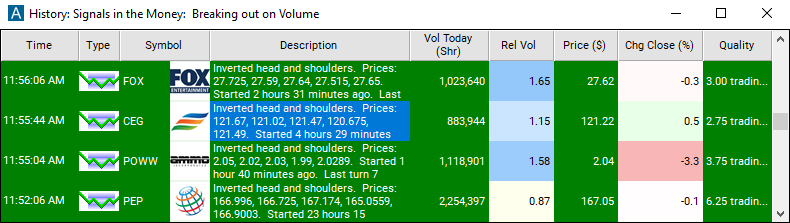
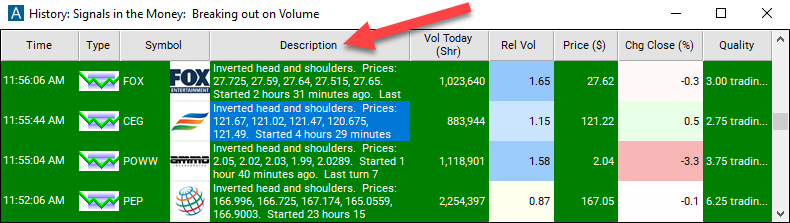
Description Column
The description of each alert lists the prices that formed the pattern. It also includes the times of when the pattern started and ended.
Quality Column
The quality value on a scan using the 'Inverted Head and Shoulders' alert defines the number of hours since the measured pattern has been established.
Alert Info for Inverted Head and Shoulders [GHASI]
- description = Inverted head and shoulders
- direction = +
- keywords = Geometric Pattern Volume Confirmed
- flip_code =
 Head and shoulders [GHAS]
 - parent_code =