


5 Minute Doji
Table of Contents
Understanding the 5 Minute Doji Alert
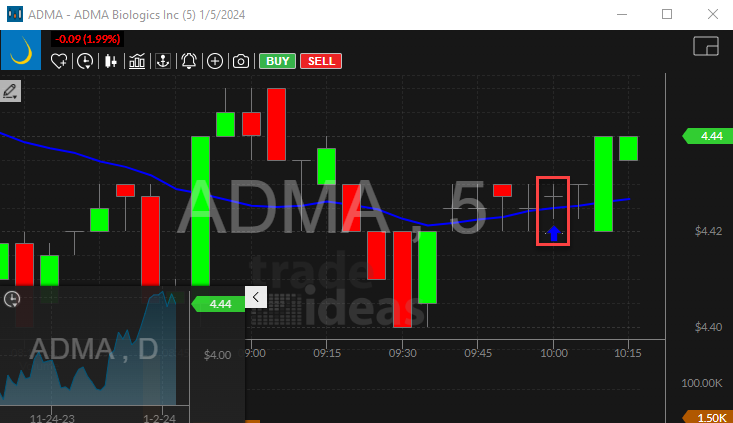
The Doji pattern is a candlestick pattern in technical analysis that signals indecision between buyers and sellers. It forms when the opening and closing prices of an asset are very close or identical, resulting in a small or nonexistent body for the candlestick. The length of the upper and lower wicks can vary, indicating the price range within the trading period.
Here are the characteristics of a Doji pattern:
- The open and close prices are very close or identical.
- The candlestick has a small or no real body.
- It has upper and lower wicks that show the high and low prices during the trading period.
The Doji pattern suggests that neither buyers nor sellers were able to gain control during the session, resulting in a standoff. It often appears at potential reversal points in the market and is considered a neutral or indecision signal.
Benefits of using the Doji pattern alert in stock trading include:
Reversal Signal: A Doji pattern, especially after a strong price move, can indicate a potential reversal. It signals uncertainty and a possible shift in market sentiment.
Trend Continuation Signal: In some cases, a Doji in the middle of a trend may signal a temporary pause in the market, suggesting that the existing trend could continue.
Decision Point: Traders use the Doji as a cue to monitor the market closely. It can act as a decision point, prompting traders to assess other indicators and market conditions for confirmation.
Support and Resistance Levels: A Doji near support or resistance levels can be significant. It may indicate a struggle between bulls and bears at these key levels.
Combined with Other Indicators: Traders often use the Doji pattern in conjunction with other technical indicators to increase its reliability. For example, a Doji at a key Fibonacci level or in conjunction with a trendline might carry more weight.
Risk Management: Recognizing a Doji can be crucial for risk management. Traders may tighten stop-loss orders or reassess their positions based on the uncertainty reflected in the pattern.
Because the closing price is so specific for a Doji pattern, we only report these at the end of the timeframe. The different alerts work on charts of different timeframes.
Default Settings
By default, this alert is triggered when a Doji pattern is created on a standard 5 minute candlestick chart. To align with each alert, it's essential to utilize the corresponding time frame on the chart. For instance, the 5 minute doji alert is visualized on the 5-minute candlestick chart.
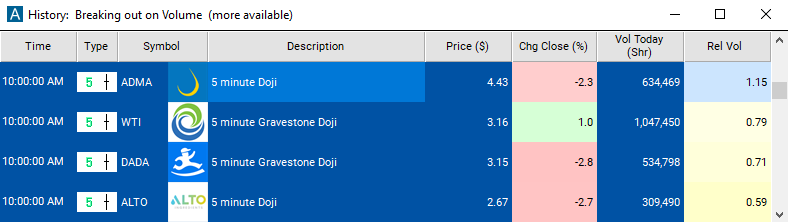
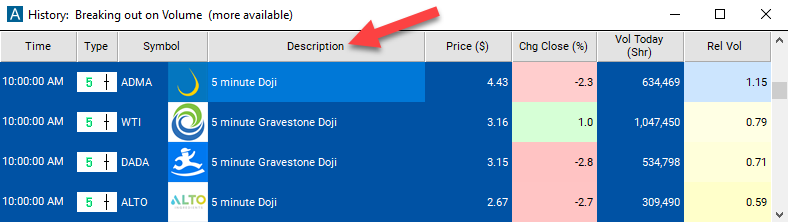
Description Column
The description column of this scan will display "5 Minute Doji", along with the specific type of doji, providing you with a clear indication of the specific alert that has been triggered.
Alert Info for 5 Minute Doji [DOJ5]
- description = 5 minute Doji
- direction =
- keywords = Candle Pattern End Of Candle Fixed Time Frame
- flip_code =
- parent_code =
 10 minute Doji [DOJ10]
 15 minute Doji [DOJ15]
 30 minute Doji [DOJ30]
 60 minute Doji [DOJ60]