


Double Bottom
Table of Contents
- Understanding the Double Bottom Alert
- Default Settings
- Custom Settings
- Description Column
- Quality Column
Understanding the Double Bottom Alert
A double bottom is common long-term technical analysis pattern. A double bottom is defined by at least two lows at approximately the same price level. Significant time and volume must exist between the two lows, making them distinct.
This alert can also report triple bottoms, quadruple bottoms, etc. In these cases, the alert description states the number of lows. We do not require as much time or volume between the individual lows in a triple or quadruple bottom as we do in a double bottom, as long as the first and last low are spread sufficiently far apart.
Default Settings
By default, the 'Double Bottom' alert will appear when there are two lows at approximately the same price, with significant time and volume between them.
Custom Settings
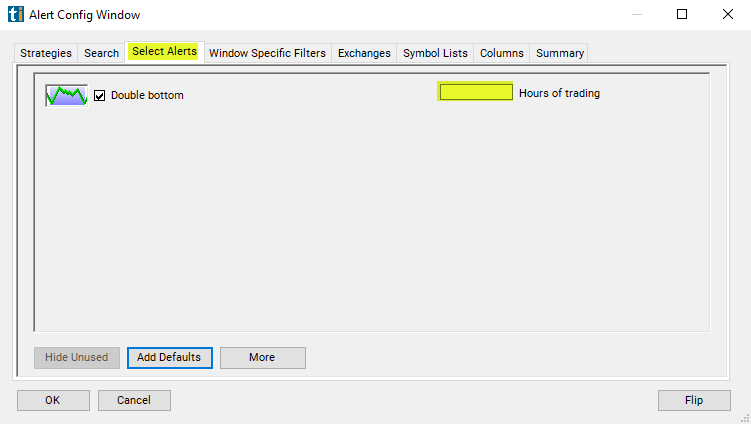
For 'Double Bottom' alerts, you have the option to use an alert specific filter. This filter is located immediately to the right of the corresponding alert and is always optional. You can decide to leave it blank if you want to receive more alerts, or you can fill it in to restrict the number of alerts you receive. This filter allows you to specify the quality of the alert. When you set a higher number for this filter, you are telling the alerts server to display only alerts that meet a higher quality standard, resulting in fewer alerts being shown.
When setting an alert for 'Double Bottom', the user can filter the alert by hours traded.
If I see a pattern that lasted from noon yesterday to noon today, is that any better than a pattern that lasted from the open this morning to the close this afternoon? How much better? We weight the pre and post market according to volume. On an average day an average NASDAQ 100 stock will trade roughly 1 hour's worth of volume between the close and the following open. If you want to see stock patterns that lasted for a whole day, a good estimate is 7.5 hours, 6.5 for normal hours plus 1 for the pre and post market.
The same rules apply during the day. If a chart pattern lasts for one hour starting from the open, it will almost always be considered a stronger pattern than if it lasted one hour starting from the beginning of lunch. Hours are just an estimate. Volume is the major factor in this filter. Stocks trading on higher than average volume will satisfy this filter faster than stocks trading on lower than average volume.
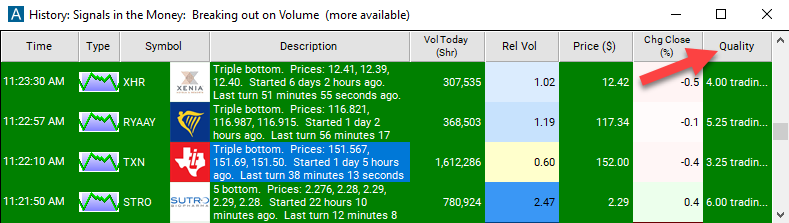
Description Column
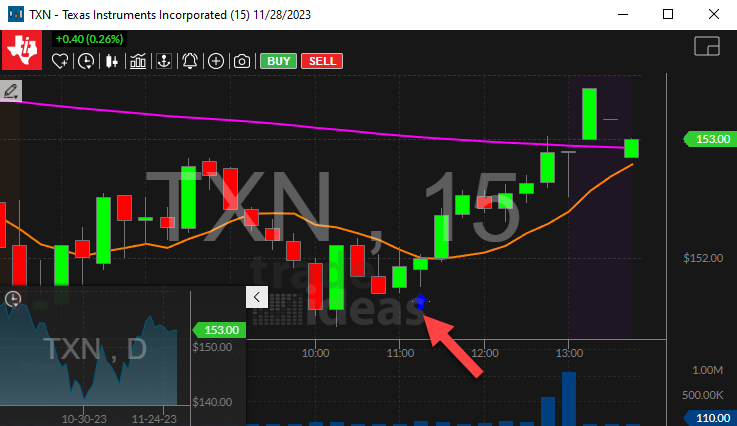
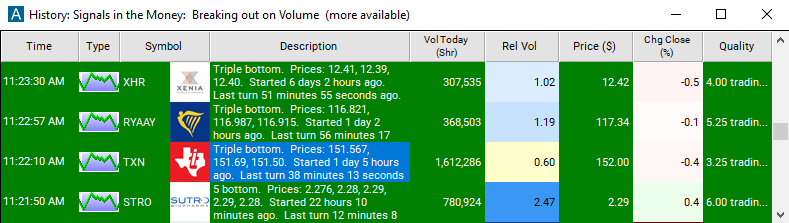
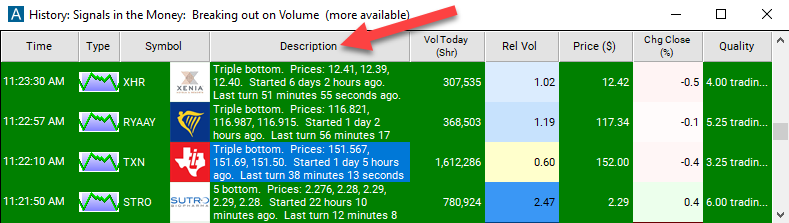
The description of each alert lists the prices that formed the pattern. It also includes the times of when the pattern started and ended.
Quality Column
The quality value on a scan using the 'Double Bottom' alert defines the number of hours since the measured pattern has been established.
Alert Info for Double Bottom [GDBOT]
- description = Double bottom
- direction = +
- keywords = Geometric Pattern Volume Confirmed
- flip_code =
 Double top [GDTOP]
 - parent_code =