


Crossed Above Resistance
Table of Contents
- Understanding the Crossed Above Resistance Alert
- Default Settings
- Custom Settings
- Description Column
- Quality Column
Understanding the Crossed Above Resistance Alert
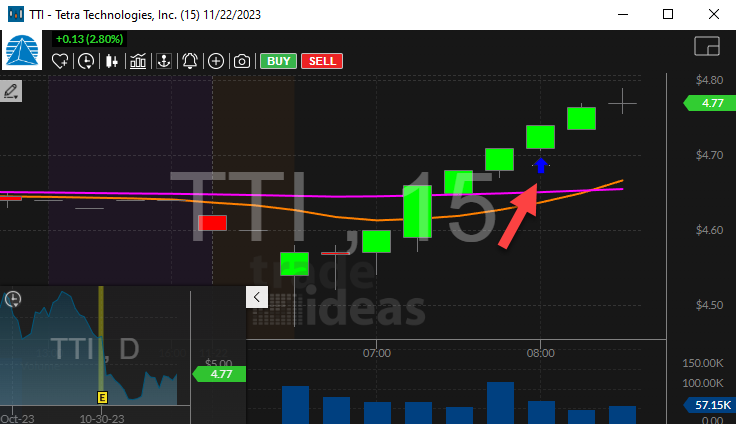
This alert appears whenever a stock crosses important resistance lines. This is similar to its volume confirmed counterpart. Both sets of alerts use the same definition of resistance, and the exact same lines. The volume confirmed version of this alert requires more proof that the price has really crossed the resistance line. This alert requires less confirmation than its volume confirmed counterpart, so we typically report it sooner.
Resistance is particularly sensitive to noise. By definition, resistance is a place where the stock price spends a lot of time. The stock does not stay at one exact price, but it moves around near that price. If we just drew a line right through the middle of resistance, and reported every time the stock made a single print on the wrong side of the line, we would generate too many alerts.
This alert is similar to looking at a 1 minute stock graph. The volume confirmed version of this alert is similar to looking at a 15 minute stock graph.
Default Settings
By default, the 'Crossed Above Resistance' alert will appear when a stock crosses above a resistance line. This alert does not require as much proof that it has crossed the resistance line as its volume confirmed counterpart.
Custom Settings
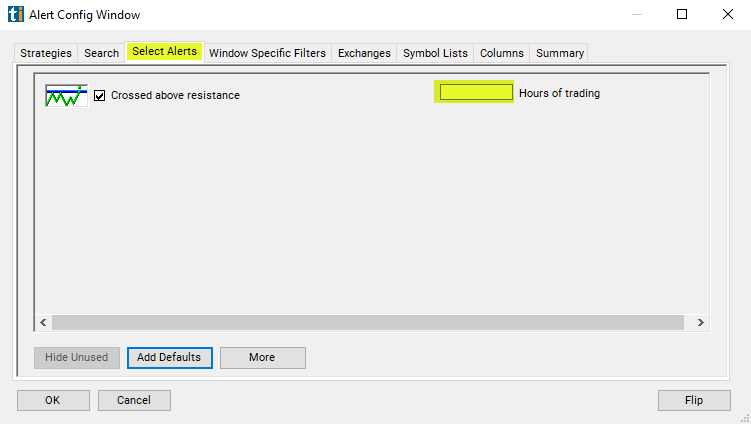
For 'Crossed Above Resistance' alerts, you have the option to use an alert specific filter. This filter is located immediately to the right of the corresponding alert and is always optional. You can decide to leave it blank if you want to receive more alerts, or you can fill it in to restrict the number of alerts you receive. This filter allows you to specify the quality of the alert. When you set a higher number for this filter, you are telling the alerts server to display only alerts that meet a higher quality standard, resulting in fewer alerts being shown.
When setting an alert for 'Crossed Above Resistance', the user can filter the alert by hours traded. Crossing a resistance line which has been active for one day is interesting. Crossing a resistance line which has been active for two days is more interesting. Crossing a resistance line which has been active for an hour is not very interesting.
Normally there are 6.5 hours between the open and the close. But, what about premarket and post market?
If I see a pattern that lasted from noon yesterday to noon today, is that any better than a pattern that lasted from the open this morning to the close this afternoon? How much better? We weight the pre and post market according to volume. On an average day an average NASDAQ 100 stock will trade roughly 1 hour's worth of volume between the close and the following open. If you want to see stock patterns that lasted for a whole day, a good estimate is 7.5 hours, 6.5 for normal hours plus 1 for the pre and post market.
The same rules apply during the day. If a chart pattern lasts for one hour starting from the open, it will almost always be considered a stronger pattern than if it lasted one hour starting from the beginning of lunch. Hours are just an estimate. Volume is the major factor in this filter. Stocks trading on higher than average volume will satisfy this filter faster than stocks trading on lower than average volume.
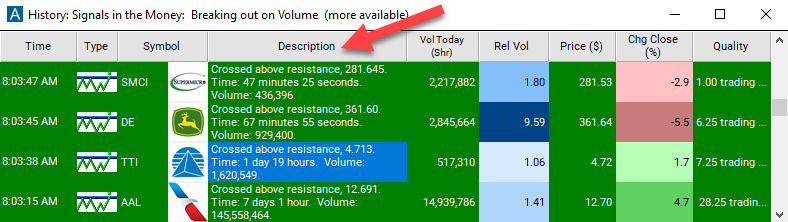
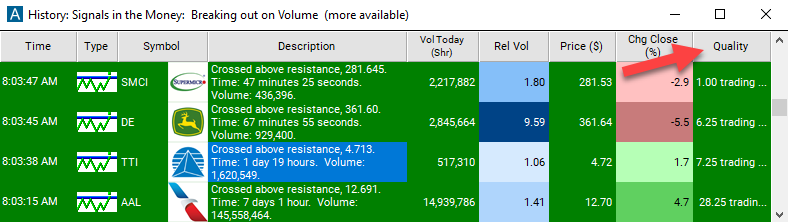
Description Column
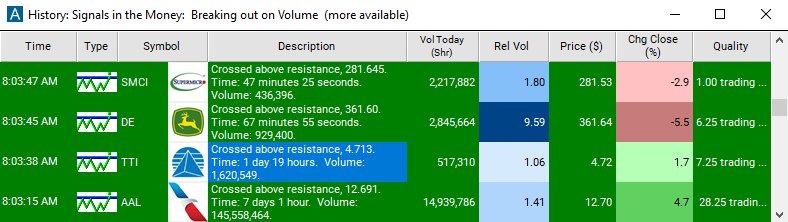
The description of the alert will report the price at which the stock crossed above its resistance, how long ago the resistance pattern was established, and the volume at the time the resistance was crossed.
Quality Column
The quality value on a scan using the 'Crossed Above Resistance' alert represents the number of hours since the resistance pattern has been established.
Alert Info for Crossed Above Resistance [CAR]
- description = Crossed above resistance
- direction = +
- keywords = NBBO Confirmed Support and Resistance
- flip_code =
 Crossed below support [CBS]
 - parent_code =