


15 Minute Linear Regression Up Trend
Table of Contents
- Understanding the 15 Minute Linear Regression Uptrend Alert
- Default Settings
- Custom Settings
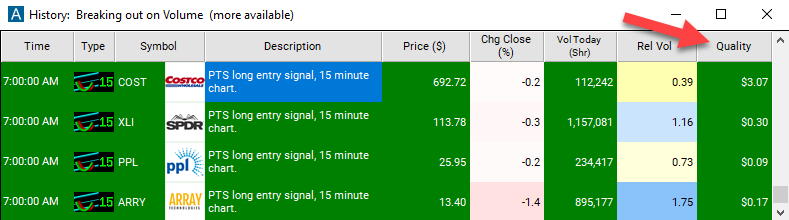
- Description Column
- Quality Column
Understanding the 15 Minute Linear Regression Uptrend Alert
For each stock we perform short and long term linear regression analysis. We use the longer term linear regression to form a channel, and tell us where the stock is likely to move. We use the shorter term linear regression to show us the stock's current momentum. When a stock starts moving from one side of the channel to the other, we report an alert.
Linear regression is a statistical method used to model the relationship between two variables, typically the price of a stock and time. When applied to stock trading, linear regression can help identify trends and patterns in the price movement of a stock over time.
A "linear regression uptrend alert" is a notification triggered when the linear regression analysis indicates that the stock price is moving in an upward direction with a certain degree of significance. This means that the slope of the linear regression line is positive, indicating that the stock's price is generally increasing over time.
Traders often use uptrend alerts as a signal to potentially buy or hold onto a stock, as it suggests that the stock's price is likely to continue rising in the near future.
Here's how it works:
Data Collection: Traders gather historical price data for a particular stock, usually over a specific time frame, such as weeks, months, or years.
Calculation of Linear Regression Line: Using this historical price data, a linear regression line is calculated. This line represents the best-fit straight line through the data points, minimizing the overall distance between the line and the actual data points.
Interpretation of the Slope: If the slope of the linear regression line is positive, it indicates an uptrend. This means that, on average, the stock's price has been increasing over the analyzed period.
Confirmation and Decision Making: Traders often use the presence of a linear regression uptrend as one of many factors in their decision-making process. It may confirm their bullish sentiment or prompt them to consider buying opportunities.
Default Settings
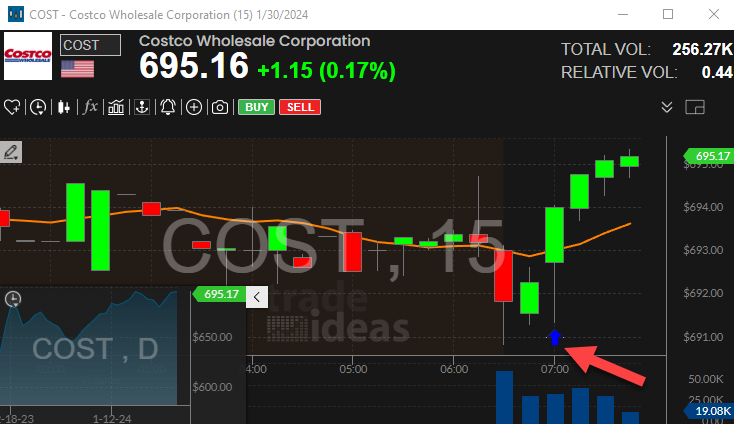
By default, the '15 Minute Linear Regression Uptrend' alert will appear when the linear regression analysis indicates that the stock price is moving in an upward direction. To align with each alert, it's essential to utilize the corresponding time frame on the chart. For instance, this alert is visualized on the 15-minute candlestick chart.
Custom Settings
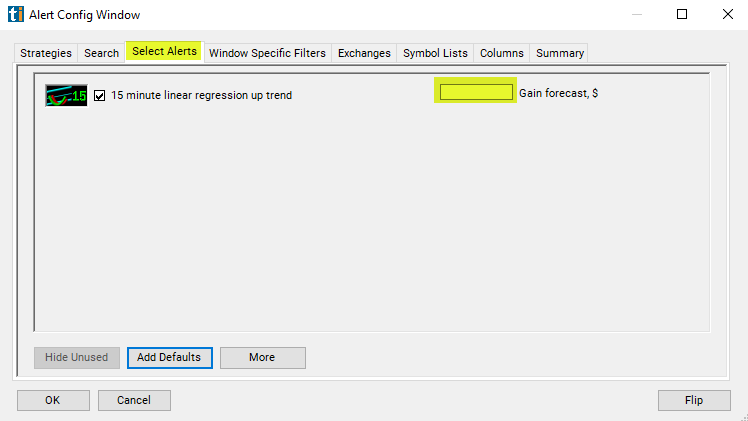
For '15 Minute Linear Regression Uptrend' alerts, you have the option to use an alert specific filter. This filter is located immediately to the right of the corresponding alert and is always optional. You can decide to leave it blank if you want to receive more alerts, or you can fill it in to restrict the number of alerts you receive. This filter allows you to specify the quality of the alert. When you set a higher number for this filter, you are telling the alerts server to display only alerts that meet a higher quality standard, resulting in fewer alerts being shown.
When setting an alert for '15 Minute Linear Regression Uptrend', the user can filter the alert by dollars per share. Each entry signal comes with a forecast of how far the stock will move, in dollars per share. By default you see all signals. By specifying a value for this filter, you will only see stocks expected to move more than that value.
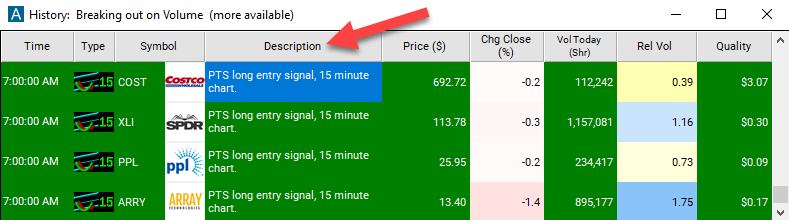
Description Column
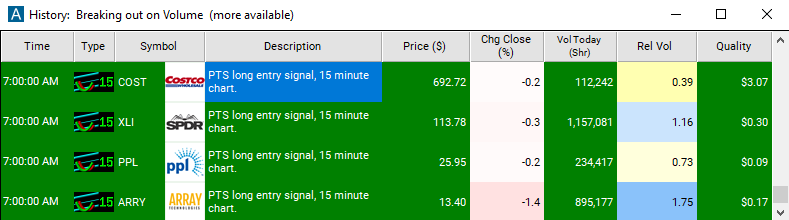
The alert's description will provide details on a long entry signal, including the timestamp of the last reported signal.
Quality Column
The quality value on a scan using the '15 Minute Linear Regression Uptrend' represents the amount of room left in the channel.
Alert Info for 15 Minute Linear Regression Up Trend [PEU15]
- description = 15 minute linear regression up trend
- direction = +
- keywords = Fixed Time Frame
- flip_code =
 15 minute linear regression down trend [PED15]
 - parent_code = PEU5