
Light Mode

Range, channel and resistance breakouts across the market, confirmed by volume, live.
Consolidation, channel, resistance and pattern breakouts, with volume-confirmed versions.
Free account, just an email. No card. Live access for a limited time.

Named to the Inc. 5000 list of America’s fastest-growing private companies six years in a row (2017–2022).

Investopedia: Best Short Term Stock Screener, 2024
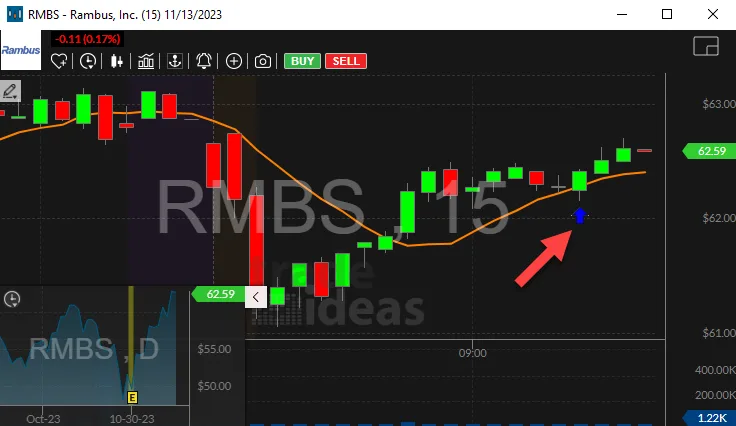
A breakout is price leaving a range it has held. Trade Ideas tracks the ranges, lines and patterns for every stock and fires when price breaks out.
Streaming Alerts (Scanner) run in TI Pro, our desktop app for Windows (on a Mac, through Parallels).
Stocks pushing out of a tight range, a channel, a resistance line or a multi-day high. Those are places where a lot of traders are watching, so a break often draws in more buying.
"Breakout stocks today with high volume" is what most people mean. The volume part matters: a break on light volume fails more often.
| Alert or filter | What it does |
|---|---|
| 5 Minute Consolidation Breakout (CBO5) | Price breaks out of a 5 minute consolidation. |
| 15 Minute Consolidation Breakout (CBO15) | Out of a 15 minute consolidation. |
| 30 Minute Consolidation Breakout (CBO30) | Out of a 30 minute consolidation. |
| Channel Breakout (CHBO) | Channel breakout. |
| Channel Breakout (confirmed) (CHBOC) | Channel breakout, volume confirmed. |
| Crossed Above Resistance (CAR) | Crosses above a Trade Ideas resistance line. |
| Crossed Above Resistance (confirmed) (CARC) | The same, volume confirmed. |
| Crossed Daily Highs Resistance (CDHR) | Breaks above prior daily highs, like a 5 or 10-day high. |
| 5 Minute High (IDH5) | Breaks the prior 5 minute bar's high. |
| 15 Minute High (IDH15) | Breaks the prior 15 minute bar's high. |
| Triangle Top (GTTOP) | Triangle top pattern completes. |
| Rectangle Top (GRTOP) | Rectangle top pattern completes. |
| Position in Consolidation (RCon) | Position in consolidation. Above 100 = broke out the top. |
| Consolidation (ConDays) | Days in a daily consolidation. |
| Relative Volume (RV) | Relative volume, to keep breakouts with real volume. |
Use the confirmed alerts, Channel Breakout (confirmed) (CHBOC) and Crossed Above Resistance (confirmed) (CARC), which wait for volume. Or add Relative Volume (RV) at 2 or more to any breakout window.
Consolidation (C) fires as a tight range forms. 5 Minute Consolidation Breakout (CBO5) through 30 Minute Consolidation Breakout (CBO30) fire when price leaves it. On the daily chart, Consolidation (ConDays) finds multi-day bases and Position in Consolidation (RCon) above 100 shows the break.
False Gap Up Retracement (FGUR) fires when a stock gaps up, fills part of the gap, then turns and pushes back above the open. On the chart it looks like a horseshoe, an intraday cup pattern on a gap.
It is not a classic multi-week cup and handle. Trade Ideas has no alert for that shape, so this page does not claim one.
Trade Ideas cannot detect the flag shape itself. A flag-style recipe is a prior run, Change (5 day, %) (U5DP) at a min like 10, plus a tight base, Consolidation (ConDays) or Position in Consolidation (RCon), then 5 Minute Consolidation Breakout (CBO5) or Channel Breakout (CHBO) for the break.
Range breakouts. Out of a tight consolidation.
Channel breakouts. Out of a rising, falling or flat channel.
Level breakouts. Through a resistance line or a prior high.
Pattern breakouts. Out of a triangle or rectangle.
Bar breakouts. Above the prior bar's high, the smallest kind.
Several breakout alerts come in two versions. The unconfirmed one fires as soon as price crosses. The confirmed one waits for volume, so it fires a little later.
Traders who want the earliest entry use the unconfirmed version and accept more false starts. Traders who want fewer false starts use the confirmed one.
For quick trades, 5 Minute High (IDH5) fires when the current 5 minute bar breaks the prior one's high. It is the simplest breakout there is and fires often; add Relative Volume.
Crossed Daily Highs Resistance (CDHR) fires when price clears a multi-day high, and the description shows how many days. A break of a 20-day high on Relative Volume (RV) above 2 is a common swing setup.
A breakout needs new buyers. Relative Volume shows whether they showed up. Many traders want at least 1.5 to 2 times normal volume on the break.
A common way to set a target is to take the height of the range and add it to the breakout point. It is a rule of thumb, not a forecast.
Those tools let you set breakout rules on charts or in a screener. Trade Ideas tracks the ranges and levels for every stock and streams the break.
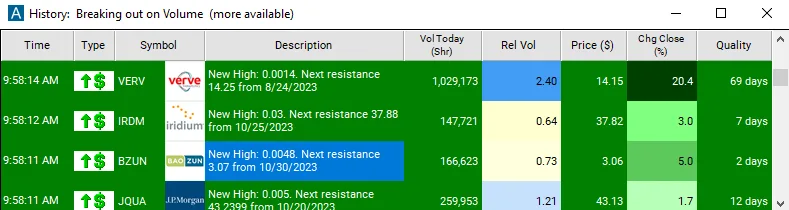
This real window ran the New High (NHP) alert. At 9:58:14 a.m. ET, Verve Therapeutics (VERV) printed a new high at $14.15, up 20.4% on the day, on Relative Volume of 2.40. The description read "Next resistance 14.25 from 8/24/2023," and the quality column showed 69 days.
That quality number is the lookback. A 69 day high means the stock had not traded this high since late August. In the same window, BZUN made a 2 day high on Relative Volume of 0.73. Both are new highs. Only one is a breakout most traders would care about.
The next resistance in the description is the useful part. VERV had ten cents of room before the August level. A breakout trader reads that before buying.
Intraday breakouts on volume
| Alert or filter | Setting |
|---|---|
| Channel Breakout (confirmed) (CHBOC) | On. Channel breakout, confirmed. |
| 15 Minute Consolidation Breakout (CBO15) | On. Breaks out of a 15 minute consolidation. |
| Crossed Above Resistance (confirmed) (CARC) | On. Crosses above resistance, confirmed. |
| Relative Volume (RV) | Min 2. |
| Average Daily Volume (5 day) (Vol5D) | Min 300,000 shares. |
Daily breakouts for swing trades
| Alert or filter | Setting |
|---|---|
| Crossed Daily Highs Resistance (CDHR) | On. Crosses resistance built from daily highs. |
| Consolidation (ConDays) | Min 5, so the stock has been in a tight range for a week or more. |
| Change From 50 Day SMA (%) (MA50P) | Min 0, so price is above the 50 day. |
| Dollar Volume (DV) | Min $10 million. |
Short sellers run the same setup the other way. Channel Breakdown (confirmed) (CHBDC) is the confirmed channel breakdown, 15 Minute Consolidation Breakdown (CBD15) is the 15 minute consolidation breakdown, Crossed Below Support (confirmed) (CBSC) is the confirmed break below support, and Crossed Daily Lows Support (CDLS) is the break of support built from daily lows. Keep Spread (Spread) tight on shorts; a wide spread on a falling stock makes a clean exit hard.
Most breakout alerts carry a quality number. For new highs it is the lookback in days. For channel and consolidation alerts it measures how clean the pattern was. Setting a minimum on the quality filter for an alert is the fastest way to cut the list down.
Start loose, watch for a day, and then raise the minimum until the window shows a number of alerts you can actually look at.
Pre-market Highs (HPRE) fires when a stock tops its earlier premarket high. Once the market opens, Position in Pre-Market Range (RPM) at a min of 100 shows stocks trading above the premarket high. A stock that breaks its premarket high on opening volume is one of the first breakouts of the day.
Position Of Open (POORP), Position of Open, places today’s open inside yesterday’s range. 100.1 or more means it opened above yesterday’s high. Pair it with 5 Minute Opening Range Breakout (ORU5) for stocks that opened above yesterday’s high and then broke their first 5 minute range too.
Change From The Open (% of ATR) (FOW) measures the move since the open against the stock’s Average True Range. A reading of 1 means it has already moved a full normal day’s range. Breakouts on a stock that is already at 1.5 ATR have less room left than a fresh one.
Example numbers, not a real trade
Market Cap (MCap) sets a market cap range. Small caps break out further but fail more. Large caps move less but hold breakouts better. Many traders run two windows with different volume floors for each.
Opening breakouts come fast and fail fast. Late morning breakouts out of a consolidation after the open settles tend to be cleaner. Afternoon breakouts are rarer; when one comes in the last hour on rising volume, it can carry to the close.
Many breakouts fail and fall back into the range. Know your stop before you enter.
Unconfirmed alerts fire sooner and fail more. Confirmed ones fire later.
Test your rules in a simulated account first.
Free account, just an email. No card. Live access for a limited time.
Plain answers to what traders search for.
A scanner that alerts when stocks break out of a range, channel or resistance level. Trade Ideas streams them live, with volume-confirmed versions.
Use the confirmed alerts, CHBOC and CARC, or add Relative Volume at 2 or more.
You can try it with a free account, just an email, no card. Live access is for a limited time, then it is part of a paid plan.
Not the classic multi-week shape. The False Gap Up Retracement alert finds an intraday cup pattern on a gap.
Not as a shape. A prior-run plus tight-base recipe gets close.
Streaming Alerts run in TI Pro, our desktop app for Windows. On a Mac, traders run it through Parallels. Top Lists (Screeners) also run in the Web Dashboard, in a browser.
Price leaving a tight range. The Consolidation Breakout alerts fire on 5, 10, 15 and 30 minute ranges.
Use the confirmed alerts and Relative Volume, and know your stop.
Past results, including backtests, don't guarantee future results.
Free account, just an email. No card. Live access for a limited time. Ready to buy? See plans & pricing

