


Spread
Table of Contents
- Understanding the Spread Filter
- Spread Filter Settings
- Using the Spread in Trading
- FAQs about Spread
Understanding the Spread Filter
The Spread Filter helps traders focus on stocks within a desired spread range. The spread is essentially the cost or gap between the bid and the ask price. The bid price represents the highest price a buyer is willing to pay for a stock, while the ask price represents the lowest price at which a seller is willing to sell the stock.
Monitoring spreads provides insights into market liquidity, trading costs, and opportunities. Wide spreads may require caution and analysis, while narrow spreads indicate better trading conditions and ease of execution.
High spreads result from factors like low volume or limited market participants, posing challenges such as higher costs and difficulty executing desired trades. Conversely, low spreads suggest higher liquidity and efficiency.
Our Bid-Ask-Spread is calculated in real-time based on the Level 1 information at the time of the alert, no smoothing or averaging takes place.
Spread Filter Settings
The settings of each Trade Ideas filter are defined in the Window Specific Filters Tab located in the Configuration Window of your Alert/Top List Window.
The spread filter works by setting a minimum and/or maximum spread value. Stocks with spreads that fall outside of this range will be excluded from the scan results.
You can customize the minimum and maximum spread values according to your specific trading preferences.
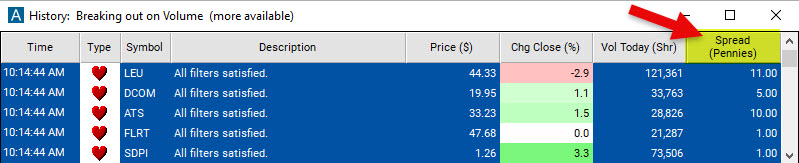
The Trade Ideas Spread is defined in pennies. If the Spread column displays 50.00, it means that the spread is 50 cents (see image above).
-
To find stocks that have a spread between $0.10 to $0.25, add the Spread Filter to your scan and enter 10.00 in the minimum field and 25.00 in the maximum field in the Windows Specific Filters Tab.
-
To exclude stocks with spreads above 30 cents, add the Spread Filter to your scan and enter 30.00 in the maximum field in the Windows Specific Filters Tab.
Using the Spread in Trading
Here are some examples of how traders utilize spread in their trading:
-
For actively traded large-cap stocks, traders often look for spread ranges of a few cents to a few dimes. These stocks typically have high liquidity and significant trading activity. A spread range of $0.02 to $0.10 allows traders to focus on stocks with narrow bid-ask spreads, indicating favorable trading conditions and ease of execution.
-
Traders focusing on mid-cap or smaller-cap stocks may consider slightly wider spread ranges compared to large-cap stocks. A typical spread range for these stocks ranges from a few dimes to a few quarters. A spread range of $0.10 to $0.25 helps traders identify stocks with slightly wider bid-ask spreads, considering the stock's liquidity and market capitalization.
-
Highly liquid and popular stocks often exhibit extremely tight bid-ask spreads due to their high trading volume and market demand. Traders in these stocks expect even tighter spreads, typically ranging from a few pennies to a few dimes. A spread range of $0.01 to $0.10 allows traders to focus on stocks with minimal price gaps, indicating high liquidity and efficient trading conditions.
FAQs about Spread
How can I use the spread to my advantage?
The spread can be used to your advantage by identifying stocks with narrow spreads. Narrow spreads indicate good liquidity and favorable trading conditions.
How can I see the spread of a stock expressed as a percentage?
To express the spread as a percentage, you could use the following formula in our Formula Editor:
((ask - bid) / (ask + bid) / 2) * 100
Here's the breakdown:
-
Subtract the bid price from the ask price to find the spread in dollar terms.
-
Calculate the midpoint by adding the bid and ask prices together and then dividing by 2.
-
Divide the dollar spread by the midpoint.
-
Multiply the result by 100 to convert it to a percentage.
For example, if you have an Ask of $10.10 and a Bid of $10.00:
So the spread as a percentage would be:
Spread (%) = (Spread ($) / Midpoint) 100 = ($0.10 / $10.05) 100 = ~0.996%.
This gives you an indication of the relative size of the spread to the current stock price, allowing you to assess the liquidity and potential transaction cost of the stock. A larger spread percentage might indicate less liquidity and higher transaction costs, while a smaller spread percentage can indicate the opposite.
What are some other ways to measure liquidity?
In addition to spread, there are several other ways to measure liquidity in the financial markets:
-
Float Turnover: Float Turnover represents the percentage of publicly available shares traded within a specific timeframe. High turnover indicates active trading and good liquidity. High turnover indicates that the stock is being actively traded, which is a sign of good liquidity. For more info, head to our Float Turnover filter
-
Volume: Volume refers to the total number of shares traded during a specific period. Higher trading volume typically indicates greater liquidity, as it suggests a larger number of market participants actively buying and selling the stock. Trade Ideas has numerous Volume filters for traders of all time frames available.
-
Average Daily Trading Volume: Average Daily Trading Volume represents the average number of shares traded over a specific period, usually calculated on a daily basis. Higher Average Daily Trading Volume suggests greater liquidity and ease of entering or exiting positions without significant price impact. We have the following ADTV filters available:
Average Daily Volume (5 Days), Average Daily Volume (10 Days), Average Daily Volume (3 Months)
-
Time and Sales: Time and sales data shows the individual trades executed for a stock, including the trade price, volume, and time stamp. Analyzing time and sales can provide information about the frequency and size of trades, which can be indicative of liquidity levels. You will get this data from your broker.
How do multiple filters and alerts work together with the Spread Filter?
When multiple filters are applied in a scan, they work as "ANDs" meaning that all the filters need to be satisfied by a stock for it to be included in the scan results.
When multiple alerts are used in a scan, they work as "ORs" indicating that only one of the alerts, along with satisfying all the filters, needs to be met for a stock to appear in the scan results.
Do you have step-by-step tutorials on how to build scans?
Please watch the following three short videos on how to create Alert and Top List Windows Scans in Trade Ideas:
Filter Info for Spread [Spread]
- description = Spread
- keywords = Bid and Ask
- units = Pennies
- format = p
- toplistable = 1
- parent_code = Price