


Dollar Volume
Table of Contents
- Understanding the Dollar Volume Filter
- Dollar Volume Filter Settings
- Using Dollar Volume in Trading
- FAQs about Dollar Volume
Understanding the Dollar Volume Filter
- Tracing Market Momentum through Monetary Flow -
The Dollar Volume Filter is a simple, yet powerful tool to understand the liquidity and activity of a given security in the market.
This filter takes into account two crucial factors: the current price of the stock and its average trading volume over the past ten days. By multiplying these two variables, the filter calculates the dollar volume per day, representing the total amount of money spent on the stock within a single trading day.
To illustrate the calculation, let's consider an example. Suppose a stock has a current price of $20 per share and an average trading volume over the last 10 Days of 300,000 shares per day. When these figures are multiplied ($20 x 300,000), the result is a dollar volume of $6 million per day. This means that, on average, investors are spending $6 million each day buying and selling shares of this particular stock.
This filter is particularly useful for active traders and institutions who need to execute large trades efficiently, as it helps identify stocks with sufficient trading volume and market interest.
Dollar Volume Filter Settings
Activating the Dollar Volume Filter is straightforward. You'll find its settings under the Window Specific Filters Tab in your Alert/Top List Window's Configuration Window. You can set a minimum and/or maximum value, and stocks that don't fit within your parameters are automatically excluded from your scan results.
Here's an example:
-
To find stocks with a Dollar Volume of at least 1 Million, add the Dollar Volume Filter to your scan and enter 1000000 in the minimum field in the Windows Specific Filters Tab.
-
To find stocks with a Dollar Volume of no more than 15 Million, add the Dollar Volume Filter to your scan and enter 15000000 in the maximum field in the Windows Specific Filters Tab.
Using Dollar Volume in Trading
Here are a few trading strategies that incorporate dollar volume settings as part of their criteria:
-
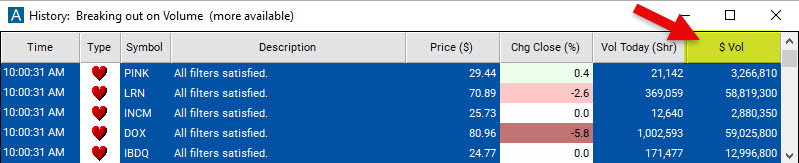
High Volume Breakouts: This strategy focuses on identifying stocks that experience significant price movements accompanied by high dollar volumes. Traders using this strategy look for stocks that break out of key price levels or chart patterns with a surge in trading activity. They set a minimum dollar volume threshold to ensure sufficient liquidity and confirm the validity of the breakout. By combining price action with dollar volume, traders aim to capitalize on the momentum created by strong market interest.
-
Liquidity-based Scalping: Scalping is a short-term trading strategy where traders aim to capture small price movements by entering and exiting positions quickly. Traders employing this strategy often require stocks with high dollar volumes to ensure quick execution of their trades. They set a minimum dollar volume threshold to filter out illiquid stocks that may hinder their ability to enter and exit positions promptly.
-
Volume Confirmation in Trend Trading: To confirm the strength of a trend, traders may incorporate dollar volume as a confirmation tool. They look for an increase in dollar volume that aligns with the prevailing trend, indicating continued market interest and participation. For example, if a stock is in an uptrend, traders may set a minimum dollar volume threshold to ensure the trend is supported by sufficient trading activity, thus increasing their confidence in the trade.
-
Volume Divergence in Reversal Trading: Reversal traders seek to identify potential turning points in stock price movements. They often incorporate dollar volume analysis to identify divergence between price and volume. For instance, if a stock shows a significant price decline but with decreasing dollar volumes, it may indicate weakening selling pressure and a potential reversal. By setting specific dollar volume criteria, reversal traders can filter out stocks that lack confirmation through volume divergence.
-
Volume Weighted Average Price (VWAP) Trading: VWAP is a widely used indicator that calculates the average price at which a stock has traded throughout the day, weighted by its trading volume. Traders employing VWAP strategies often utilize dollar volume thresholds to select stocks that align with their preferred trading style. They may set minimum and maximum dollar volume thresholds to identify stocks with sufficient liquidity to track the VWAP effectively and avoid highly illiquid stocks that may deviate significantly from the average price.
These are just a few examples of trading strategies that incorporate dollar volume settings. Traders often combine dollar volume with other indicators and factors to build comprehensive trading approaches tailored to their specific objectives and preferences.
FAQs about Dollar Volume
What are the typical minimum and maximum values for dollar volume for different types of stocks (e.g., blue-chip stocks, penny stocks)?
Dollar volume varies greatly across different types of stocks, and there's no universally agreed-upon "typical" value for each category. However, generally speaking:
-
Blue-Chip Stocks: Blue-chip stocks are shares in large, well-established, and financially stable companies with a history of reliable performance. These stocks often have a high dollar volume due to their popularity among institutional and individual investors. Their dollar volumes can easily reach hundreds of millions or even billions of dollars per day. For instance, shares of companies like Apple or Microsoft often see daily dollar volumes in the billions.
-
Mid-Cap Stocks: These are stocks of medium-sized companies that have a market capitalization typically ranging between $2 billion and $10 billion. Mid-cap stocks can see a wide range of dollar volumes depending on the company and market conditions, but it's not uncommon to see dollar volumes in the tens or hundreds of millions.
-
Small-Cap Stocks: These are smaller companies with a market capitalization typically under $2 billion. These stocks generally have lower dollar volumes, which might range from a few hundred thousand to several million dollars per day.
-
Penny Stocks: These are low-priced stocks, often less than $5 per share, from small companies. The dollar volume of penny stocks can vary greatly, but it's not uncommon for these stocks to have daily dollar volumes in the thousands to low millions. Because of their low price, even a small absolute change can lead to a significant percentage change, attracting speculative investors. However, their low dollar volume can also lead to higher volatility and lower liquidity, which increases risk.
What are the risks of relying heavily on dollar volume as a trading indicator?
While dollar volume is a critical metric in trading, over-reliance on it as the primary trading indicator can lead to several risks:
-
Doesn't Account for Price Direction: Dollar volume indicates the total value of shares traded but doesn't show if the activity was mainly buying or selling. High dollar volume could occur due to large numbers of either buyers, sellers, or both.
-
False Signals: A surge in dollar volume might seem to indicate growing interest in a stock. However, it could also be due to other factors like large trades by institutional investors, significant news events, or manipulative trading practices. This could result in false signals and misinterpretation of market sentiment.
-
Neglecting Other Key Indicators: If you focus too much on dollar volume, you might neglect other crucial trading indicators and metrics. These could include price trends, fundamental analysis, and other technical indicators. A well-rounded trading strategy should consider multiple data points and indicators.
-
Liquidity Misinterpretation: High dollar volume often suggests high liquidity, but this is not always the case. A stock may experience a temporary spike in dollar volume due to a news event, which might not persist. This could lead to misinterpretations of a stock's true liquidity.
-
Doesn't Reflect Overall Market Conditions: Dollar volume can change significantly based on overall market conditions. High dollar volume in a single stock doesn't necessarily mean the broader market is healthy or favorable for trading.
-
Risk of High Volatility: High dollar volume often correlates with high volatility. While this might be desirable for some traders (like day traders), for others, this could increase the risk profile of their investment. High volatility can result in large price swings, potentially leading to losses if not properly managed.
In conclusion, while dollar volume is a valuable metric for understanding market liquidity and activity, it should not be used in isolation. As always, thorough due diligence and careful risk management are crucial for successful trading.
What are the benefits of computing dollar volume using the current stock price multiplied by the average daily volume over the past 10 days, compared to calculating it using the current stock price multiplied by Today's Volume?
Both of these calculations provide insights into a stock's liquidity and trading activity, which are crucial for trading decisions. However, they offer distinct advantages depending on the context:
-
Current Stock Price x Average Daily Volume Over the Past 10 Days: This method gives you an average measure of dollar volume. This can help smooth out daily fluctuations in trading volume. By averaging the volume over the past 10 days, you gain a more consistent and reliable understanding of a stock's liquidity and trading activity. This can be particularly beneficial for traders employing longer-term strategies or those who want to assess the overall trend in a stock's trading activity.
-
Current Stock Price x Today's Volume: This method provides a real-time snapshot of the dollar volume for the current trading day. It allows you to see the most immediate conditions of the stock's trading activity. This can be valuable for intra-day or short-term traders, as it can help identify sudden spikes or drops in volume, which could signal potential trading opportunities or risks. You can create this custom filter with our Formula Editor. Simply use the following code:
[Price]*[TV]
The choice between these two methods largely depends on your trading style and goals. If you're focused more on longer-term trends and consistency, the first method might be more advantageous. However, if you're interested in immediate, day-to-day trading conditions, the second method could offer more valuable insights.
What are the benefits of computing dollar volume using the VWAP multiplied by Today's Volume, compared to calculating it using the current stock price multiplied by Today's Volume?
When calculating the daily Dollar Volume using the formula [Price]*[TV], where [Price] is the current price and [TV] is the Today's Volume in Shares, the formula effectively computes the Dollar Volume at the current moment, which changes throughout the day as both the price and volume fluctuate.
Advantages of using [VWAP]*[TV]:
Reflects Transaction Prices Better: VWAP gives a better indication of the prices at which most transactions were executed throughout the trading day, as it is volume-weighted. The current price can change rapidly, and might not be representative of the overall trading day.
Mitigates Impact of Rapid Price Swings: Prices can fluctuate significantly and rapidly throughout the trading day. VWAP helps mitigate the impact of these fluctuations by providing an average price weighted by volume.
Better Indicator for Institutional Traders: Institutional traders often use VWAP as a benchmark for their trades. Therefore, a dollar volume calculation based on VWAP might provide more useful information for these traders.
Disadvantages of using [VWAP]*[TV]:
Potentially Less Relevant for Immediate Trading Decisions: For immediate trading decisions, the current price might be more relevant as it reflects the latest market conditions. VWAP, while providing a broader view, might be less indicative of the current state of the market.
Less Intuitive: The current price is often more familiar to traders as it's readily available and easy to understand. VWAP, while used by professionals, may not be as intuitive to retail traders.
The most suitable approach would still largely depend on the specific objectives and context of the trader.
I would like to compare the Average Dollar Volume to Today's Dollar Volume to find stocks with an increase in Dollar Volume, how do I do this?
The concept of comparing current dollar volume to average dollar volume is common and can be very useful, especially for traders who rely heavily on volume analysis. The key principle is that higher volume (especially when coupled with significant price movement) often signifies strong investor sentiment and potentially substantial future price movements.
To compare the Average Dollar Volume over the last 10 Days to Today's Dollar Volume, you could create the following custom filter via our Formula Editor: ([VWAP]*[TV]) / (sma_10 * [Vol])
This custom filter calculates the ratio of today's dollar volume ([VWAP][TV]) to the average dollar volume over the past 10 days (sma_10 [Vol]).
Using the 10 Day Simple Moving Average (SMA) is used to provide an estimate of the "average" price for a stock over the past 10 days. The SMA is a calculation that directly seeks to represent the average price over a certain period. This gives a smoothed average price over the period that is little influenced by any individual day's extreme price movement.
This formula will return a ratio. So if you, for instance, are looking for stocks with at least four times the usual dollar volume today, you could add this custom filter to your scan and set a minimum of 4 in the Windows Specific Filters Tab.
This method is combining elements of price, volume, and moving averages.
An alternative could be to simply look at the Relative Volume. Relative Volume compares today's volume to the average volume for the same time of day over a specific past period. This can give a more immediate view of whether trading volume is higher or lower than usual. Trade Ideas does provide a built-in Relative Volume filter that can be used for this purpose.
For instance, if you're looking for stocks with at least twice the usual volume, you could set the Relative Volume filter to a minimum of 2.
Do you have a 1-Minute Dollar Volume Filter?
With the help of our Formula Editor, you can easily create a 1-Minute Dollar Volume Filter. The calculation for the 1-minute dollar volume would look like this: [Price] * v_up_1
This equation means you'd multiply the current price of the stock by the number of shares traded during the last 1-minute interval. This gives you the total amount of money transacted in that stock over that 1-minute period.
Filter Info for Dollar Volume [DV]
- description = Dollar Volume
- keywords =
- units = Dollars/Share x Shares/Day
- format = 0
- toplistable = 1
- parent_code =