


Average Daily Volume (5D)
Table of Contents
- Understanding the Average Daily Volume in 5 Days Filter
- Average Daily Volume in 5 Days Filter Settings
- Using Average Daily Volume in Trading
- FAQs about Average Daily Volume
Understanding the Average Daily Volume in 5 Days Filter
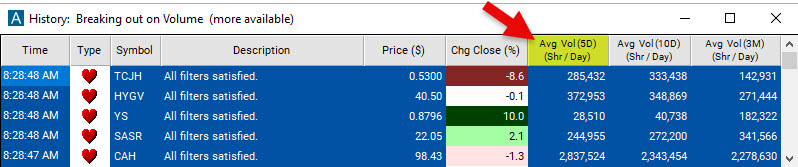
The Average Daily Volume Filter calculates the average volume over the preceding five trading days, sidestepping the noise of temporary volume surges or slumps. With the help of this filter you always know how actively a stock has been traded in the past five days.
Trading volume represents the number of shares traded for a particular stock.
The Average Daily Volume Filter aids traders in spotting liquid stocks, identifying unusual volume patterns, and verifying price movements.
This filter focuses on the past five days' data and does not include the current day's trading volume.
Average Daily Volume in 5 Days Filter Settings
Activating the Average Daily Volume (5D) filter is straightforward. You'll find its settings under the Window Specific Filters Tab in your Alert/Top List Window's Configuration Window. You can set a minimum and/or maximum value, and stocks that don't fit within your parameters are automatically excluded from your scan results.
Here's an example:
-
To find stocks that have traded at least 250,000 shares daily on average over the last five days, add the Average Daily Volume in 5 Days Filter to your scan and enter 250000 in the minimum field in the Windows Specific Filters Tab.
-
To find stocks that have traded no more than 15,000,000 shares daily on average over the last five days, add the Average Daily Volume in 5 Days Filter to your scan and enter 15000000 in the maximum field in the Windows Specific Filters Tab.
Using Average Daily Volume in Trading
Traders can utilize the Average Daily Volume (5D) filter in various ways depending on their trading strategies and preferences. Here are a few examples:
-
Identifying highly liquid stocks: Day traders and scalpers may set a minimum average daily volume, such as 1 million shares, to ensure ample liquidity for rapid entry and exit.
-
Spotting Volume Spikes: Traders who are looking for potential breakout or momentum trading opportunities often search for stocks that have experienced a significant increase in volume compared to their average over the past five days. They might create a custom filter, combining the Average Daily Volume 5 Days filter
[Vol5D]with the Volume Today Filter[TV]to find stocks where the current day's volume is at least 1.5 times the average volume. The custom formula for such a filter, which you could easily create with our Formula Editor would look like this:[TV]/[Vol5D]. -
Confirming Price Trends: Traders who follow trend-following strategies might use the Average Daily Volume (5D) filter to confirm the validity of a price trend. They may look for stocks where the current day's volume is above the average volume over the past five days and the price is moving in the direction of the trend. This combination suggests that the price movement is supported by increased trading activity and strengthens their confidence in the trend.
-
Avoiding Illiquid Stocks: Traders wishing to sidestep thinly traded stocks might set a minimum average daily volume, such as 100,000 shares.
-
Targeting Low-volume Stocks: Some traders specialize in low-volume or thinly traded stocks. These traders look for stocks with relatively low average daily volume over a specified time period because they believe that lower trading activity can present opportunities for price inefficiencies or less competition from other traders. These traders may set a maximum threshold for the Average Daily Volume (5D) filter.
Traders often combine the Average Daily Volume (5D) filter with other indicators or patterns to enhance their trading strategies. Here are a few commonly used ones:
-
Price Patterns: Traders often look for specific price patterns, such as breakouts, pullbacks, or chart formations, in conjunction with the Average Daily Volume filter. For example, they may search for stocks that have experienced a breakout from a consolidation pattern accompanied by a significant increase in volume compared to the average. This combination of price pattern and volume can signal a potential trend continuation or reversal.
-
Moving Averages: Traders may incorporate moving averages, such as the 50-Day SMA or 200-Day Moving Average, to identify trends and assess the relationship between volume and price. They might look for stocks where the current day's volume is above the average daily volume (10D) and the price is trading above a specific moving average. This alignment of volume, price, and moving average can reinforce their trading decisions.
-
Relative Volume: Relative volume compares the current trading volume to its average volume over a specified period. Traders may use relative volume as an additional filter to identify stocks that exhibit unusually high or low volume compared to their historical patterns. This can help them pinpoint stocks that are experiencing significant buying or selling interest, which may be indicative of potential trading opportunities.
-
Volume Oscillators: Volume oscillators, such as the Volume Weighted Average Price (VWAP), provide insights into the relationship between volume and price movements. Traders may use these indicators in combination with the Average Daily Volume filter to gauge the strength or weakness of buying or selling pressure. Divergences or convergences between volume oscillators and the Average Daily Volume filter can highlight potential reversals or trend continuations.
-
Candlestick Patterns: Traders who use candlestick charting often analyze specific candlestick patterns in conjunction with the Average Daily Volume filter. For instance, they may look for high-volume bullish or bearish reversal patterns, such as engulfing patterns, to confirm the potential change in price direction.
-
Volume Breakouts: Traders seeking breakout trading opportunities may combine the Average Daily Volume filter with a breakout strategy. They may search for stocks where the current day's volume significantly exceeds the average daily volume (5D) and the price breaks out above a key resistance level. This combination suggests a surge in trading activity accompanying the breakout, potentially indicating a strong move.
FAQs about Average Daily Volume
Question 1: Can I adjust the time period for the Average Daily Volume filter to look at a different number of days, such as 10 days?
While the timeframe of the Average Daily Volume 5 Days Filter is fixed, but offer the following additional Average Daily Volume filters:
Average Daily Volume (10 Days)
Average Daily Volume (3 Months)
Question 2: What are some potential drawbacks or limitations of using the Average Daily Volume (5D) filter?
While the Average Daily Volume (5D) filter can be a valuable tool for traders, it's important to be aware of its potential drawbacks and limitations. Here are a few considerations to keep in mind:
-
Lagging Indicator: The Average Daily Volume (5D) filter relies on historical trading data from the previous five days. This means it does not capture real-time changes or sudden shifts in trading volume. Combining this filter with intraday Volume filters will enable traders to compare the recent trading volume to the current volume.
-
Limited Time Frame: The Average Daily Volume (5D) filter focuses on the previous five days of trading history. While this can help smooth out short-term fluctuations, it may not provide a comprehensive view of a stock's overall volume trend or longer-term patterns. Traders who require a broader perspective on volume behavior may need to adjust the time frame or complement the filter with additional analysis.
-
Generalization of Volume Patterns: Using the average volume over a fixed time period may overlook variations in volume patterns within that timeframe. Stocks may experience periods of high or low volume on specific days within the five-day window, and the filter may not capture these nuances. Traders should consider combining the Average Daily Volume filter with other indicators or techniques to gain a more detailed understanding of volume dynamics.
-
Variations Across Stocks: Different stocks have different average daily volumes based on their characteristics, industry sector, market capitalization, and investor interest. Comparing the average volume of stocks from different sectors or market segments without considering their specific context may lead to biased or inaccurate conclusions.
As with any trading tool or filter, it's essential for traders to understand its limitations and consider them in the broader context of their trading strategies. The Average Daily Volume (5D) filter can provide valuable insights, but it should be used in conjunction with other analysis techniques and a comprehensive understanding of the market dynamics.
Question 3: How does the average daily volume change over time?
The average daily volume of a stock can fluctuate over time, depending on a number of factors, such as the company's news flow, earnings reports, and overall market conditions. Traders should be aware of these fluctuations and adjust their trading strategies accordingly.
Question 4: What is the ideal average daily volume for a stock?
The ideal average daily volume for a stock will depend on the trader's individual trading style. For example, a day trader might prefer to trade stocks with a high average daily volume, while a swing trader might be comfortable trading stocks with a lower average daily volume.
Different stocks have varying average daily volumes based on factors such as market capitalization, industry sector, and investor interest. Consider the characteristics of the stocks you trade. Larger, more actively traded stocks tend to have higher average volumes, while smaller or niche stocks may have lower volumes. Tailor your filter settings to align with the characteristics of the stocks you are interested in.
Filter Info for Average Daily Volume (5D) [Vol5D]
- description = Average Daily Volume (5D)
- keywords = Changes Daily
- units = Shares / Day
- format = 0
- toplistable = 1
- parent_code =
 Average Daily Volume (10D) [Vol]
 Average Daily Volume (3M) [Vol3M]