
Light Mode

Today's biggest movers, up and down, ranked live, plus this week, month and year.
Sort by change today, in the last 5 minutes, 5 days, 20 days, since January 1 or over a year.
Free account, just an email. No card. Live access for a limited time.

Named to the Inc. 5000 list of America’s fastest-growing private companies six years in a row (2017–2022).

Investopedia: Best Short Term Stock Screener, 2024
A Top List (Screener) sorted by a change filter is a top gainers list. Flip the sort and it is top losers. Top Lists update every 15 seconds.
Top Lists also run in the Web Dashboard, right in your browser. Streaming Alerts (Scanner) run in TI Pro, our desktop app for Windows (on a Mac, through Parallels).
Sort a Top List (Screener) by Change From The Close (%) (FCP), high to low. Add Relative Volume (RV) and a Price range so the list shows real movers, not thin names. Flip the sort for top losers today.
| Alert or filter | What it does |
|---|---|
| Change From The Close (%) (FCP) | Change from yesterday's close, %. |
| Change From The Close ($) (FCD) | Change from the close, $. |
| Change Previous Day (%) (FCPP) | Yesterday's change, %. |
| Change (5 min, %) (PUp5) | Change in the last 5 minutes, %. |
| Change (5 day, %) (U5DP) | 5-day change, %. |
| Change (20 day, %) (U20DP) | 20-day change, %. |
| Change Since January 1 (%) (UpJan1P) | Change since January 1, %. |
| Change (1 year, %) (UYP) | 1-year change, %. |
| Relative Volume (RV) | Relative volume. |
| Price (Price) | Price range. |
Running Up (RU) and Running Down (RD) fire when a stock moves much faster than normal for its volatility. New High (NHP) fires on new highs. Those show who is moving this minute, not just who is up most today.
Before the open, use Gap (%) instead; see the premarket scanner. For stocks under $5, add a Price max of 5; see the penny stock scanner.
The biggest percent gainers are often thin stocks. Add Relative Volume (RV) at 2 or more and a Dollar Volume minimum so the list shows moves with real trading.
Change From The Close ($) (FCD) sorts by dollar change, which favors higher-priced stocks. Some traders run both lists.
Change Previous Day (%) (FCPP) shows yesterday's change. Day-two continuation and day-two fades both start from that list.
Change (5 day, %) (U5DP) for the week, Change (20 day, %) (U20DP) for about a month, Change Since January 1 (%) (UpJan1P) for year to date and Change (1 year, %) (UYP) for a year. Leaders on longer timeframes are a swing trader's watchlist.
The list covers US stocks across exchanges. Use an exchange filter in the Top List settings if you want just one.
Sort by Volume Today instead of change to see the most active stocks.
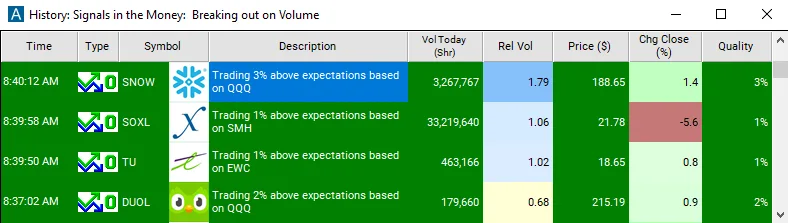
Top gainers lists rank by raw change. Sector Breakout (from Open) (SBOO) asks a different question: is the stock beating its own sector since the open? In this real window, Snowflake (SNOW) at $188.65 was "trading 3% above expectations based on QQQ," while SOXL was 1% above expectations based on SMH even though it was down 5.6% on the day.
That second line is the useful part. A stock can be red and still be the strongest in its group.
| Alert or filter | What it does |
|---|---|
| Change From The Close (%) (FCP) | Change from yesterday’s close in percent. The classic top gainers sort. |
| Change From The Close ($) (FCD) | Change from the close in dollars. |
| Change From The Open (%) (FOP) | Change since today’s open in percent. |
| Change (15 min, %) (PUp15) | Change over the last 15 minutes in percent. |
| Change (5 day, %) (U5DP) | Change over 5 days. |
| Change (20 day, %) (U20DP) | Change over 20 days. |
| Change Since January 1 (%) (UpJan1P) | Change since January 1. |
A stock up 12% from the close may have gapped up 15% and faded. Another up 6% from the close may have opened flat and climbed all day. Sorting by Change From The Open shows the stocks buyers have kept pushing since the bell.
% Up For The Day (PUD) fires as a stock reaches 3%, 5%, 10% and more up on the day, using official prints. A list is a snapshot; the alert tells you the moment a stock joins it. % Down For The Day (PDD) is the version for losers.
Top gainers Top List
| Alert or filter | Setting |
|---|---|
| Change From The Close (%) (FCP) | Min 5. Sort by this column. |
| Relative Volume (RV) | Min 2. |
| Dollar Volume (DV) | Min $5 million. |
| Price (Price) | $2 and up. |
| Spread (Spread) | Max 10 cents. |
Some top gainers pages show a table of today’s movers. This page does not, because it would need a live data feed on the page. The Top List in the Web Dashboard is that table, updating every 15 seconds.
Change (5 min, %) (PUp5) and Change (15 min, %) (PUp15) show change over the last 5 and 15 minutes. Sorting by one of those surfaces stocks that are moving right now, which the daily change column can miss.
Before the open, Change From The Close (%) (FCP) works on premarket prices, and Gap (%) (GUP) shows the gap the stock will open with. Pre-market Highs (HPRE) fires when a premarket gainer makes a new premarket high, so you see which ones are still being bought, not just which ones moved overnight.
Flip the sort and the same Top List shows today’s biggest losers. Some traders watch losers for bounces, using 5 Minute Green Bar Reversal (GBR5) or 25% Pullback From Lows (PFL25) to see when one turns.
The top of the list is often the most stretched. Big gainers can reverse hard.
Test your rules in a simulated account first.
Free account, just an email. No card. Live access for a limited time.
Plain answers to what traders search for.
Sort a Top List (Screener) by Change From The Close (%), high to low.
Sort the same list low to high.
Top Lists update every 15 seconds.
Yes, with the 5-day, 20-day, since January 1 and 1-year change filters.
You can try it with a free account, just an email, no card. Live access is for a limited time, then it is part of a paid plan.
Stocks moving much faster than normal for them. Running Up and Running Down fire on those.
Past results, including backtests, don't guarantee future results.
Free account, just an email. No card. Live access for a limited time. Ready to buy? See plans & pricing

