


Position in Consolidation
Table of Contents
- Understanding the Position in Consolidation Filter
- Position in Consolidation Filter Settings
- Using the Position in Consolidation Filter
- FAQs
Understanding the Position in Consolidation Filter
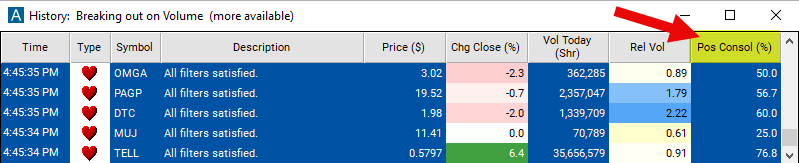
The "position in consolidation" filter in stock trading assesses where a particular stock's current price stands within its recent consolidation range. Consolidation refers to a phase in which a stock's price moves within a relatively narrow range after experiencing a significant price movement. This filter helps traders identify whether a stock is near the upper boundary (resistance) or lower boundary (support) of its consolidation range. A higher number indicates that the stock is closer to the upper boundary, suggesting potential resistance, while a lower number suggests that the stock is closer to the lower boundary, indicating potential support. Traders can use this filter to gauge the likelihood of a breakout or breakdown from the consolidation range and make informed trading decisions based on the stock's position within that range.
This filter is based on the same 40 day chart and the same chart pattern as the 'Consolidation' filter.
Position in Consolidation Filter Settings
Configuring the "Position in Consolidation" filter is simple and can be done within the Window Specific Filters Tab of the Configuration Window in your Alert/Top List Window.
Here's how to set up the filter in your configuration window:
-
Adjust the minimum value to 0 and the maximum to 100 to see stocks which have been consolidating, and are still trading in the same range today.
-
Set the minimum to 100.01 to see only stocks which were consolidating, but have broken out of that range.
-
Set the minimum to 0 and maximum of 15 to see stocks which have not broken out of their consolidation pattern yet, but are trading in the bottom 15% of the consolidation pattern.
Using the Position in Consolidation Filter
The "Position in Consolidation" filter can be used in various trading strategies, including:
Breakout Trading: Traders may look for stocks positioned near the upper boundary of the consolidation range and anticipate a breakout above resistance. They may enter long positions once the stock price breaks out of the consolidation range, aiming to capitalize on potential upward momentum.
Pullback Trading: Traders may wait for stocks positioned near the lower boundary of the consolidation range and anticipate a pullback towards support. They may enter long positions when the stock price retraces back to support levels within the consolidation range, expecting a bounce and potential upward movement.
Range Trading: Traders may take advantage of the stock's oscillation within the consolidation range by buying near support and selling near resistance. They may enter long positions when the stock price approaches support and exit or short positions when it nears resistance, profiting from the price movements within the consolidation range.
Volatility Breakout Trading: Traders may anticipate a significant price movement following a period of consolidation by monitoring volatility indicators. They may enter positions when volatility expands, indicating a potential breakout or breakdown from the consolidation range, and trade in the direction of the breakout.
FAQs
How is consolidation defined in this filter?
- Consolidation refers to a period when a stock's price moves within a relatively narrow range, characterized by lower volatility and a lack of clear trend direction.
How long does consolidation typically last, and can it vary across different stocks?
- The duration of consolidation can vary widely depending on market conditions, stock characteristics, and other factors. While some consolidations may last for just a few hours or days, others could extend for weeks or even months. Each stock may exhibit its own unique consolidation patterns based on its trading dynamics and investor sentiment.
Does the volume play a role in identifying consolidation patterns?
- Yes, volume analysis can be helpful in confirming consolidation patterns. Typically, volume tends to decrease during consolidation periods as traders await a breakout or breakdown. A significant increase in volume accompanying a price breakout or breakdown from consolidation can provide confirmation of the validity of the move.
How can traders distinguish between a consolidation phase and a sideways trend?
- While consolidation and sideways trends may appear similar, they have distinct characteristics. Consolidation typically occurs after a significant price move and is characterized by a contraction in price range and volatility. In contrast, a sideways trend lacks a clear directional bias and may exhibit more erratic price movements without a defined consolidation range.
Filter Info for Position in Consolidation [RCon]
- description = Position in Consolidation
- keywords =
- units = %
- format = 1
- toplistable = 1
- parent_code =