Light Mode

Drawing trendlines on hundreds of charts takes all day. Trade Ideas watches the market for you and flags triangles, double tops, head and shoulders and candle patterns the moment they complete.
Free account, just an email. No card. Live access for a limited time.

Named to the Inc. 5000 list of America’s fastest-growing private companies six years in a row (2017–2022).

Investopedia: Best Short Term Stock Screener, 2024
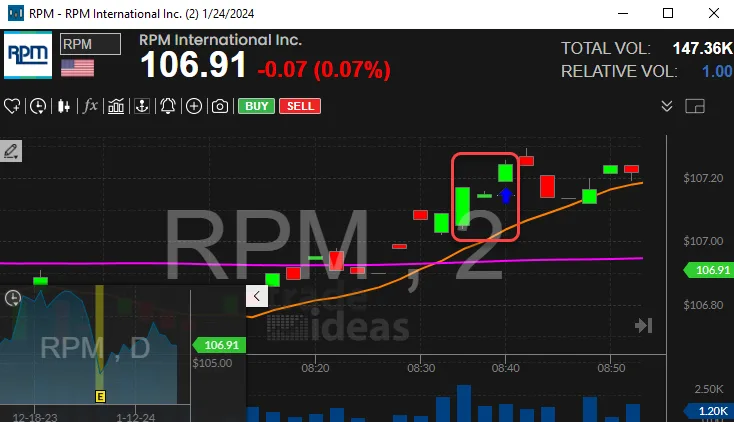
Many pattern scanners refresh on a timer or check one chart at a time. Trade Ideas watches every stock at once and streams the alert the moment the pattern forms. See how streaming pattern alerts compare with TrendSpider.
Each pattern is its own alert with its own rules. When a stock completes one, the alert fires and the description lists the prices that formed it.
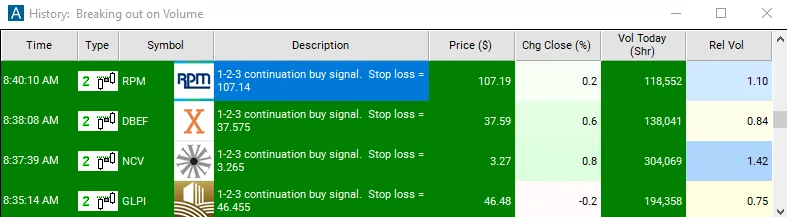
Streaming Alerts run in TI Pro, our desktop app for Windows (on a Mac, through Parallels). More on candles in real-time candlestick pattern recognition.
It finds stocks that just finished a known chart shape. A double top is two highs near the same price. A triangle is lower highs and higher lows squeezing together. A hammer is a candle with a long lower tail.
You could find these by flipping through charts. The scan watches the whole market at once and tells you which stock, which pattern and at what prices.
| Pattern | What it means | Trade Ideas alert |
|---|---|---|
| Triangle | Lower highs and higher lows squeezing together | Triangle Bottom (GTBOT) Triangle Top (GTTOP) |
| Double top / bottom | Two highs, or two lows, near the same price | Double Top (GDTOP) Double Bottom (GDBOT) |
| Head and shoulders | Five turning points, highest high in the middle | Head and Shoulders (GHAS) Inverted Head and Shoulders (GHASI) |
| Rectangle | Price boxed between two levels | Rectangle Top (GRTOP) Rectangle Bottom (GRBOT) |
| Broadening top / bottom | Swings getting wider, higher highs and lower lows | Broadening Top (GBTOP) Broadening Bottom (GBBOT) |
| Consolidation breakout | Price leaves a tight range | 5 Minute Consolidation Breakout (CBO5) 5 Minute Consolidation Breakdown (CBD5) |
| Channel breakout | Price leaves its channel | Channel Breakout (CHBO) Channel Breakdown (CHBD) |
| Crossing support / resistance | Price moves through a level it has turned at before | Crossed Above Resistance (CAR) Crossed Below Support (CBS) |
| MACD crossover | MACD crosses its signal line | 5 Minute MACD Crossed Above Signal (MDAS5) 5 Minute MACD Crossed Below Signal (MDBS5) |
| Stochastic crossover | Stochastic leaves oversold or overbought | 5 Minute Stochastic Crossed Above 20 (SC20_5) 5 Minute Stochastic Crossed Below 80 (SC80_5) |
| Hammer / hanging man | Small body with a long lower tail | 5 Minute Hammer (HMR5) 5 Minute Hanging Man (HGM5) |
| Engulfing | One candle body covers the one before it | 5 Minute Bullish Engulfing (NGU5) 5 Minute Bearish Engulfing (NGD5) |
| Doji | Open and close nearly the same | 5 Minute Doji (DOJ5) |
| NR7 | Narrowest range of the last seven bars | NR7 (15 Minute) (NR7) |
| 1-2-3 continuation | A push, a pause, then the move resumes | 5 Minute 1-2-3 Continuation Buy Signal (C1U_5) 5 Minute 1-2-3 Continuation Sell Signal (C1D_5) |
Most candle, MACD, Stochastic and consolidation alerts come in several bar lengths, like 5, 15 and 60 minutes. The 5 minute version is linked here; the help page lists the rest.
Trade Ideas reads every trade as it prints and keeps each stock’s turning points up to date. When the last piece of a pattern falls into place, the alert fires right then.
Candle alerts fire when the bar closes, since a candle isn’t finished until then. Geometric alerts fire when the final turning point is set.
These are Streaming Alerts in TI Pro, our desktop app for Windows. On a Mac, run it through Parallels.
Watchlist. A pattern on a stock already moving on volume gets a closer look.
Levels. The alert lists the prices that formed the pattern. Traders use those for entries and stops.
Confirmation. Some only take a breakout when a candle pattern lines up with it.
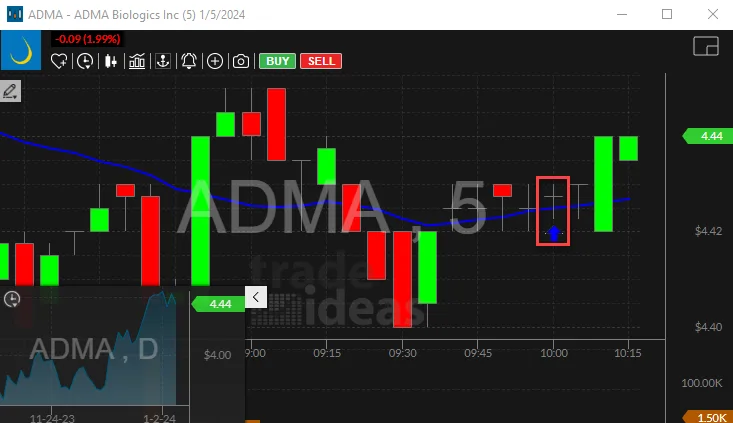
The boxed candle opens and closes at nearly the same price, and the alert marks it as the bar closes. A doji says buyers and sellers were even for that bar. What comes next is up to the following bars.
Patterns fail. A double top can break higher, and a hammer can be followed by more selling.
Short bar lengths fire a lot of alerts. Start with longer bars, or add Relative Volume to cut the noise.
Don’t trade a pattern on a stock with wide spreads or thin volume. The shape means less when few shares trade.
Free account, just an email. No card. Live access for a limited time.
Plain answers to what traders ask about pattern recognition in Trade Ideas.
Software that checks many charts at once for set shapes, like triangles or double tops, and tells you when one completes. Trade Ideas does it with Streaming Alerts, one alert per pattern.
Geometric: triangle, double top and bottom, head and shoulders and inverted, rectangle and broadening tops and bottoms. Candles: hammer, hanging man, engulfing, doji, dark cloud cover, bottoming tail, NR7 and 1-2-3 continuation. Plus consolidation and channel breakouts, support and resistance crosses, and MACD and Stochastic crossovers. See the Geometric and Candle lists.
Yes. The pattern alerts are Streaming Alerts. They fire when the pattern completes, not on the next refresh.
The pattern alerts are rule based. Each one has written rules on its help page, so you can see exactly why it fired. Holly AI Signals are a separate feature and part of TI Premium.
You can try it with a free account, just an email, no card. Live access is for a limited time, then it is part of a paid plan.
TI Pro runs on Windows. On a Mac, traders run it through Parallels.
Sometimes. A pattern shows a shape that has played out before; it does not promise what happens next. Test your rules in a simulated account first.
Past results, including backtests, don't guarantee future results.
Free account, just an email. No card. Live access for a limited time. Ready to buy? See plans & pricing