
Light Mode

Trade Ideas watches every US stock for MACD crosses, candlestick patterns, chart patterns, Fibonacci levels, linear regression trends, moving average crosses and more, and tells you the moment one happens. No chart to open, no scan to refresh.
Free account, just an email. No card.

Named to the Inc. 5000 list of America’s fastest-growing private companies six years in a row (2017–2022).
Investopedia: Best Short Term Stock Screener, 2024
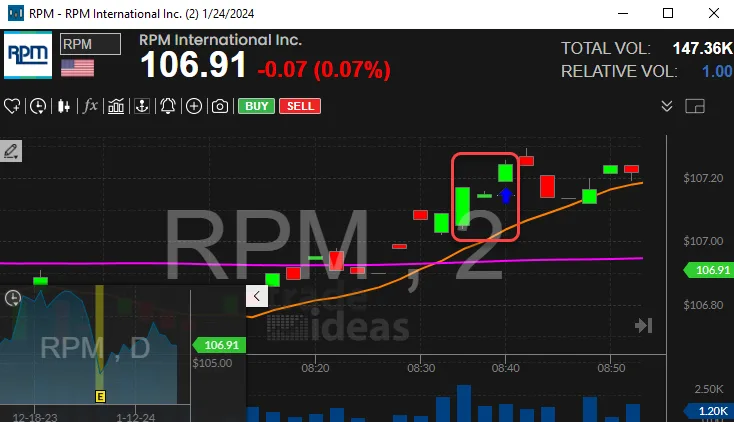
Most "automated technical analysis" draws on the one chart you have open. Trade Ideas does the analysis on every US stock at the same time: 310 Streaming Alerts fire the moment a pattern or indicator signal happens, and 249 filters narrow them to exactly the setup you want. Alerts can fire on every trade. You never press refresh.
Counted from our help library, one page per alert and filter. Each runs live on every US stock:
| Analysis | How many | Examples |
|---|---|---|
| MACD | 20 alerts | MACD crossing above or below its signal line or zero, on 5, 10, 15, 30 and 60-minute charts, such as the 5-minute MACD crossed above signal |
| Candlestick patterns | 88 alerts | Doji, engulfing, hammer, stars and more, each bullish and bearish on several time frames. See the candlestick pattern scanner. |
| Chart patterns | 10 alerts | Triangles, head and shoulders, double tops and bottoms, broadening formations. See chart pattern recognition. |
| Fibonacci | 8 alerts + pivot filters | Buy and sell signals at the 38%, 50%, 62% and 79% retracements, such as the Fibonacci 62% buy signal; distance from pivot, R1, R2, S1 and S2 |
| Linear regression | 8 alerts + 1 filter | Linear regression up and down trends on 5, 15, 30 and 90-minute charts, such as the 15-minute up trend; the Linear Regression Divergence filter |
| Stochastic | 6 alerts | Stochastic crossing above 20 or below 80 on 5, 15 and 60-minute charts |
| Moving averages | 38 alerts + 41 filters | Crosses and distance from moving averages, from intraday to the 200-day. See the moving average crossover scanner and golden cross scanner. |
| Bollinger Bands | 4 filters | Position in Bollinger Bands on 5, 15 and 60-minute and daily charts, such as Position in Bollinger Bands (Daily). See the Bollinger Band scanner. |
| RSI | 6 filters | RSI on 1, 2, 5, 15 and 60-minute and daily charts, such as RSI (15 min). See the RSI scanner. |
| Highs and lows, with the next level | 28 alerts | New highs and lows, intraday to 52-week. Each new-high alert's message tells you the next resistance level ahead, and each new-low alert the next support below, so you know where the move may meet its test. |
| Trend channels, support and resistance | 12 + 12 alerts | Channel breakouts and breakdowns, support and resistance tests. See the support and resistance scanner. |
| Opening range and VWAP | 14 alerts + 4 alerts, 11 filters | Opening range breakouts and breakdowns at 1 to 60 minutes; VWAP crosses and distance from VWAP. See the VWAP scanner. |
Any alert can be combined with any filters, each with a min and a max. That is how you turn single signals into a real setup, checked on every stock at once. For example:
Don't want to pick settings? Describe the setup in plain English and the AI Assistant builds the window for you. Want your own math? Script a filter in the Formula Editor.
For automated analysis on a single chart, TI Wave gives you buy and sell triggers on any stock and any time frame. Its AI adapts EMA bands to each stock and marks a clear B or S on the chart, and you can send the trade to your broker.
OddsMaker replays any alert-and-filter setup on market history and shows every trade and its stats, with no code (TI Premium). Money Machine can then trade it for you with the rules you set (TI Premium).
Past results, including backtests, don't guarantee future results.
Chart-first platforms automate the drawing on the chart you are looking at, and many run scans when you ask. TrendSpider's own Scanner FAQ, for example, says: “At this time, the scanner does not auto-refresh.” Trade Ideas Streaming Alerts run all the time, on every US stock, and can fire on every trade. You find out when the pattern forms, not when you press a button.
Head to head: Trade Ideas vs TrendSpider · Best technical analysis software
Software that finds technical signals for you, such as MACD crosses, candlestick and chart patterns, Fibonacci levels and trend changes, instead of you checking charts by hand. Trade Ideas does it on every US stock at once and alerts you as each signal happens.
Yes. 310 Streaming Alerts detect technical events live on every US stock, including 20 MACD alerts, 88 candlestick pattern alerts, 10 chart pattern alerts, 8 Fibonacci alerts and 8 linear regression trend alerts, and 249 filters narrow them. TI Wave adds buy and sell triggers on any chart.
Yes. There are 20 MACD alerts: MACD crossing above or below its signal line or zero, on 5, 10, 15, 30 and 60-minute charts, across every US stock.
Yes. 88 candlestick pattern alerts find patterns such as doji, engulfing and hammer, bullish and bearish, on several time frames, as they complete.
Yes. Position in Bollinger Bands filters run on 5, 15 and 60-minute and daily charts, and RSI filters on 1, 2, 5, 15 and 60-minute and daily charts. Combine them with any alert.
Yes. When a stock makes a new high, the alert's message tells you the next resistance level ahead; on a new low, it tells you the next support level below.
No. Trade Ideas Streaming Alerts run all the time and can fire on every trade, and Top Lists keep updating. There is no refresh button to press.
Free account, just an email. No card. Ready to buy? See plans & pricing

